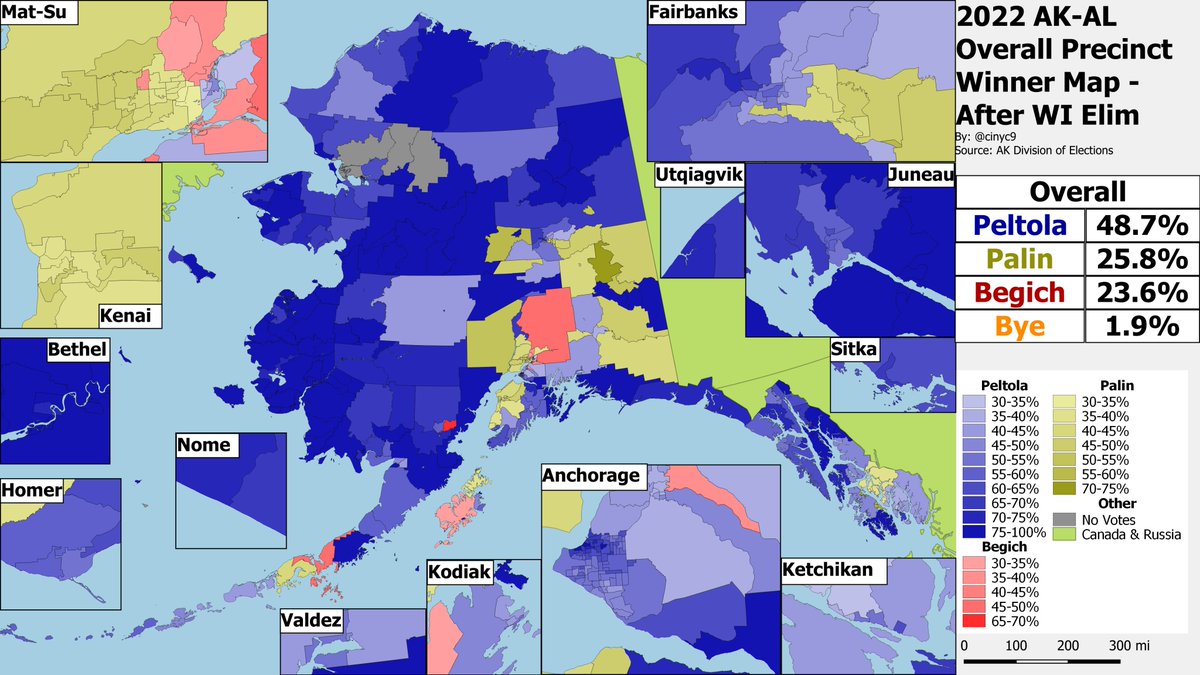
Gif of the overall precinct winner map for the various RCV (and non-RCV) rounds of the AK-AL November GE. @MaryPeltola lead wire-to-wire.
1st map is of the results before any second prefs were allocated; 2nd - 2nd prefs allocated; 3rd - WI eliminated; 4th - bye bye Bye.
#AKpol
1st map is of the results before any second prefs were allocated; 2nd - 2nd prefs allocated; 3rd - WI eliminated; 4th - bye bye Bye.
#AKpol
I've also updated the spreadsheets for the AK-AL race and hypos. This fixes a few minor precinct results errors. They're here:
Actual (Begich eliminated):
docs.google.com/spreadsheets/d…
Palin eliminated hypo:
docs.google.com/spreadsheets/d…
Pelotla eliminated hypo:
docs.google.com/spreadsheets/d…
Actual (Begich eliminated):
docs.google.com/spreadsheets/d…
Palin eliminated hypo:
docs.google.com/spreadsheets/d…
Pelotla eliminated hypo:
docs.google.com/spreadsheets/d…
FYI - @AK_OK @WillMuldoon @alaskanrobby @cdfshcdfsh @leahwrenn @thc1972 @OklahomaPerson @alaskarobotics @Constant4Alaska @tomhewittnews and my other AK followers.
@JMilesColeman @DrewSav @XNeonXO @Thorongil16 @Shane_maps @SeanTrende @PatrickRuffini @HWLavelleMaps @MAlvarezRivera
@JMilesColeman @DrewSav @XNeonXO @Thorongil16 @Shane_maps @SeanTrende @PatrickRuffini @HWLavelleMaps @MAlvarezRivera
The Python scripts I used to translate the AK CSV jsons into a csv with valid marks and turn the CSV marks into these spreadsheets is now available here:
github.com/thecinyc/AK-CVR
github.com/thecinyc/AK-CVR
Finally, the static maps of the RCV rounds.
Note that I allocated the Absentee/Question/Early votes to precincts using the traditional formula to make these maps.


Note that I allocated the Absentee/Question/Early votes to precincts using the traditional formula to make these maps.


* CVR jsons, not csv jsons.
• • •
Missing some Tweet in this thread? You can try to
force a refresh


