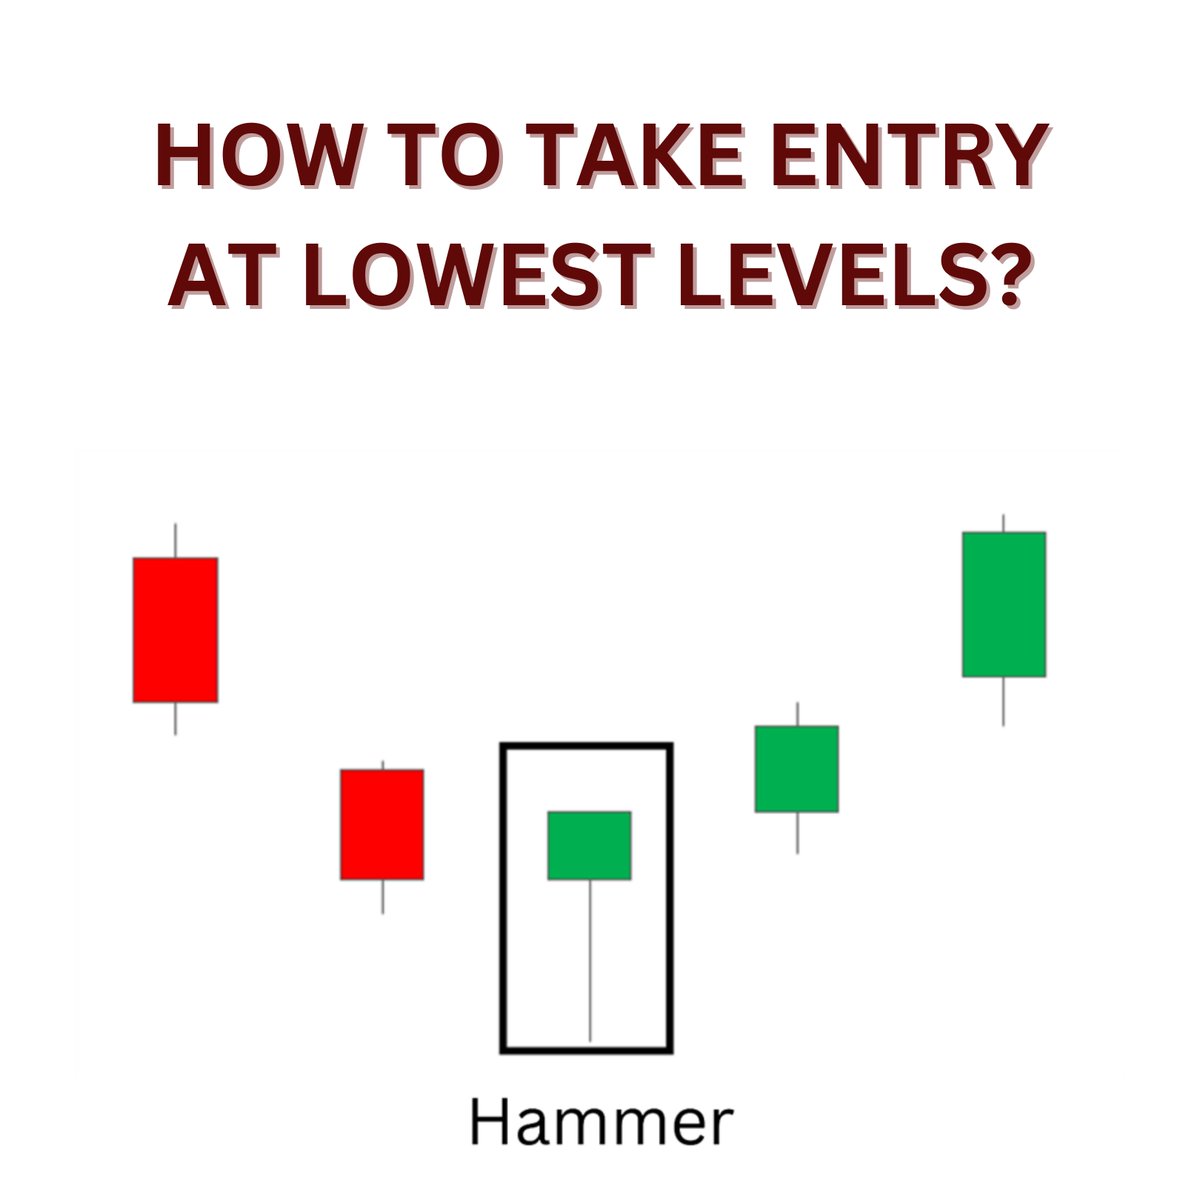
Hammer Candlestick Pattern. 📈
How should you trade with this pattern to take entry at lowest levels?
A THREAD 🧵
(1/13)
#StockMarketindia #trading #StockMarket
How should you trade with this pattern to take entry at lowest levels?
A THREAD 🧵
(1/13)
#StockMarketindia #trading #StockMarket
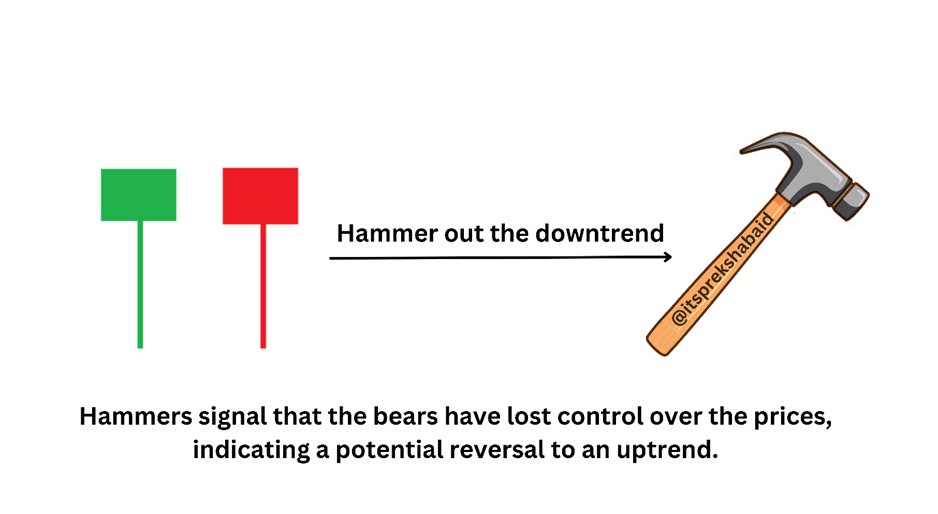
⛏The hammer candlestick is found at the bottom of a downtrend and signals a potential (bullish) reversal in the market.
⛏The hammer candle has a small body, little to no upper wick, and a long lower wick - resembling a ‘hammer’. (2/13)
⛏The hammer candle has a small body, little to no upper wick, and a long lower wick - resembling a ‘hammer’. (2/13)

🔨Hammer candle can be of any colour – It can be either of Green or Red colour.
🔨The lower shadow should be at least two times the height of the real body. (3/13)
🔨The lower shadow should be at least two times the height of the real body. (3/13)
Psychology;
This candle pattern indicates that the price dropped to new lows, but subsequent buying pressure forced the price to close higher, hinting at a potential reversal. The extended lower wick is indicative of the rejection of lower prices. (4/13)
This candle pattern indicates that the price dropped to new lows, but subsequent buying pressure forced the price to close higher, hinting at a potential reversal. The extended lower wick is indicative of the rejection of lower prices. (4/13)
•Reversal signal – Entry for Bulls: It indicates the rejection of lower prices.
When found in a downtrend it could signal the end of selling pressure and begin to trade sideways or reverse, after confirmation such pattern can give the best entey to play reversal. (5/13)
When found in a downtrend it could signal the end of selling pressure and begin to trade sideways or reverse, after confirmation such pattern can give the best entey to play reversal. (5/13)
•Exit signal- For Bears: Traders that have an existing sell position, can view the hammer candle as an indication for reversal and they can take exit to existing sell position. (6/13)
•Confirmation is important :
Entry in any trade should be taken only after the confirmation.
Fomo of entering into a trade without any confirmation can trap you in a wrong trade. (7/13)
Entry in any trade should be taken only after the confirmation.
Fomo of entering into a trade without any confirmation can trap you in a wrong trade. (7/13)
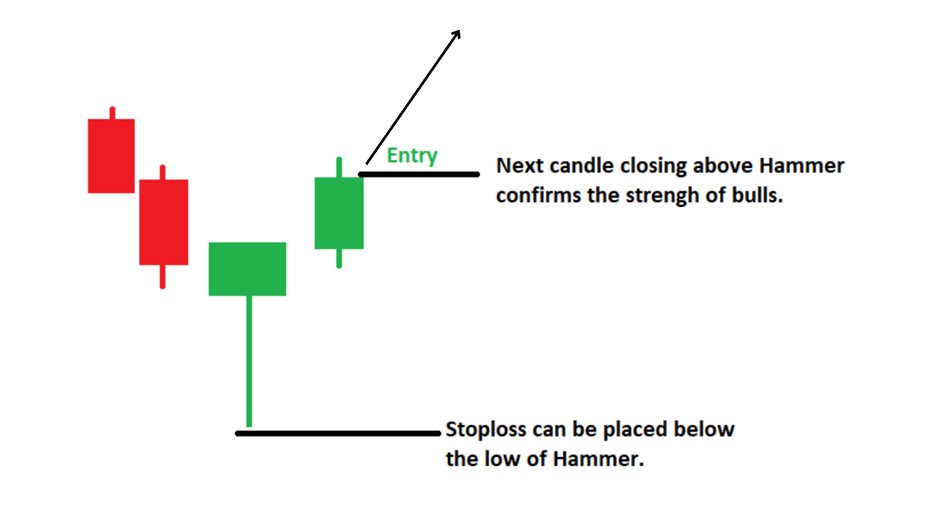
•Stoploss:
Once entered into any trade after the confirmation, stoploss can be placed below the low of hammer candle. (8/13)
Once entered into any trade after the confirmation, stoploss can be placed below the low of hammer candle. (8/13)
Examples
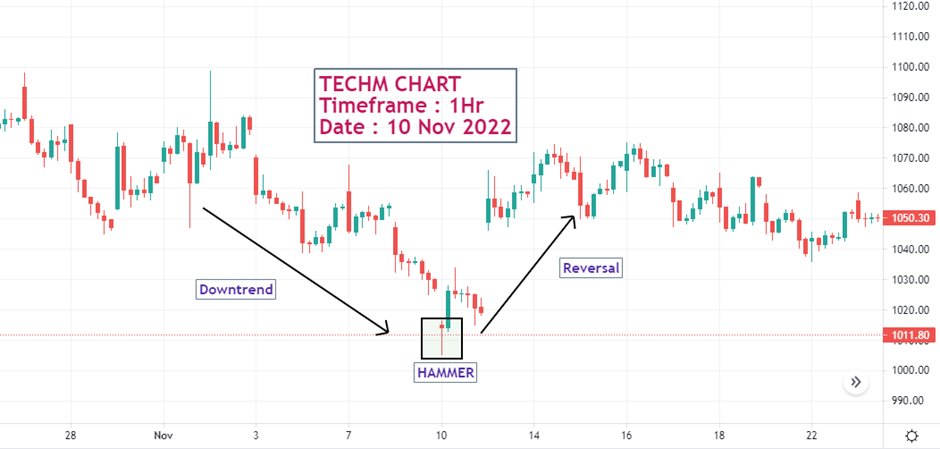
1) TECHM - Stock
•Here we can see the clear downtrend,
•Then formation of hammer candle,
•Next candle gives confirmation and the trend reverse. (9/13)
1) TECHM - Stock
•Here we can see the clear downtrend,
•Then formation of hammer candle,
•Next candle gives confirmation and the trend reverse. (9/13)
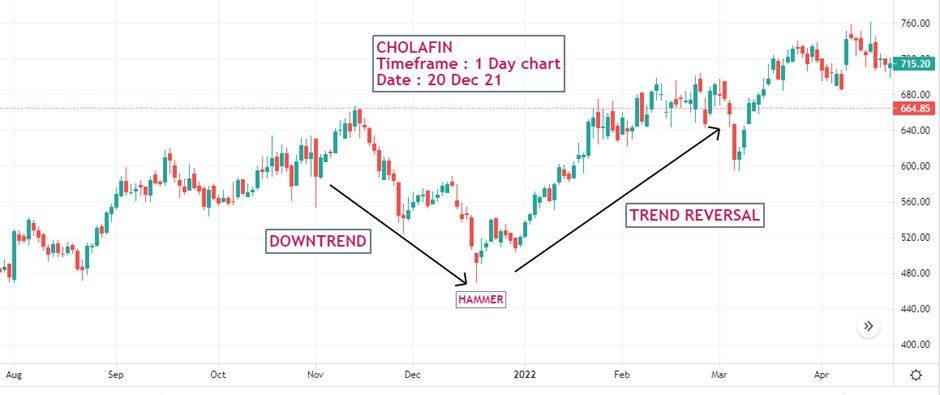
2) CHOLAFIN - Stock
•Here we can see the clear downtrend,
•Then formation of hammer candle,
•Next candle gives confirmation and the trend reverse. (10/13)
•Here we can see the clear downtrend,
•Then formation of hammer candle,
•Next candle gives confirmation and the trend reverse. (10/13)
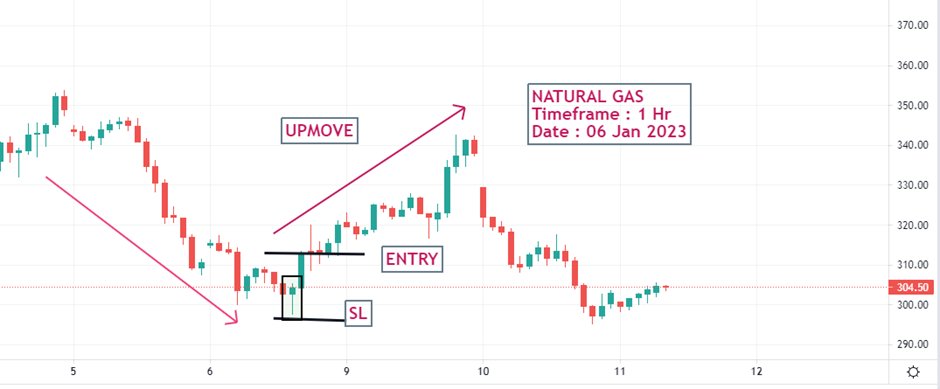
3) NATURAL GAS - Commodity
•Here we can see the clear downtrend,
•Then formation of hammer candle,
•Next candle gives confirmation and the trend reverse. (11/13)
•Here we can see the clear downtrend,
•Then formation of hammer candle,
•Next candle gives confirmation and the trend reverse. (11/13)
•Target/ Exit point –
✔I always follow next resistance level as my target.
✔Always mark strong resistance areas in your chart and use them as a target for a perfect exit. (12/13)
✔I always follow next resistance level as my target.
✔Always mark strong resistance areas in your chart and use them as a target for a perfect exit. (12/13)
♥If you found this thread useful, please RT the first tweet.🔁 (13/13)
A thread: To learn BULLISH ENGULFING candlestick pattern. 👇
https://twitter.com/itsprekshaBaid/status/1611971054347644929?t=8zmv-FB4tQkuul4WgGCdjw&s=19
• • •
Missing some Tweet in this thread? You can try to
force a refresh