Ismael Ghalimi Profile picture
Jan 13 4 tweets 3 min read
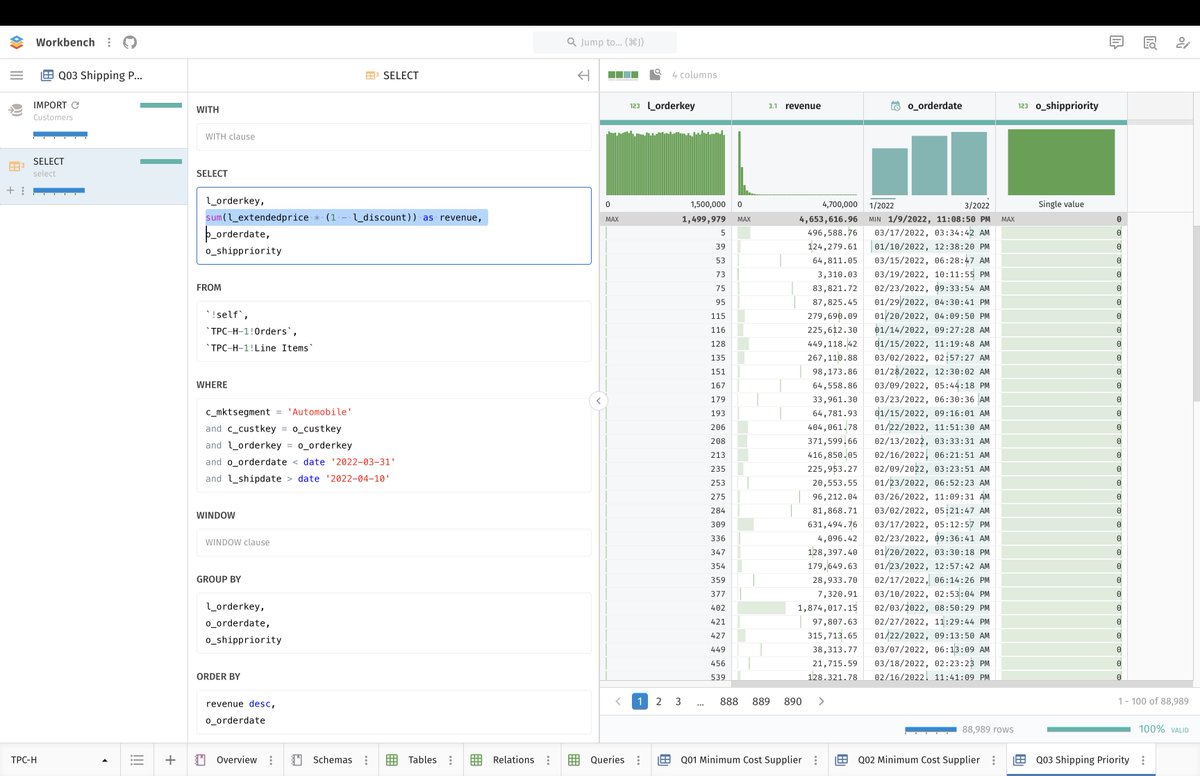
Question for SQL experts: #STOIC has a much richer typing system than @duckdb. Therefore, when we create a column like "revenue", we want to type it (Number) and give it a full name (Total Revenue). What would be the best way to add that information directly in the SQL code? Image
To be clear, we need a solution that would be compatible with @duckdb's SQL parser and would be as idiomatic as possible. Otherwise, we'll have to invent our own syntax and do some pre-processing. That's always an option, but I'd like to avoid it if possible.
And for the record, here is the full list of our datatypes:

github.com/stoic-doc/Comm…
A simple approach could be to use inline comments. The first value would be the column's full name, and the second one would be its datatype. ImageImageImage

• • •

Missing some Tweet in this thread? You can try to force a refresh
 

Keep Current with Ismael Ghalimi

Ismael Ghalimi Profile picture

Stay in touch and get notified when new unrolls are available from this author!

Read all threads

This Thread may be Removed Anytime!

PDF

Twitter may remove this content at anytime! Save it as PDF for later use!

Try unrolling a thread yourself!

how to unroll video
  1. Follow @ThreadReaderApp to mention us!

  2. From a Twitter thread mention us with a keyword "unroll"
@threadreaderapp unroll

Practice here first or read more on our help page!

More from @ghalimi

Jan 15
Yesterday, I described a version of our upcoming SQL query designer that focused on making it easier to compose SQL queries, while preserving SQL's hierarchical structure. Today, I want to explore an alternative path.
Instead of taking a SQL-oriented approach, I want to take a task-oriented approach. And I want to free myself from SQL's hierarchical structure, while still producing a well-formed SQL query in the end.
The idea is similar to what Excel's pivot table is doing: give the user a relatively simple graphical user interface to pivot a table across multiple dimensions, and produce a query from it (be it a SQL or a DAX query).
Read 61 tweets
Jan 15
One of #STOIC's most useful features is its signature Summary Charts, which are these bar charts displayed at the top of every column in a table. They work really well, unless your table has very few rows. Here is how we'll improve them for some interesting corner cases. Image
Relative Baseline in Bar Plots

When a table has less than 50 rows, we replace the Histogram displayed for a numerical column with a Bar Plot visualizing discrete values, but we keep 0 as baseline. We should use MIN or MAX instead, as we do for cell summaries below. Image
Bar Plot with All Equal Values

When a Bar Plot is produced for a set of values that are all equal, we would want to know that at a glance. To do so, the length of bars will be reduced by 50%, while keeping the plot horizontally centered. Image
Read 18 tweets
Jan 15
Things that I love about @berkeleygfx's design philosophy:

Emergent over prescribed aesthetics.
Expose state and inner workings.
Dense, not sparse.
Performance is design.
Beauty emerges automatically without deliberation.
Do not infantilize users.
"Emergent over prescribed aesthetics."

Our core UI design was totally emergent. We did not follow any trends. We just tried to render as much qualitative and quantitative information as possible, in a well-organized fashion. Aesthetics were a mere by-product. Image
"Expose state and inner workings."

That's exactly what we do when we expose the "Runtime Boundary" on the left panel: Lambda functions upstream, EC2 monostore downstream. Image
Read 7 tweets
Jan 15
One of the main factors that is holding back the design of good data tools for less technical users is our lack of trust in their ability to understand complex mathematical concepts like logarithmic scales or percentiles.
While it is true that the vast majority of such users are not yet familiar or comfortable with these concepts today, they could learn about them over time, and we need to design user interfaces that can facilitate this learning.
This is why I am such a strong proponent of what I call progressive user interfaces. These are user interfaces that use advanced concepts surreptitiously. These concepts are there right in front of the user, yet might not be noticed at first, and don't get in the way.
Read 5 tweets
Jan 14
This thread introduced our upcoming SQL query designer and its two modes: graphical and textual. This other thread will cover the graphical mode in more detail, reviewing each clause of SQL's SELECT statement.
As a baseline, we will use this @duckdb documentation for SQL's SELECT:

duckdb.org/docs/sql/state…
This gives us the following clauses:

WITH
SELECT
FROM
USING
WHERE
GROUP BY
WINDOW
ORDER BY
LIMIT
Read 53 tweets
Jan 14
This thread introduced the SQL vs. Tabula discussion. This other thread will cover our SQL query designer. This tool will focus on @duckdb's SQL dialect, but it will be designed to work with virtually any SQL cloud database (@SnowflakeDB, @databricks, etc).
There are many ways to design a SQL query designer, and to design a good one, two critical questions must be answered first: who is the audience, and what is their working environment?
For #STOIC, we must serve two very different user groups:

1. Users who are new to SQL
2. Users who are SQL experts
Read 34 tweets

Did Thread Reader help you today?

Support us! We are indie developers!


This site is made by just two indie developers on a laptop doing marketing, support and development! Read more about the story.

Become a Premium Member ($3/month or $30/year) and get exclusive features!

Become Premium

Don't want to be a Premium member but still want to support us?

Make a small donation by buying us coffee ($5) or help with server cost ($10)

Donate via Paypal

Or Donate anonymously using crypto!

Ethereum

0xfe58350B80634f60Fa6Dc149a72b4DFbc17D341E copy

Bitcoin

3ATGMxNzCUFzxpMCHL5sWSt4DVtS8UqXpi copy

Thank you for your support!

Follow Us on Twitter!

:(