After all the talk about the catastrophic impact on the Eurozone from the energy crisis, and sky-high prices for energy imports, it is interesting that the Eurozone current account already bounced back into SURPLUS in the latest official data...
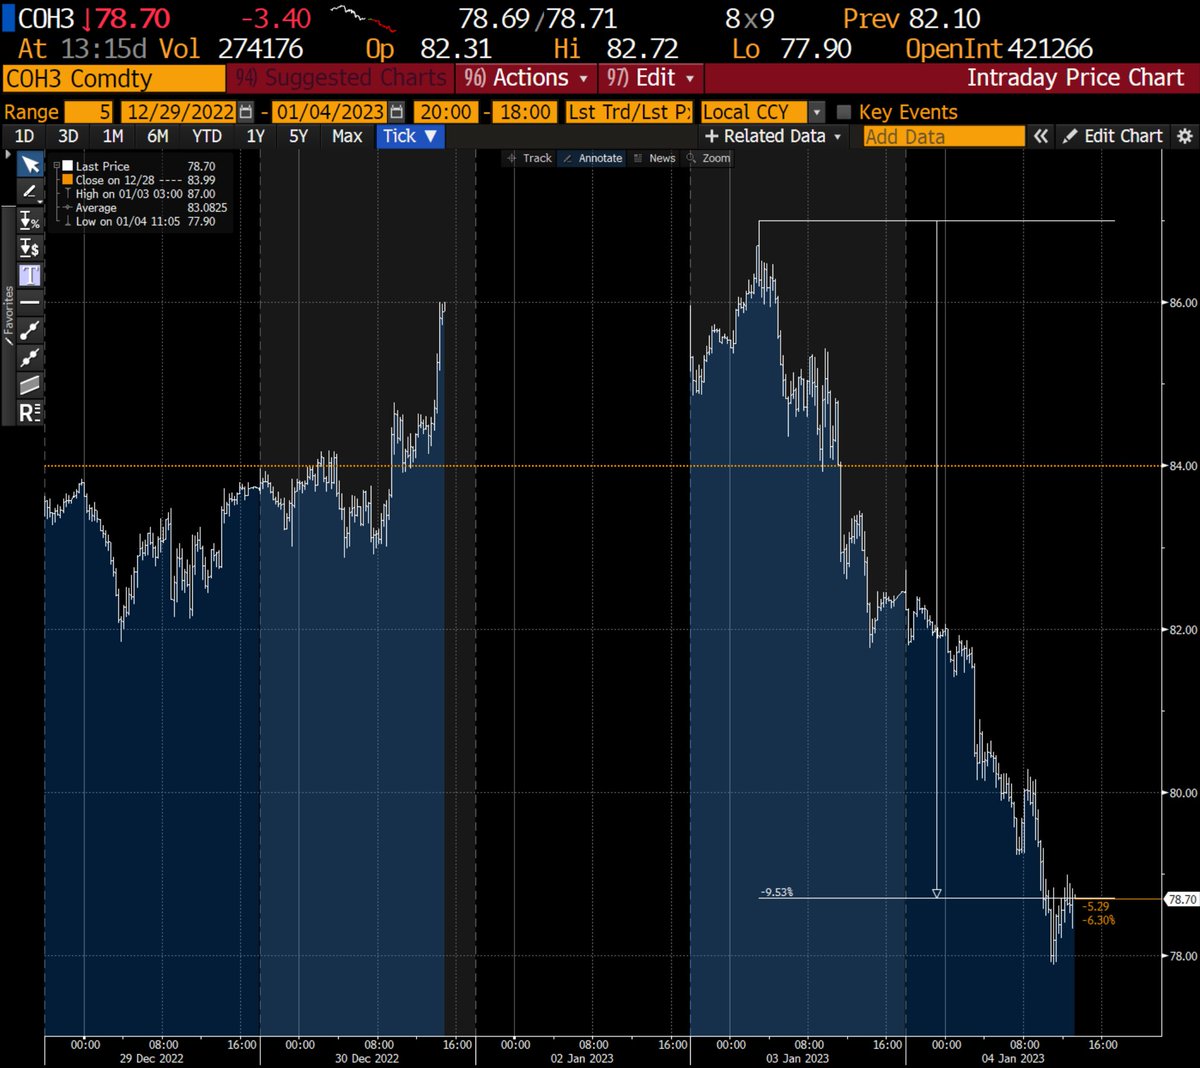
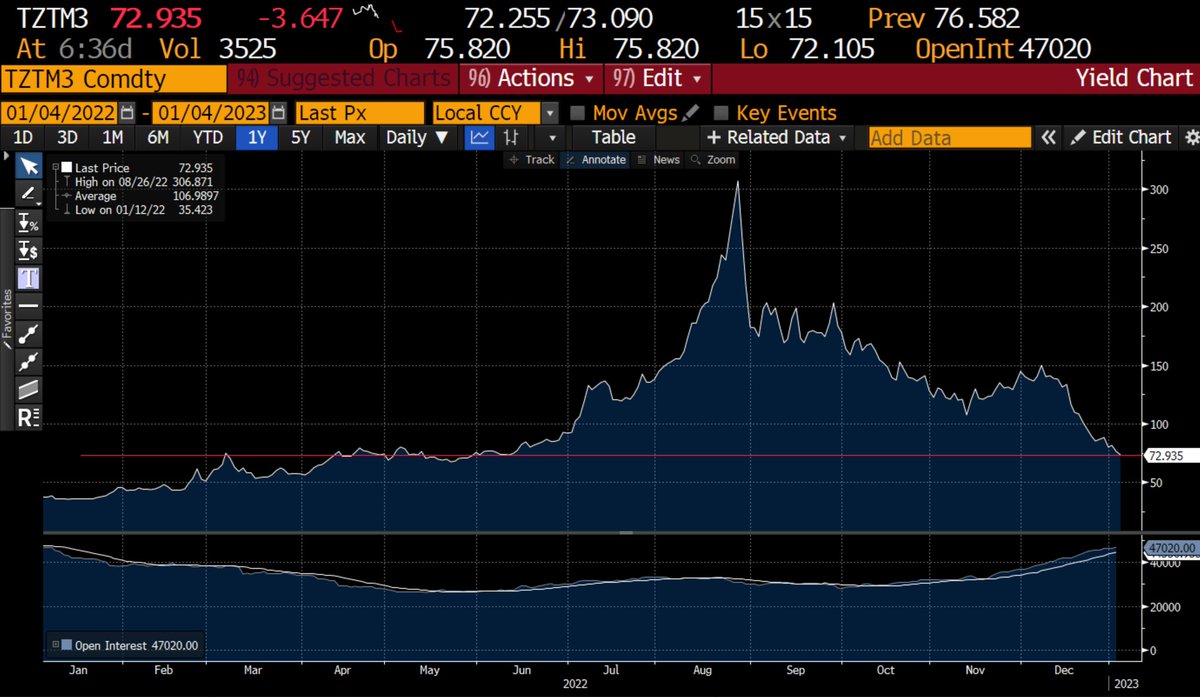
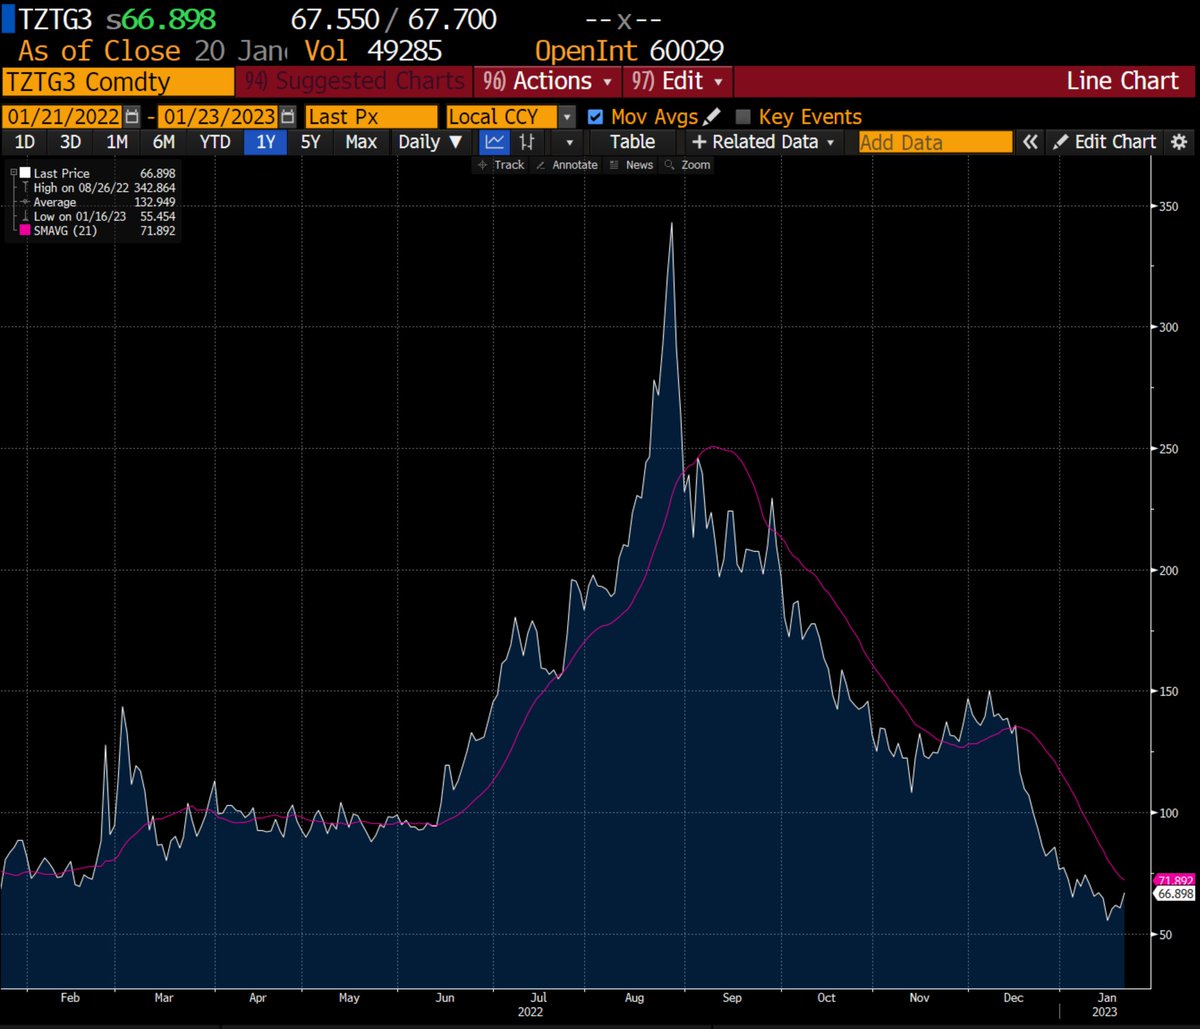
This is especially notable, since natural gas prices have fallen dramatically further into 2023.
Here I show monthly moving averages of spot NatGas, and the latest reading is down around 50% (!!!) from the November average (when the current account data was recorded)
The bottom line is:
The hit to the Eurozone balance of payments, which looked enormous (when Russia shut down the Nordstream pipeline flows over the summer) is now looking much more moderate.
The media narrative has not fully adjusted to the new reality that we can observe in market prices, and now also the official balance of payment data (even if that data is quite lagged)
END
• • •
Missing some Tweet in this thread? You can try to
force a refresh
Some observations on the role of Japan in global fixed income markets, specifically the role of changes to Yield Curve Control in December
IT IS COMPLEX (=THREAD)
First, when the BoJ shocked in December, and adjusted the ceiling for JGB yields up to 50bp,, there was a correlation into other curves.
Eurozone (yellow) and US Swaps (green) did move notably higher, and some of that was likely the BoJ shock.
But it did not stick into 2023...
Second, when we actually look at flows from Japanese investors (from a Japanese BoP perspective), there has ironically been more outflows in recent weeks (negative readings in the chart below)
As such, the YCC shock has not lead to 'repatriation' back into Japan since December
What is the same (this quote from our very first letter in 2016 still stands, as illustrated with the recent ChatGPT / OpenAI focus):
What is new is that the macro dimension of investment has become too important to ignore, for all, as it has been the key determinant of return differentiation;
Here is a thread about getting a US citizenship, @CindyCrawford & the future (impossible missions).
It started in 1994…and ended (so far) in late 2022...
I was visiting NYC for the first time in 1994. And I was looking at crazy expensive loft-apartments in a realtor window in SoHo.
And then suddenly, Cindy Crawford walked past me, just like that...
(this is not my photo, but one that captures a similar moment by @ArthurElgort )
I was thinking, we do not have apartments like that Aarhus, Denmark (where I lived as a student at the time), and we also do not have people like that working around.
It would be fun to say I fell in love with NYC in that moment, but it happened already initial trip from JFK...
Friday was a massive day for asset markets. The US data, especially the Services ISM release, generated 2-3 standard deviation moves in assets broadly, from fixed income to equities...
A thread with some observations on the data we saw...
The services ISM (which together with the manufacturing ISM is one of the most watched leading indicators), collapsed to below 50 (contraction), and the new orders sub-index moved as low as 45.20 (yellow line)
There are not many equally dramatic drops in the series' history. But these ones stand out:
Apr 2020 (COVID shock)
Jan 2008 (Bear Stearns, prelude to GFC)
Jan 2001 ("New Economy / DotCom" Recession)
First, temperatures in Europe are way above normal as we start 2023...
(look all the way to the left)
Second, NatGas inventories are RISING in the middle of winter (as consumption is low, due to weather and structural savings), and due to still good LNG supplies
Third, longer-dated Natural Gas futures pricing are now back to levels seen before the Nordstream shut-down. => They have reversed the entire mega-spike from Jun-Aug