The Jan 22-28 Canadian COVID Forecast and associated data are now live.
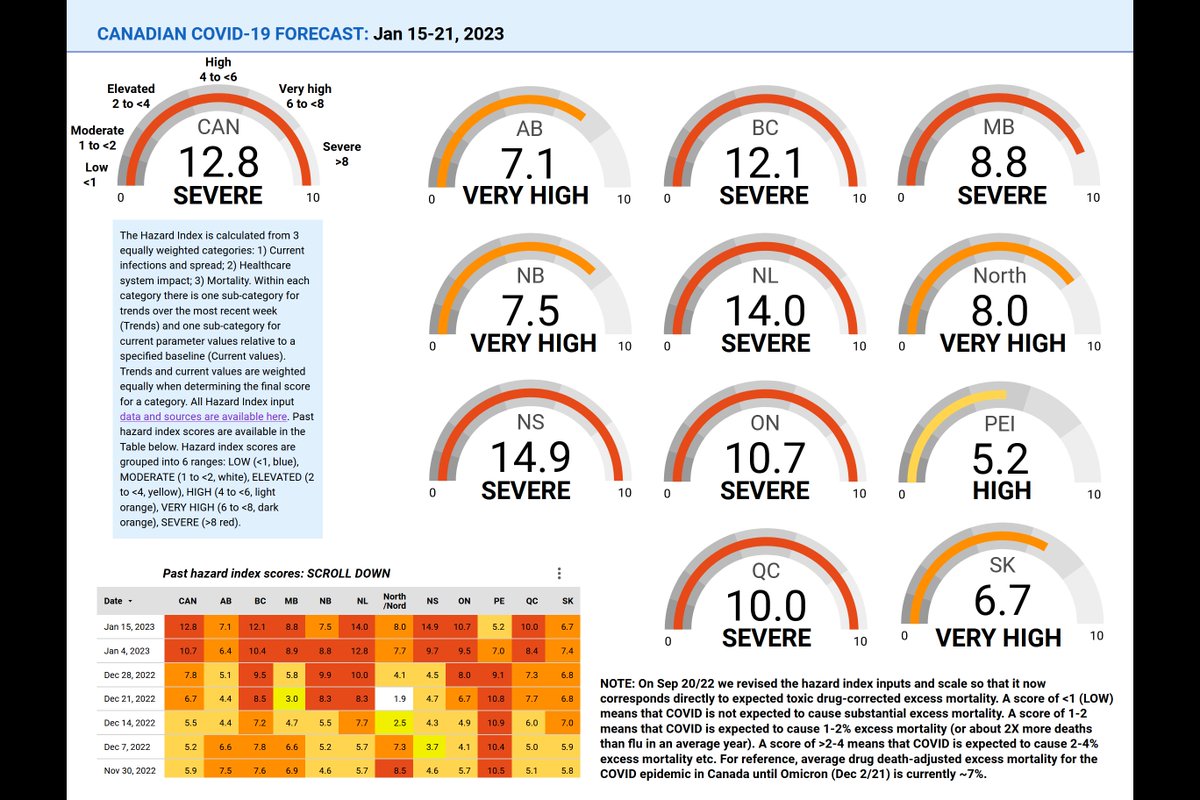
SEVERE: CAN, BC, MB, NL, NS, ON
VERY HIGH: AB, NB, North, PEI
HIGH: MB, QC, SK
All but PEI stable or decreasing
About 1 in 32 people in Canada are CURRENTLY infected.
Link: covid19resources.ca/covid-hazard-i
SEVERE: CAN, BC, MB, NL, NS, ON
VERY HIGH: AB, NB, North, PEI
HIGH: MB, QC, SK
All but PEI stable or decreasing
About 1 in 32 people in Canada are CURRENTLY infected.
Link: covid19resources.ca/covid-hazard-i

We're seeing a decline in severe outcomes in multiple provinces, with decline in waste water and estimated total infections in many.
It looks like we're coming out of the holiday wave/surge--the duration looks fairly similar to the surge we saw around Thanksgiving.
It looks like we're coming out of the holiday wave/surge--the duration looks fairly similar to the surge we saw around Thanksgiving.
But....as you can see from this image here, estimated actual infections are continuing to increase for multiple provinces (CAN, BC, NL, NS, ON, North)--not fast (except for North), but steadily.
If/when we see hospitalizations pick up we'll likely be in the XBB.1.5 surge/wave.
If/when we see hospitalizations pick up we'll likely be in the XBB.1.5 surge/wave.

With Ontario XBB.1.5 currently (actually last week) at ~30% of sequenced samples, I'd guess we'll see Ontario severe outcomes start to take off in the coming week.
We also only have waste water data for many regions up to about Jan 14 (older than that for quite a few). We'll be watching the next week or two of data closely.
Something I think it's really important for people to consider wrt the XBB.1.5 in eastern U.S. states is that surges in hospitalizations are likely not just due to surges in infections, but also the low uptake of boosters even among those at higher risk of severe outcomes.
Protection against severe outcomes does slowly decline over time. If you haven't had a new shot in the last 6 months, you really, really, really need to update your vaccines. This is STRONGLY recommended in the most recent NACI guidance.
Get your next shot, PLEASE.
Get your next shot, PLEASE.
On to the individual provincial forecasts.
Here's the link where you can download png and jpeg files for these graphics if you want: drive.google.com/drive/u/1/fold…
No, they're not up on our website yet. We're slow.
Here's the link where you can download png and jpeg files for these graphics if you want: drive.google.com/drive/u/1/fold…
No, they're not up on our website yet. We're slow.
FYI--there are a few provinces where we'd be dropping recommendations down a notch so that people who are not higher risk are no longer advised to avoid non-essential indoor settings.
But, given that we're likely transitioning into an XBB.1.5 wave, and that most Canadian data is at least 1 week behind, we're keeping recommendations at the level specific to VERY HIGH and SEVERE index levels.
Canadian COVID Forecast Jan 22-28, 2023
CANADA
SEVERE
About 1 in every 32 people is infected.
HOW TO HELP:
Mask, get your booster, avoid non-essential indoor public places, social gatherings.
Higher risk: also avoid outdoor social gatherings.
CANADA
SEVERE
About 1 in every 32 people is infected.
HOW TO HELP:
Mask, get your booster, avoid non-essential indoor public places, social gatherings.
Higher risk: also avoid outdoor social gatherings.

Canadian COVID Forecast Jan 22-28, 2023
CANADA
SEVERE
About 1 in every 32 people infected
Compared to lowest point of pandemic in Canada:
🟡Waste water, infections, long COVID cases ~11X higher
🟡Hospitalizations ~7X higher
🟡Deaths ~7X higher
CANADA
SEVERE
About 1 in every 32 people infected
Compared to lowest point of pandemic in Canada:
🟡Waste water, infections, long COVID cases ~11X higher
🟡Hospitalizations ~7X higher
🟡Deaths ~7X higher

About 1 in 32 people in Canada this week are infected/infectious.
If you're higher risk, this is a good week to use curbside or home delivery, or ask others to help.
If you are NOT higher risk, this is a good week to ask neighbours, family, friends if you can help out.
If you're higher risk, this is a good week to use curbside or home delivery, or ask others to help.
If you are NOT higher risk, this is a good week to ask neighbours, family, friends if you can help out.

Canadian COVID Forecast Jan 22-28, 2023
NEWFOUNDLAND AND LABRADOR
SEVERE
About 1 in every 35 people is infected.
HOW TO HELP:
Mask, get your booster, avoid non-essential indoor public places, social gatherings.
Higher risk: also avoid outdoor social gatherings.
NEWFOUNDLAND AND LABRADOR
SEVERE
About 1 in every 35 people is infected.
HOW TO HELP:
Mask, get your booster, avoid non-essential indoor public places, social gatherings.
Higher risk: also avoid outdoor social gatherings.

Canadian COVID Forecast Jan 22-28, 2023
NEWFOUNDLAND AND LABRADOR
SEVERE
About 1 in every 35 people infected
Compared to lowest point of pandemic in Canada:
🟡Waste water, infections, long COVID cases ~12X higher
🟡Hospitalizations ~12X higher
🟡Deaths ~5X higher
NEWFOUNDLAND AND LABRADOR
SEVERE
About 1 in every 35 people infected
Compared to lowest point of pandemic in Canada:
🟡Waste water, infections, long COVID cases ~12X higher
🟡Hospitalizations ~12X higher
🟡Deaths ~5X higher

Canadian COVID Forecast Jan 22-28, 2023
PRINCE EDWARD ISLAND
VERY HIGH
About 1 in every 57 people is infected.
HOW TO HELP:
Mask, get your booster, avoid non-essential indoor public places, social gatherings.
Higher risk: also avoid outdoor social gatherings.
PRINCE EDWARD ISLAND
VERY HIGH
About 1 in every 57 people is infected.
HOW TO HELP:
Mask, get your booster, avoid non-essential indoor public places, social gatherings.
Higher risk: also avoid outdoor social gatherings.

Canadian COVID Forecast Jan 22-28, 2023
PRINCE EDWARD ISLAND
VERY HIGH
About 1 in every 57 people infected
Compared to lowest point of pandemic in Canada:
🟡Waste water, infections, long COVID cases ~12X higher
🟡Hospitalizations ~6X higher
🟡Deaths ~6X higher
PRINCE EDWARD ISLAND
VERY HIGH
About 1 in every 57 people infected
Compared to lowest point of pandemic in Canada:
🟡Waste water, infections, long COVID cases ~12X higher
🟡Hospitalizations ~6X higher
🟡Deaths ~6X higher

Canadian COVID Forecast Jan 22-28, 2023
NOVA SCOTIA
SEVERE
About 1 in every 35 people is infected.
HOW TO HELP:
Mask, get your booster, avoid non-essential indoor public places, social gatherings.
Higher risk: also avoid outdoor social gatherings.
NOVA SCOTIA
SEVERE
About 1 in every 35 people is infected.
HOW TO HELP:
Mask, get your booster, avoid non-essential indoor public places, social gatherings.
Higher risk: also avoid outdoor social gatherings.

Canadian COVID Forecast Jan 22-28, 2023
NOVA SCOTIA
SEVERE
About 1 in every 35 people infected
Compared to lowest point of pandemic in Canada:
🟡Waste water, infections, long COVID cases ~14X higher
🟡Hospitalizations ~9X higher
🟡Deaths ~14X higher
NOVA SCOTIA
SEVERE
About 1 in every 35 people infected
Compared to lowest point of pandemic in Canada:
🟡Waste water, infections, long COVID cases ~14X higher
🟡Hospitalizations ~9X higher
🟡Deaths ~14X higher

Canadian COVID Forecast Jan 22-28, 2023
NEW BRUNSWICK
VERY HIGH
About 1 in every 53 people is infected.
HOW TO HELP:
Mask, get your booster, avoid non-essential indoor public places, social gatherings.
Higher risk: also avoid outdoor social gatherings.
NEW BRUNSWICK
VERY HIGH
About 1 in every 53 people is infected.
HOW TO HELP:
Mask, get your booster, avoid non-essential indoor public places, social gatherings.
Higher risk: also avoid outdoor social gatherings.

Canadian COVID Forecast Jan 22-28, 2023
NEW BRUNSWICK
VERY HIGH
About 1 in every 53 people infected
Compared to lowest point of pandemic in Canada:
🟡Waste water, infections, long COVID cases ~11X higher
🟡Hospitalizations ~4X higher
🟡Deaths ~5X higher
NEW BRUNSWICK
VERY HIGH
About 1 in every 53 people infected
Compared to lowest point of pandemic in Canada:
🟡Waste water, infections, long COVID cases ~11X higher
🟡Hospitalizations ~4X higher
🟡Deaths ~5X higher

Canadian COVID Forecast Jan 22-28, 2023
QUEBEC
HIGH
About 1 in every 36 people is infected.
HOW TO HELP:
Mask, get your booster, avoid non-essential indoor public places, social gatherings.
Higher risk: also avoid outdoor social gatherings.
QUEBEC
HIGH
About 1 in every 36 people is infected.
HOW TO HELP:
Mask, get your booster, avoid non-essential indoor public places, social gatherings.
Higher risk: also avoid outdoor social gatherings.

Canadian COVID Forecast Jan 22-28, 2023
QUEBEC
HIGH
About 1 in every 36 people infected
Compared to lowest point of pandemic in Canada:
🟡Waste water, infections, long COVID cases ~8X higher
🟡Hospitalizations ~5X higher
🟡Deaths ~3X higher
QUEBEC
HIGH
About 1 in every 36 people infected
Compared to lowest point of pandemic in Canada:
🟡Waste water, infections, long COVID cases ~8X higher
🟡Hospitalizations ~5X higher
🟡Deaths ~3X higher

FYI--for those wondering why QC hasn't hit same maxima as rest of country since start of fall...
Two possible explanations:
1) QC has significantly higher fresh dose uptake among people 40+ than most provinces (except BC)
2) QC had a large summer wave w/ substantial mortality.
Two possible explanations:
1) QC has significantly higher fresh dose uptake among people 40+ than most provinces (except BC)
2) QC had a large summer wave w/ substantial mortality.
Higher fresh vax dose uptake among those at risk of severe outcomes plus lots of infections in last 6 months may be blunting/shortening waves in QC--at least for now.
Canadian COVID Forecast Jan 22-28, 2023
ONTARIO
SEVERE
About 1 in every 31 people is infected.
HOW TO HELP:
Mask, get your booster, avoid non-essential indoor public places, social gatherings.
Higher risk: also avoid outdoor social gatherings.
ONTARIO
SEVERE
About 1 in every 31 people is infected.
HOW TO HELP:
Mask, get your booster, avoid non-essential indoor public places, social gatherings.
Higher risk: also avoid outdoor social gatherings.

Canadian COVID Forecast Jan 22-28, 2023
ONTARIO
SEVERE
About 1 in every 31 people infected
Compared to lowest point of pandemic in Canada:
🟡Waste water, infections, long COVID cases ~14X higher
🟡Hospitalizations ~9X higher
🟡Deaths ~9X higher
ONTARIO
SEVERE
About 1 in every 31 people infected
Compared to lowest point of pandemic in Canada:
🟡Waste water, infections, long COVID cases ~14X higher
🟡Hospitalizations ~9X higher
🟡Deaths ~9X higher

One persistent trend we've noticed since the summer is that provinces that had lower seroprevalence by end of summer are experiencing bigger/longer surges than provinces where more the population has been infected at least once.
It's not a huge difference, and by now almost all provinces have/are close to having about the same % of population infected at least once. But for those that are slightly lower, surges seem to be more intense and longer.
This makes sense--there's less tinder to light the fire.
This makes sense--there's less tinder to light the fire.
What is not clear is how long that blunting effect will last. It's always good to follow QC data, since it's generally reported fast and accurately (although even QC has started modifying reporting of hospitalizations).
And it's always possible the apparent blunting effect reflects changes in reporting, although I'm more inclined to think this is blunting.
Certainly it's no surprise that Atlantic provinces, ON and BC have been having the worst time through the fall until now, since seroprevalence in these provinces is lower than QC AND they have lower rates of booster uptake than QC (except BC).
Anyway....back to the thread :)
Canadian COVID Forecast Jan 22-28, 2023
MANITOBA
HIGH
About 1 in every 77 people is infected.
HOW TO HELP:
Mask, get your booster, avoid non-essential indoor public places, social gatherings.
Higher risk: also avoid outdoor social gatherings.
MANITOBA
HIGH
About 1 in every 77 people is infected.
HOW TO HELP:
Mask, get your booster, avoid non-essential indoor public places, social gatherings.
Higher risk: also avoid outdoor social gatherings.

Canadian COVID Forecast Jan 22-28, 2023
MANITOBA
HIGH
About 1 in every 77 people infected
Compared to lowest point of pandemic in Canada:
🟡Waste water, infections, long COVID cases ~8X higher
🟡Hospitalizations ~3X higher
🟡Deaths ~4X higher
MANITOBA
HIGH
About 1 in every 77 people infected
Compared to lowest point of pandemic in Canada:
🟡Waste water, infections, long COVID cases ~8X higher
🟡Hospitalizations ~3X higher
🟡Deaths ~4X higher

Canadian COVID Forecast Jan 22-28, 2023
SASKATCHEWAN
HIGH
About 1 in every 65 people is infected.
HOW TO HELP:
Mask, get your booster, avoid non-essential indoor public places, social gatherings.
Higher risk: also avoid outdoor social gatherings.
SASKATCHEWAN
HIGH
About 1 in every 65 people is infected.
HOW TO HELP:
Mask, get your booster, avoid non-essential indoor public places, social gatherings.
Higher risk: also avoid outdoor social gatherings.

Canadian COVID Forecast Jan 22-28, 2023
SASKATCHEWAN
HIGH
About 1 in every 65 people infected
Compared to lowest point of pandemic in Canada:
🟡Waste water, infections, long COVID cases ~7X higher
🟡Hospitalizations ~7X higher
🟡Deaths ~2X higher
SASKATCHEWAN
HIGH
About 1 in every 65 people infected
Compared to lowest point of pandemic in Canada:
🟡Waste water, infections, long COVID cases ~7X higher
🟡Hospitalizations ~7X higher
🟡Deaths ~2X higher

Canadian COVID Forecast Jan 22-28, 2023
ALBERTA
VERY HIGH
About 1 in every 48 people is infected.
HOW TO HELP:
Mask, get your booster, avoid non-essential indoor public places, social gatherings.
Higher risk: also avoid outdoor social gatherings.
ALBERTA
VERY HIGH
About 1 in every 48 people is infected.
HOW TO HELP:
Mask, get your booster, avoid non-essential indoor public places, social gatherings.
Higher risk: also avoid outdoor social gatherings.

Canadian COVID Forecast Jan 22-28, 2023
ALBERTA
VERY HIGH
About 1 in every 48 people infected
Compared to lowest point of pandemic in Canada:
🟡Waste water, infections, long COVID cases ~11X higher
🟡Hospitalizations ~6X higher
🟡Deaths ~2X higher
ALBERTA
VERY HIGH
About 1 in every 48 people infected
Compared to lowest point of pandemic in Canada:
🟡Waste water, infections, long COVID cases ~11X higher
🟡Hospitalizations ~6X higher
🟡Deaths ~2X higher

Canadian COVID Forecast Jan 22-28, 2023
BRITISH COLUMBIA
SEVERE
About 1 in every 31 people is infected.
HOW TO HELP:
Mask, get your booster, avoid non-essential indoor public places, social gatherings.
Higher risk: also avoid outdoor social gatherings.
BRITISH COLUMBIA
SEVERE
About 1 in every 31 people is infected.
HOW TO HELP:
Mask, get your booster, avoid non-essential indoor public places, social gatherings.
Higher risk: also avoid outdoor social gatherings.

Canadian COVID Forecast Jan 22-28, 2023
BRITISH COLUMBIA
VERY HIGH
About 1 in every 31 people infected
Compared to lowest point of pandemic in Canada:
🟡Waste water, infections, long COVID cases ~8X higher
🟡Hospitalizations ~8X higher
🟡Deaths ~15X higher
BRITISH COLUMBIA
VERY HIGH
About 1 in every 31 people infected
Compared to lowest point of pandemic in Canada:
🟡Waste water, infections, long COVID cases ~8X higher
🟡Hospitalizations ~8X higher
🟡Deaths ~15X higher

Canadian COVID Forecast Jan 22-28, 2023
NUNAVUT, NORTHWEST TERRITORIES, YUKON
VERY HIGH
About 1 in every 38 people is infected.
HOW TO HELP:
Mask, get your booster, avoid non-essential indoor public places, social gatherings.
Higher risk: also avoid outdoor social gatherings
NUNAVUT, NORTHWEST TERRITORIES, YUKON
VERY HIGH
About 1 in every 38 people is infected.
HOW TO HELP:
Mask, get your booster, avoid non-essential indoor public places, social gatherings.
Higher risk: also avoid outdoor social gatherings

Canadian COVID Forecast Jan 22-28, 2023
NUNAVUT, NWT, YUKON
VERY HIGH
About 1 in every 38 people infected
Compared to lowest point of pandemic in Canada:
🟡Waste water, infections, long COVID cases ~11X higher
🟡Hospitalizations ~5X higher
🟡Deaths ~6X higher
NUNAVUT, NWT, YUKON
VERY HIGH
About 1 in every 38 people infected
Compared to lowest point of pandemic in Canada:
🟡Waste water, infections, long COVID cases ~11X higher
🟡Hospitalizations ~5X higher
🟡Deaths ~6X higher

I'm going to take a break, but will be back soon to do a series of polls to find out how well people following this thread understand who is at higher risk of severe outcomes from COVID, according to information posted on the official pages of PHAC and provinces.
Feel free to start listing the categories you know are associated with higher risk in the replies until I get back.
And yes, you can cheat by going to PHAC and provincial public health pages to look this up.
Ready, set, GO!
And yes, you can cheat by going to PHAC and provincial public health pages to look this up.
Ready, set, GO!
Let the polling begin!
Test your knowledge of who is at higher risk of severe COVID outcomes and should take extra precautions to avoid infection, according to @GovCanHealth.
Test your knowledge of who is at higher risk of severe COVID outcomes and should take extra precautions to avoid infection, according to @GovCanHealth.
Are you at higher risk of more severe COVID outcomes
IF YOU ARE OLDER THAN 60?
IF YOU ARE OLDER THAN 60?
Answers will be posted in 7 days.
Or you can look them up at the link here: canada.ca/en/public-heal…
Or you can look them up at the link here: canada.ca/en/public-heal…
Are you at higher risk of more severe COVID outcomes
IF YOU ARE PREGNANT?
IF YOU ARE PREGNANT?
Are you at higher risk of more severe COVID outcomes
IF YOU HAVE DOWN SYNDROME?
IF YOU HAVE DOWN SYNDROME?
Are you at higher risk of more severe COVID outcomes
IF YOU HAVE not RECEIVED A COVID VACCINE DOSE or BEEN INFECTED IN THE LAST 6 MONTHS?
IF YOU HAVE not RECEIVED A COVID VACCINE DOSE or BEEN INFECTED IN THE LAST 6 MONTHS?
Are you at higher risk of more severe COVID outcomes
IF YOU HAVE MODERATE TO SEVERE ASTHMA?
IF YOU HAVE MODERATE TO SEVERE ASTHMA?
Are you at higher risk of more severe COVID outcomes
IF YOU HAVE DEMENTIA?
IF YOU HAVE DEMENTIA?
Are you at higher risk of more severe COVID outcomes
IF YOU HAVE DIABETES?
IF YOU HAVE DIABETES?
Are you at higher risk of more severe COVID outcomes
IF YOU HAVE HEART DISEASE?
IF YOU HAVE HEART DISEASE?
Are you at higher risk of more severe COVID outcomes
IF YOU HAVE HIGH BLOOD PRESSURE?
IF YOU HAVE HIGH BLOOD PRESSURE?
Are you at higher risk of more severe COVID outcomes
IF YOU HAVE KIDNEY DISEASE?
IF YOU HAVE KIDNEY DISEASE?
Are you at higher risk of more severe COVID outcomes
IF YOU HAVE LIVER DISEASE?
IF YOU HAVE LIVER DISEASE?
Are you at higher risk of more severe COVID outcomes
IF YOU HAVE LUNG DISEASE?
IF YOU HAVE LUNG DISEASE?
Are you at higher risk of more severe COVID outcomes
IF YOU HAVE/HAVE HAD STROKE?
IF YOU HAVE/HAVE HAD STROKE?
Are you at higher risk of more severe COVID outcomes
IF YOU ARE IMMUNOCOMPROMISED FROM AN UNDERLYING MEDICAL CONDITION SUCH AS CANCER?
IF YOU ARE IMMUNOCOMPROMISED FROM AN UNDERLYING MEDICAL CONDITION SUCH AS CANCER?
Are you at higher risk of more severe COVID outcomes
IF YOU TAKE MEDICATIONS THAT REDUCE THE IMMUNE RESPONSE, SUCH AS CHEMOTHERAPY
IF YOU TAKE MEDICATIONS THAT REDUCE THE IMMUNE RESPONSE, SUCH AS CHEMOTHERAPY
Are you at higher risk of more severe COVID outcomes
IF YOU HAVE HAD A SOLID ORGAN OR BLOOD STEM CELL TRANSPLANT?
IF YOU HAVE HAD A SOLID ORGAN OR BLOOD STEM CELL TRANSPLANT?
Are you at higher risk of more severe COVID outcomes
IF YOU HAVE HAD A SOLID ORGAN OR BLOOD STEM CELL TRANSPLANT?
IF YOU HAVE HAD A SOLID ORGAN OR BLOOD STEM CELL TRANSPLANT?
Are you at higher risk of more severe COVID outcomes
IF YOU LIVE WITH OBESITY (BMI>40)?
IF YOU LIVE WITH OBESITY (BMI>40)?
Moving on to other risk categories described on provincial websites. Why? Because the PHAC list is not exhaustive, and doesn't include all examples.
Data from provincial websites was compiled by the wonderful @emeraldclover5
Data from provincial websites was compiled by the wonderful @emeraldclover5
Are you at higher risk of more severe COVID outcomes
IF YOU ARE AN INFANT UNDER 1 YEAR OF AGE?
IF YOU ARE AN INFANT UNDER 1 YEAR OF AGE?
Are you at higher risk of more severe COVID outcomes
IF YOU ARE AN INFANT UNDER 1 YEAR OF AGE?
IF YOU ARE AN INFANT UNDER 1 YEAR OF AGE?
Are you at higher risk of more severe COVID outcomes
IF YOU HAVE AN INTELLECTUAL OR DEVELOPMENTAL DISABILITY?
IF YOU HAVE AN INTELLECTUAL OR DEVELOPMENTAL DISABILITY?
Are you at higher risk of more severe COVID outcomes
IF YOU HAVE A NEUROLOGICAL DISORDER?
IF YOU HAVE A NEUROLOGICAL DISORDER?
Are you at higher risk of more severe COVID outcomes
IF YOU HAVE SICKLE CELL DISEASE?
IF YOU HAVE SICKLE CELL DISEASE?
Are you at higher risk of more severe COVID outcomes
IF YOU SMOKE?
IF YOU SMOKE?
Are you at higher risk of more severe COVID outcomes
IF YOU USE INJECTION DRUGS?
IF YOU USE INJECTION DRUGS?
Are you at higher risk of more severe COVID outcomes
IF YOU HAVE PROBLEMATIC ALCOHOL USE?
IF YOU HAVE PROBLEMATIC ALCOHOL USE?
Are you at higher risk of more severe COVID outcomes
IF YOU HAVE SCHIZOPHRENIA OR A PSYCHOTIC DISORDER?
IF YOU HAVE SCHIZOPHRENIA OR A PSYCHOTIC DISORDER?
Are you at higher risk of more severe COVID outcomes
IF YOU HAVE UNTREATED HIV/AIDS?
IF YOU HAVE UNTREATED HIV/AIDS?
Are you at higher risk of more severe COVID outcomes
IF YOU HAVE A BLOOD DISEASE SUCH AS ANEMIA OR A CLOTTING DISORDER?
IF YOU HAVE A BLOOD DISEASE SUCH AS ANEMIA OR A CLOTTING DISORDER?
Are you at higher risk of more severe COVID outcomes
IF YOU HAVE CHRONIC OBSTRUCTIVE PULMONARY DISEASE (COPD)?
IF YOU HAVE CHRONIC OBSTRUCTIVE PULMONARY DISEASE (COPD)?
Are you at higher risk of more severe COVID outcomes
IF YOU LIVE IN AN ISOLATED OR REMOTE COMMUNITY?
IF YOU LIVE IN AN ISOLATED OR REMOTE COMMUNITY?
The answers to all of the above poll questions are YES.
What percentage of the Canadian population do you think falls into ONE OR MORE of these higher risk categories?
What percentage of the Canadian population do you think falls into ONE OR MORE of these higher risk categories?
• • •
Missing some Tweet in this thread? You can try to
force a refresh