An example of why I believe volume indicator of #MBMV2_0 is the most important indicator for understanding market participants behavior -

From last 3 days before 25th Jan, I was seeing an unusual pick up in volume which might not be very substantial in itself (1/n) #MBMV2_0
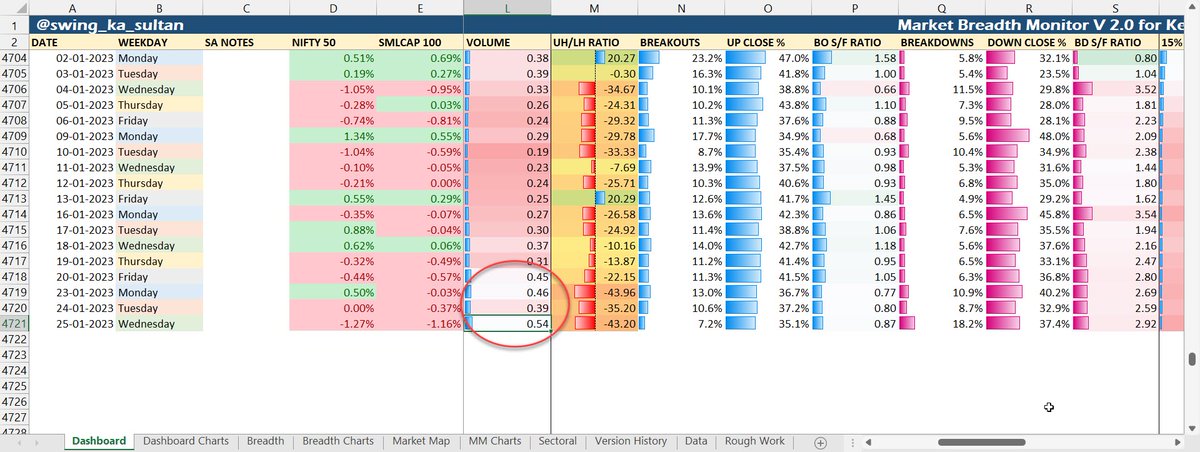
but was unusual - because the context wasn't supporting it. We usually see a pick-up in volume only when confidence in the market picks up, when stocks start moving up.

But this time the market was actually negative and had shown a pick-up in volume, that too before (2/n)
budget, showing a silent distribution from informed sellers. I expressed my concern to a close friend too.

All I want to show here is - I spent 3 months in fixing my data and creating this market breadth sheet because I didn't want to produce one another half-baked sheet (3/n)
which don't have enough backing on data etc. But this entire effort became worth because of this volume indicator - which is currently the most important indicator for me to understand market behavior. Close observation on day-to-day basis will give you a solid grip on it. (4/4)

• • •

Missing some Tweet in this thread? You can try to force a refresh
 

Keep Current with Chhirag Kedia

Chhirag Kedia Profile picture

Stay in touch and get notified when new unrolls are available from this author!

Read all threads

This Thread may be Removed Anytime!

PDF

Twitter may remove this content at anytime! Save it as PDF for later use!

Try unrolling a thread yourself!

how to unroll video
  1. Follow @ThreadReaderApp to mention us!

  2. From a Twitter thread mention us with a keyword "unroll"
@threadreaderapp unroll

Practice here first or read more on our help page!

More from @swing_ka_sultan

Dec 13, 2022
Neil, the IPOBase strategy you shared in your newsletter - which was shared by your friend - was popularized in India by my research which was published in March 2021. It is actually O'Neil's work, but had never been popularized here because no one ever did a #deepdive on it. (1)
But #IPOBase in not only about buying the high of the listing week. It is infact an extremely poor interpretation of the work.

A strategy is not only limited to a setup, what makes it effective is when you manage it according to its nature & potential. (2)
The entire fintwit community took the setup from my research - which was done on all IPOs listed since 2017 and parts of it was published on twitter - but didn't paid attention to the trade management rules which resulted into underperformance for them. (3)
Read 16 tweets
Dec 12, 2022
𝟮𝟮 𝗸𝗲𝘆𝘀 𝗳𝗼𝗿 𝘀𝘂𝗰𝗰𝗲𝘀𝘀𝗳𝘂𝗹 𝘁𝗿𝗮𝗱𝗶𝗻𝗴 (𝘧𝘳𝘰𝘮 𝘭𝘪𝘷𝘦 𝘭𝘦𝘤𝘵𝘶𝘳𝘦 - 𝘤𝘰𝘮𝘱𝘪𝘭𝘦𝘥 𝘣𝘺 𝘢 𝘴𝘵𝘶𝘥𝘦𝘯𝘵) -
1) Try to Simply your trading approach after a point of time. One more indicator / tool / strategy won’t make you a good trader. (2/n)
2) Become a 360-degree trader. Need to have strategies to cover all scenarios. (Learnt from @PradeepBonde) (3/n)
Read 24 tweets
Dec 1, 2022
As this is a question several people asked me, hence posting it as a thread.

I rarely follow any rule, I believe in my abilities to identify character. It makes me able to make decisions in confusing situations too.

#IPOBases are volatile in nature. What I saw before (1/n)
entering this stock was 3 days out of which on 18th Nov. gave a strong recovery and closed strongly. Next two days saw a volatility contraction in form of inside bars.

If a stock is not falling down, it is first sign of a probable recovery. Anything which is not going down (2/n)
shows its line of least resistance is not downwards, but have higher chance of it having upwards (which confirms through breakout).

Volatility is both - a trader's friend and the biggest foe. Foe when it is directionless, and friend when it expands in one direction and (3/n)
Read 5 tweets
Nov 21, 2022
Srikanth, market doesn't work in that way. What we are seeing on the name of 52 week high etc is just an effect, an indicator of demand.

Question is what generates demand? Think on it - why you buy a stock? You buy it because you believe stock will go up. Hence behind your (1/n)
action is your belief, your conviction which is the cause behind creating demand. Now think, where this conviction comes from?

For you, it might comes from technical aspects but for institutions, who makes these charts, the reason to buy or hold a stock is only value. (2/n)
If the stock offers value, whether in terms of price comparative to current assets (like P/BV or P/E) or future value (Growth).

As a technical analyst, you are reading the actions of these institutional players and indirectly acting on the value only.

So trend is (3/n)
Read 9 tweets
Nov 21, 2022
#SA_Notes for 21-11-2022

- Market is bear grip - both in long and short term.

- Volume still staying around 0.45, not suggesting any extreme. There is a high chance to see a continuation of the current situation for some more time.

- Bull swing is not yet around the (1/n)
corner. Don't be in hurry to label any green day a start of a bull swing. Whenever market will stretch in shorter term time frame, it will give a green day or a strong opening, only to be sold off later. Beware of bull traps.

Such actions further tighten the bear grip. (2/n)
- US had a gap up start on Friday only to be cool off later. It lacks FOMO and FOMO is the life blood of any uptrend. When a beaten down market first comes into bull run, it sustains the advances rather than giving it up.

- Preferable strategy to trade in this market is (3/n)
Read 4 tweets

Did Thread Reader help you today?

Support us! We are indie developers!


This site is made by just two indie developers on a laptop doing marketing, support and development! Read more about the story.

Become a Premium Member ($3/month or $30/year) and get exclusive features!

Become Premium

Don't want to be a Premium member but still want to support us?

Make a small donation by buying us coffee ($5) or help with server cost ($10)

Donate via Paypal

Or Donate anonymously using crypto!

Ethereum

0xfe58350B80634f60Fa6Dc149a72b4DFbc17D341E copy

Bitcoin

3ATGMxNzCUFzxpMCHL5sWSt4DVtS8UqXpi copy

Thank you for your support!

Follow Us on Twitter!

:(