Quite cold & snowy days over Italy! Three weeks ago we published our first assessment of 2023 Italian #snow water resources and we reported a significant deficit. How are things going after recent snowfalls?
A thread! 🧵👇
A thread! 🧵👇

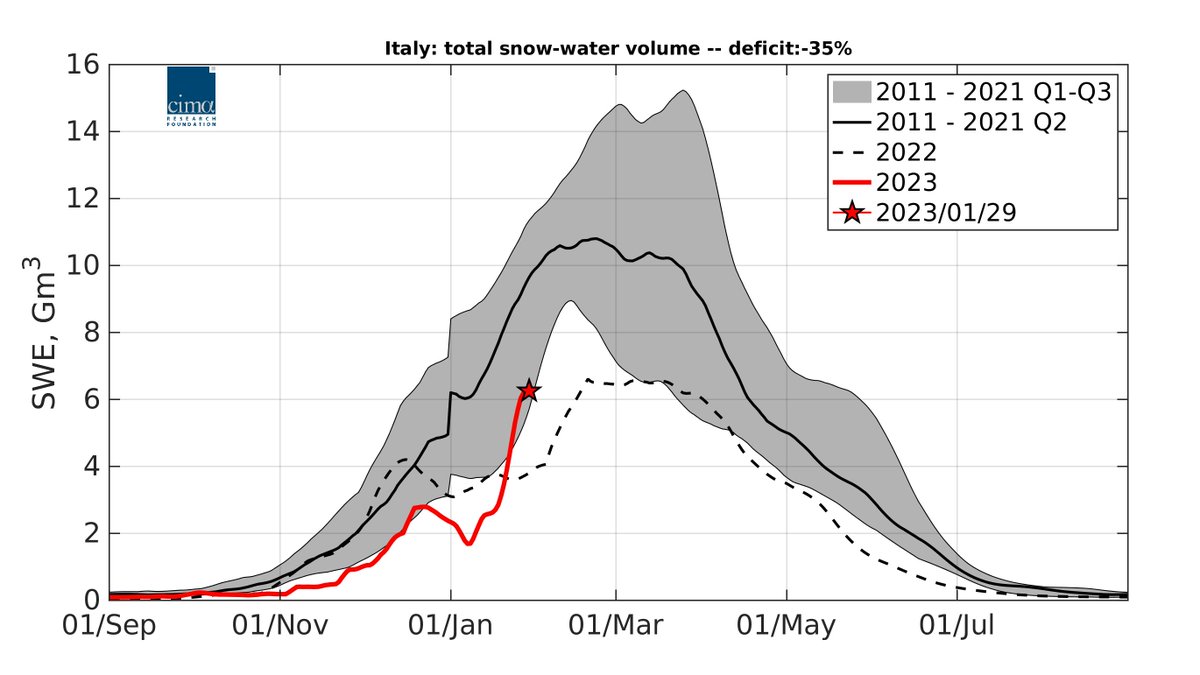
🔑 You’ll see many plots like this one👇
X axis is time, from autumn to summer.
Y axis is Snow Water Equivalent, i.e., how much water we have in snow (across all Italy in this case).
The black line is a median for 2011-2021, the red line is 2023, the dashed line is 2022.
X axis is time, from autumn to summer.
Y axis is Snow Water Equivalent, i.e., how much water we have in snow (across all Italy in this case).
The black line is a median for 2011-2021, the red line is 2023, the dashed line is 2022.

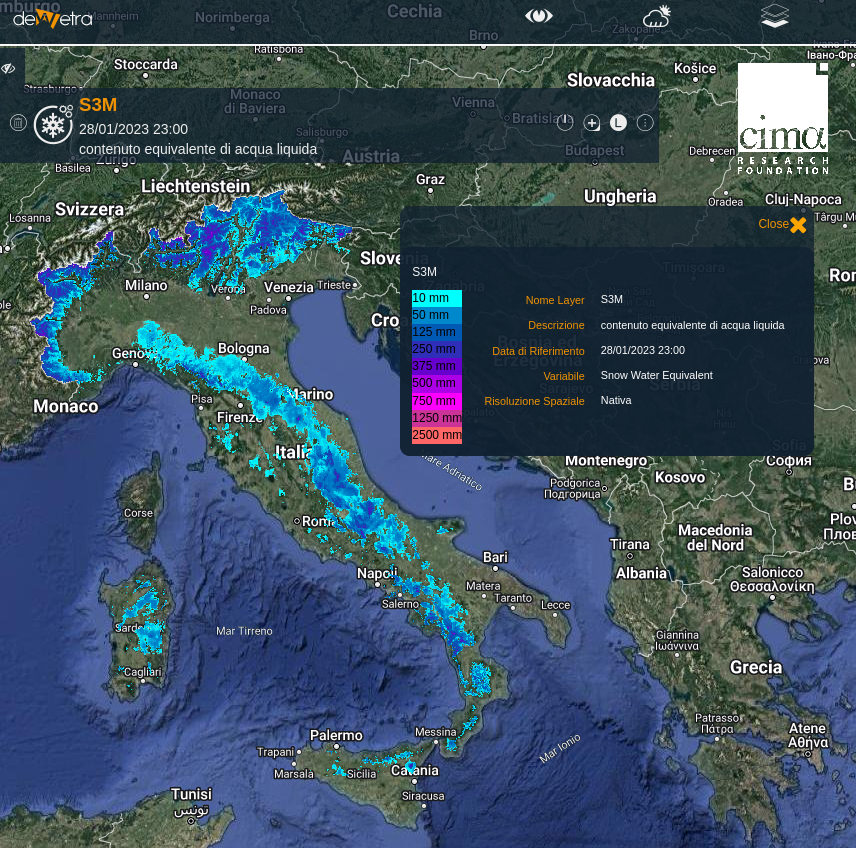
These data come from S3M Italy, a real-time operational tool we developed for the Italian @DPCgov to estimate snow water resources using models, satellite data and ground measurements. We simulated since 2010 & data are freely available here: bit.ly/3GZRVWD

So, how is snow doing in Italy? Better, but still not well despite recent snowfalls. We still estimate a deficit of -35% compared to the recent decade, with only +12% more snow than last year.
But... We all have seen new snow over the last few days! What’s going on then?
But... We all have seen new snow over the last few days! What’s going on then?
A snow season is a marathon rather than a 100 metres! This yr snow started accumulating later than usual (1st delay). After a good pace in Dec, it melted in early Jan (2nd delay). Pace has been fast since late Jan, but it will take an extra effort to fill these delays!

For example, we still have about half of snow in the Italian Alps compared to last decade... 👇👇👇

On the other hand, we are finally seeing more snow along the Apennines. In Abruzzo, we have +48% more snow than the recent decade for this day, with a jump over the last week. Remember: this area receives the bulk of snow in mid winter!

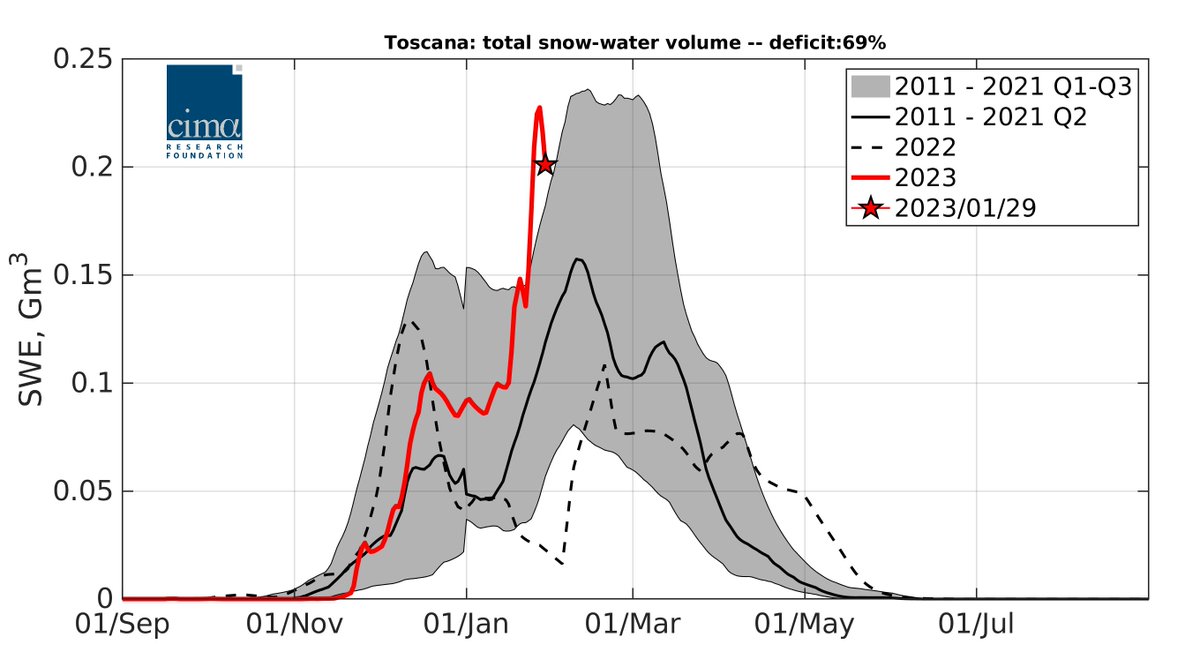
Who else is doing well at the moment? Tuscany for instance, which currently has more snow than most of the years in our record (+69%). ❄️ We estimate that Emilia Romagna has even 4 times more snow than the recent decade.
So, how can we be still in deficit despite these numbers?
Because the Alps host on average about 90% of Italian snow water resources, so the national deficit is driven by snow conditions in northern rather than central/southern Italy.
👉 bit.ly/3XRtv8E
Because the Alps host on average about 90% of Italian snow water resources, so the national deficit is driven by snow conditions in northern rather than central/southern Italy.
👉 bit.ly/3XRtv8E

In this regard, north-western Italy in particular is facing a severe deficit (-56% in Piemonte). This is the second year in a row that this area is experiencing a lack of snow, with current conditions being only slightly better than last year.

Here is a map of current snow deficit across our country. Do you see all that red in the Alps? Those are areas with less snow than what we have seen on average for today during 2011-21 period, which are driving our national deficit.

Why is this important? In a recent paper, we estimated that snow can be up to 60% or more of water flowing annually in Italian rivers (e.g. the Po). ⚠️ We are currently missing about 4 billion m3 of this water!
👉 Read more: bit.ly/3HmOOcC
👉 Read more: bit.ly/3HmOOcC

The marathon will last until mid-March/early April, when we usually have peak accumulation in Italy. We are halfway into the marathon, and cold conditions should persist for this deficit to be filled.
🔜 We will publish another report in mid February!
👉bit.ly/3jg1jxB
🔜 We will publish another report in mid February!
👉bit.ly/3jg1jxB
• • •
Missing some Tweet in this thread? You can try to
force a refresh