November/December both revised up, by combined 71k. That's separate from the benchmark revisions throughout 2022.
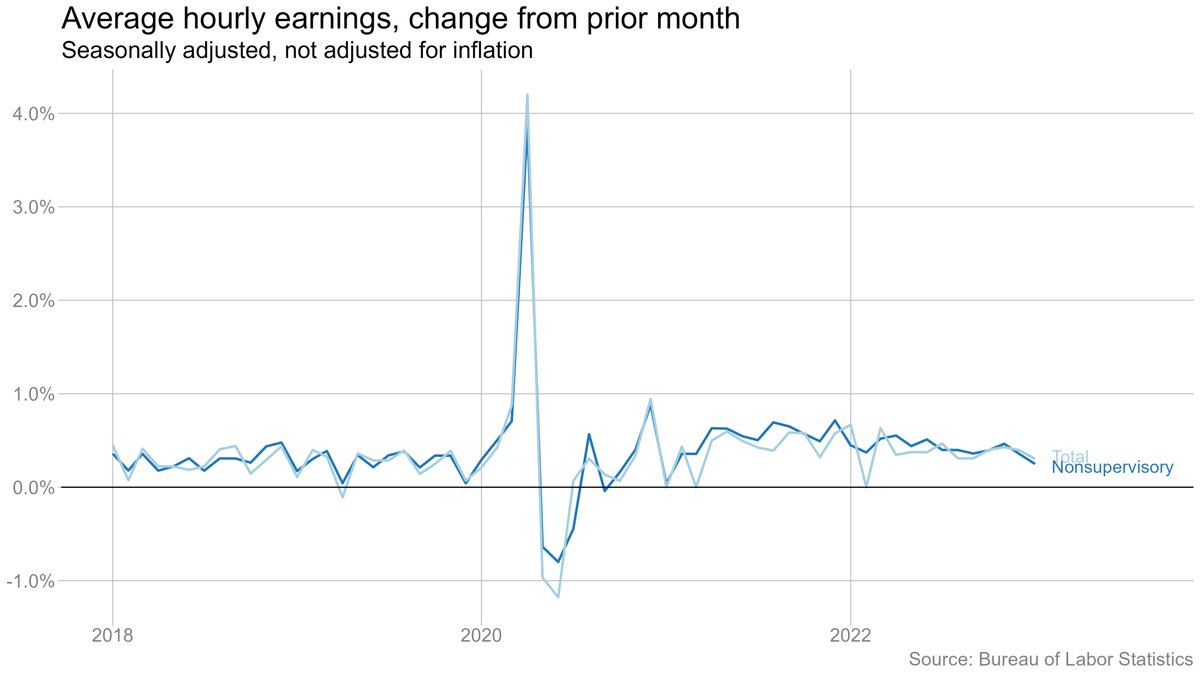
Average earnings up 10 cents/hour. Up 4.4% over the past year. Unlike everything else in the report, that's consistent with a continued gradual cooldown.
The story in the job market had been "gradual cooldown but surprising resilience." This report, taken on its own, paints a very different picture: all the resilience, none of the slowdown.
Still, even (or maybe especially) when we get big surprises like this, it's important to keep the bigger picture in mind. This has been an exceptionally strong rebound from the pandemic losses, but employment is still below where we'd have been had job growth continued unabated.
The benchmark revisions make the recovery look *even stronger* than it already did. Although note this does not incorporate QCEW data from last spring that suggests some weakness.
The unemployment rate fell to 3.4 percent in January. That's the lowest it's been since 1969.
Interesting to look at the benchmark revisions by sector. Large upward revisions to leisure, professional services and transportation/warehousing. Retail and government revised down.
Looking over the full pandemic period, leisure and hospitality are still down, but by roughly half previous estimate. Retail flips from small positive to small negative. Warehousing even stronger than believed.
Sort of a mixed picture on inflation in this report. On the one hand, hourly earnings continued to cool a bit on both a month-over-month and year-over-year basis (though the January slowdown is partly because December was revised up).
On the other hand, big gains in both jobs and hours worked means that total labor income jumped back up. That's what matters for aggregate spending.
Worth noting that there was a big gain in state and local government jobs because of University of California workers returning from a strike. (Although private sector gain of 443k is nothing to sneeze at!)
• • •
Missing some Tweet in this thread? You can try to
force a refresh
It's #jobsday! Except it isn't, because of the government shutdown. Which means that we're left sifting through alternative data sources to try to figure out what's going on in the labor market.
So, what are those sources telling us? A 🧵:
Start with job growth: Measures from ADP, Revelio, LinkedIn, etc., all tell subtly different stories, but they mostly agree on the big picture. After slowing dramatically over the summer, private-sector job growth has remained weak, but it hasn't necessarily slowed much further.
A few quick #JOLTS 📈:
Starting with: Job openings are way down from their peak, but they've fallen slowly if at all in recent months. No obvious sign that labor demand is falling off a cliff.
But it IS getting harder to find a job. There is now less than one job opening per unemployed worker. Not a low rate by historical standards, but definitely weaker than just before the pandemic (and way weaker than at the peak of the reopening boom).
The hiring rate (gross hiring, not the net job change we measure in the Friday jobs reports) has been below its long-run average for more than a year. It had seemed like it was leveling off, but might be falling again now, though hard to say definitively just yet.
President Trump didn't like the jobs numbers, so he fired the person responsible for producing them.
It's a move that has been tried before, by leaders of countries from Argentina to Greece to the Soviet Union. It rarely ends well.
(Link at end of thread)
Janet Yellen, not a person prone to hyperbole, put it this way: “This is the kind of thing you would only expect to see in a banana republic."
Key point from Andreas Georgiou, who was criminally prosecuted for insisting on reporting accurate deficit figures when he was head of Greece's statistical agency: Reliable data is essential for democracy.
CBO is out with its final cost estimate of the tax-and-spending bill passed by the House.
- Revenue ⬇️ by $3.7 trillion over 10 years
- Spending ⬇️ by $1.3 trillion
- Debt ⬆️ by $2.4 trillion over 10 years
- Uninsured pop. ⬆️ by 10.9 million in 2034
Full analysis: cbo.gov/publication/61…
The spending cuts mostly come from Medicaid ($344 billion over 10 years), food stamps and related programs ($295 billion) and the Affordable Care Act ($132 billion).
Note that these estimates don't take into account the macroeconomic impacts of the policy changes (it is not "dynamic" in wonk parlance). So to the extent tax/spending cuts affect economic growth, that will also affect revenues. CBO is working on an analysis that estimates these effects.
So this was an interesting finding from @NateSilver538, but one I found odd because @BLS_gov publishes CPI for regions (and for some metro areas) but not for states. So I dug into it a bit, and there's less here than meets the eye.
Nate's data is coming from this tracker from the @JECRepublicans. They don't have a state-level inflation estimate either, though. They just use BLS's estimate of regional inflation and apply it to an estimate of household spending when Biden took office. jec.senate.gov/public/index.c…
You can see this if you hover over their map (or download their data). States in the same region all have the same cumulative rates of inflation. But they differ in the amount of inflation experienced in dollar terms because some states have higher avg household incomes.
I hate that @ellawinthrop is leaving us, but I'm so glad I got to work with her on her last piece for @nytimesbusiness. She's the best, most collaborative, most creative visual journalist I've ever worked with. A thread with a few of my favorite Ben-and-Ella collabs: