Soon Pattern Finder will have distance to congestion in the screener; can find charts with favorable to risk: reward.
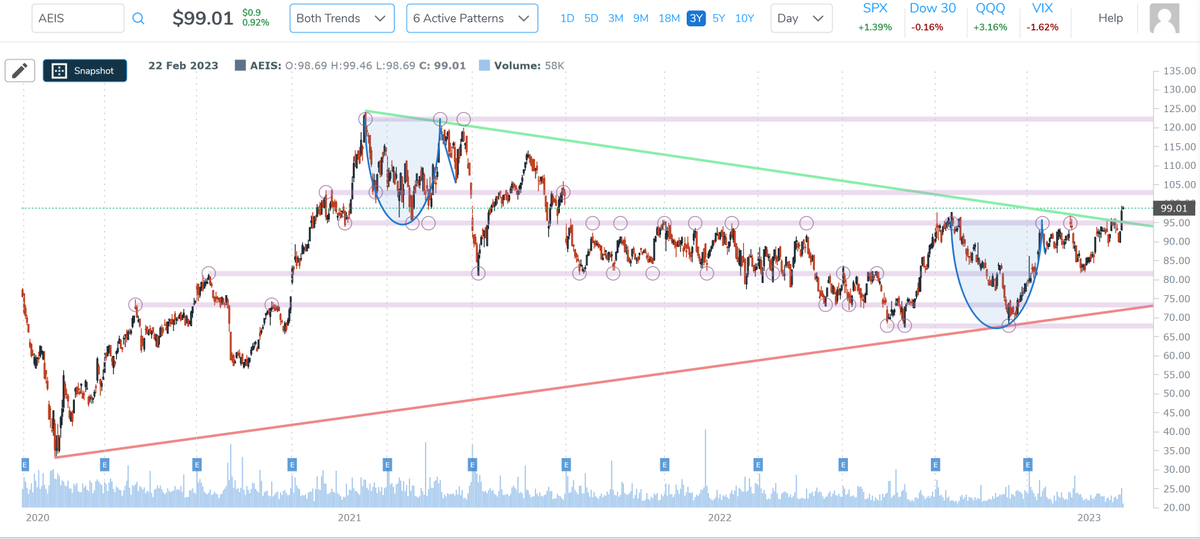
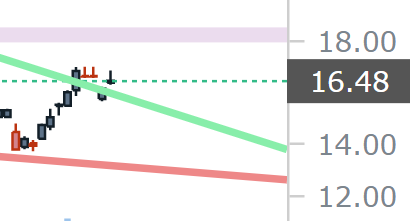
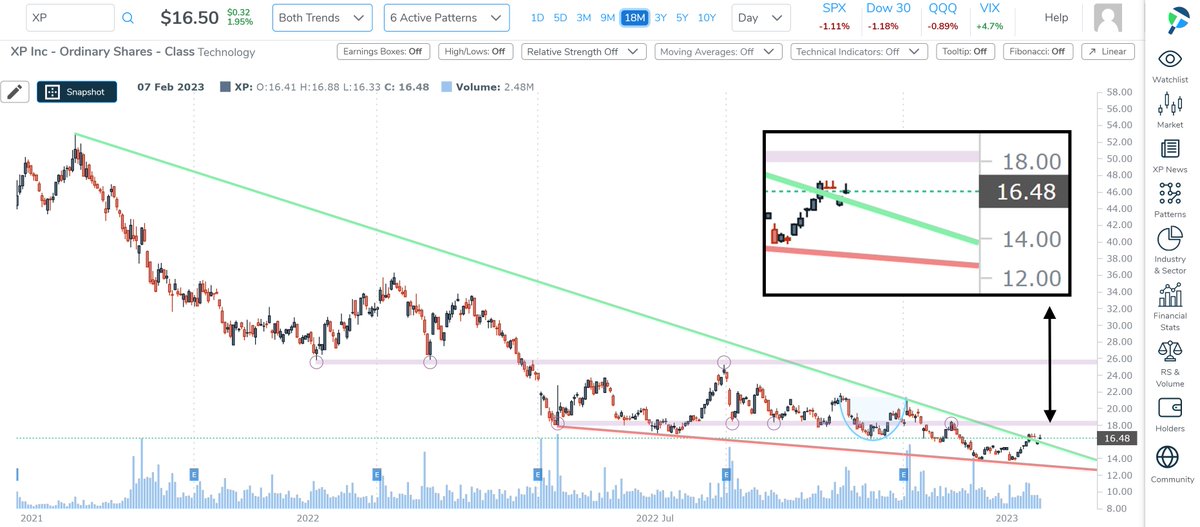
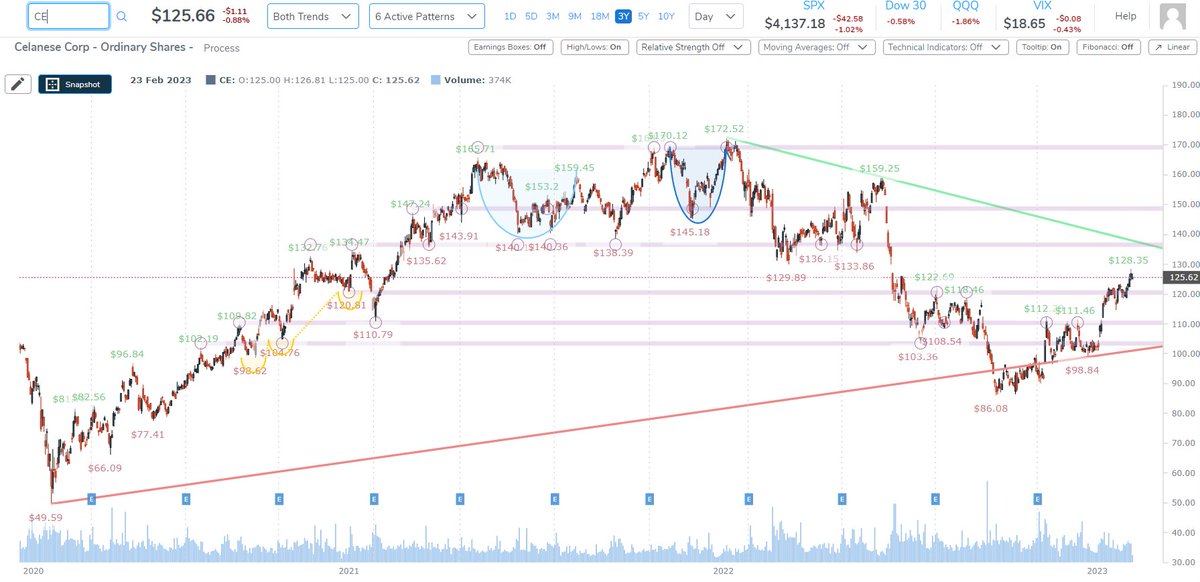
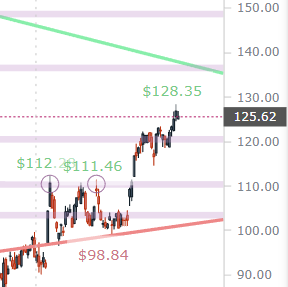
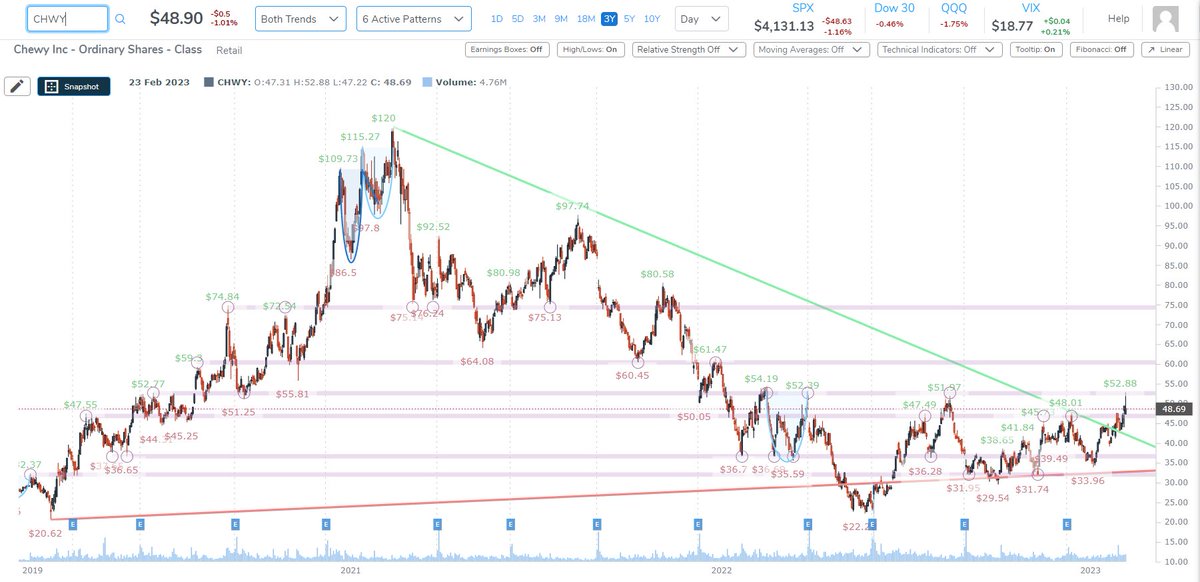
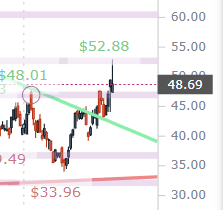
Here are a few examples; note distance to support (nearest congestion below stock), and distance to resistance (nearest congestion above stock.
/1
Here are a few examples; note distance to support (nearest congestion below stock), and distance to resistance (nearest congestion above stock.
/1
$CCU
/2
/2


$CE
/3
/3
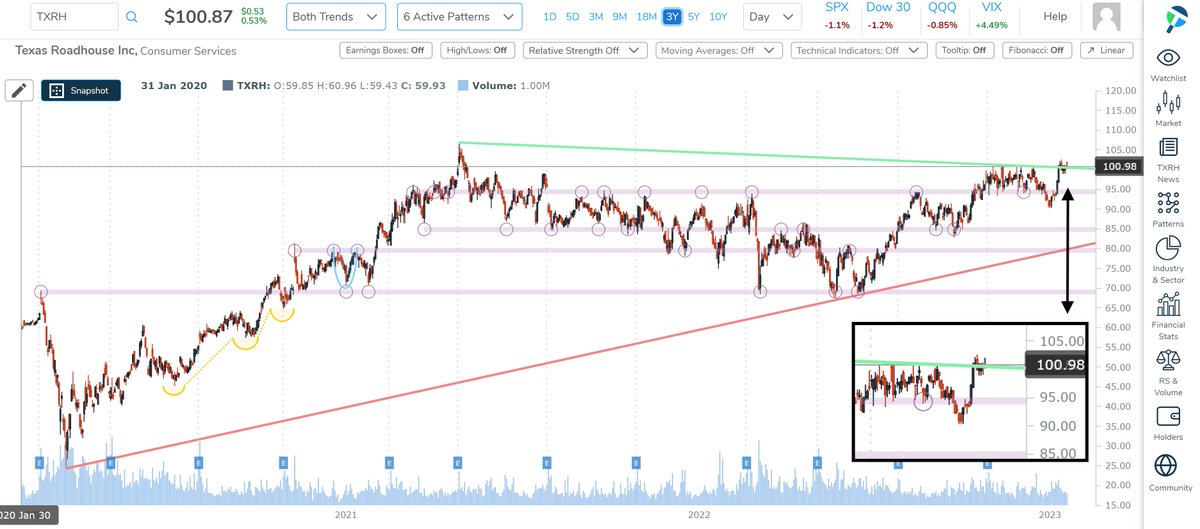
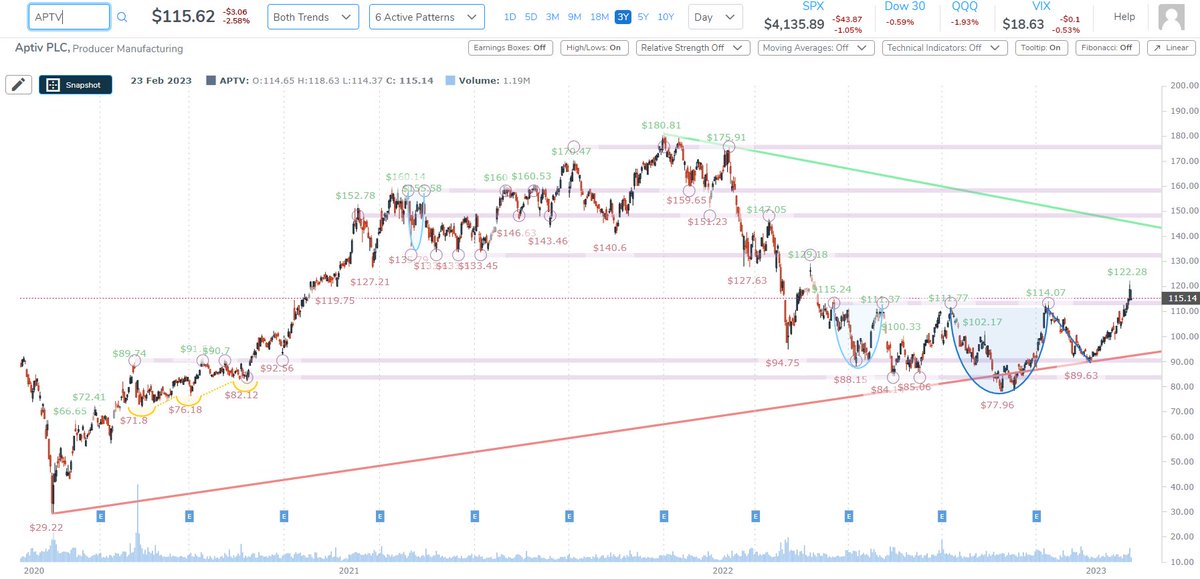
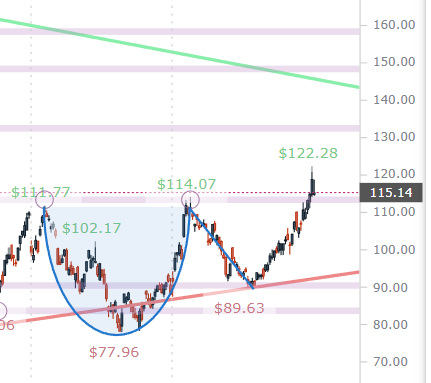
$APTV
same set-up but off of a cup with handle
/4
same set-up but off of a cup with handle
/4
$CHWY
/5
/5
...anyway, this is just a taste.
You can watch a quick video about all of this on the page below (middle of page):
patternfinder.cmlviz.com/pattern-finder…
6/6
You can watch a quick video about all of this on the page below (middle of page):
patternfinder.cmlviz.com/pattern-finder…
6/6
• • •
Missing some Tweet in this thread? You can try to
force a refresh