CEO @CMLviz. Contrib @Bloomberg @Reuters @Factset @Refinitiv . @Stanford Trained Mathematician. Former Option Market ...
 $CRWD
$CRWD 

 $CRWD
$CRWD 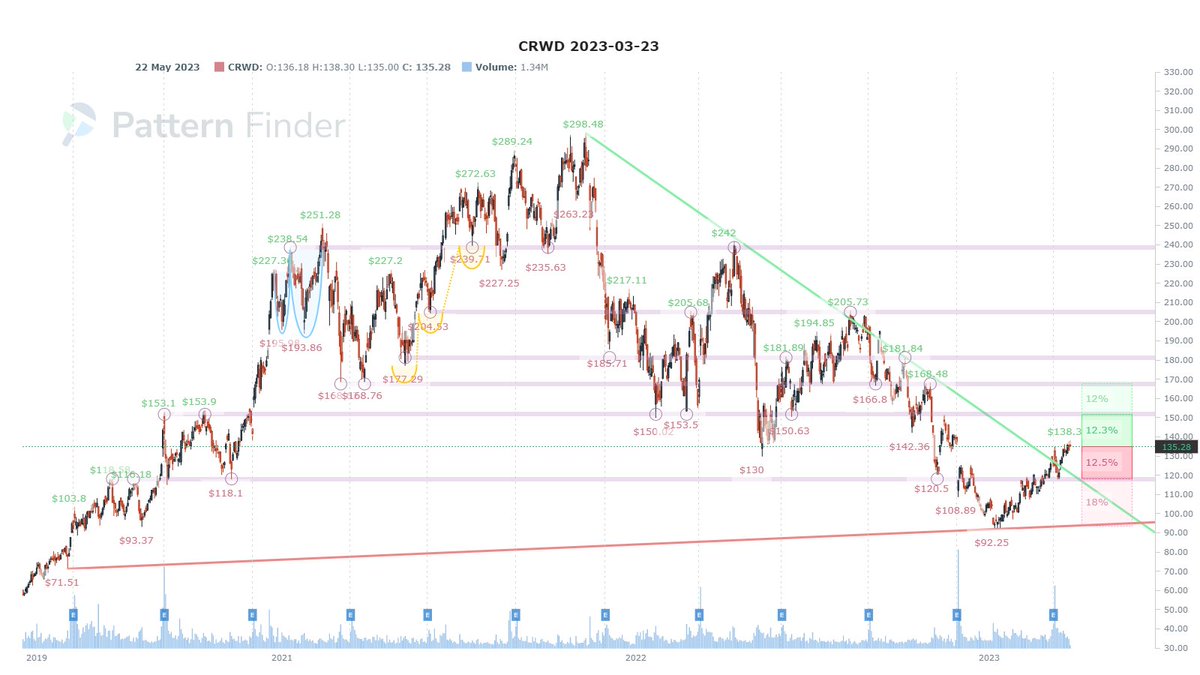

 $QQQ Strength when compared to $SPX, but very tight.

 The S&P GSCI® is a composite index of the commodity sector.
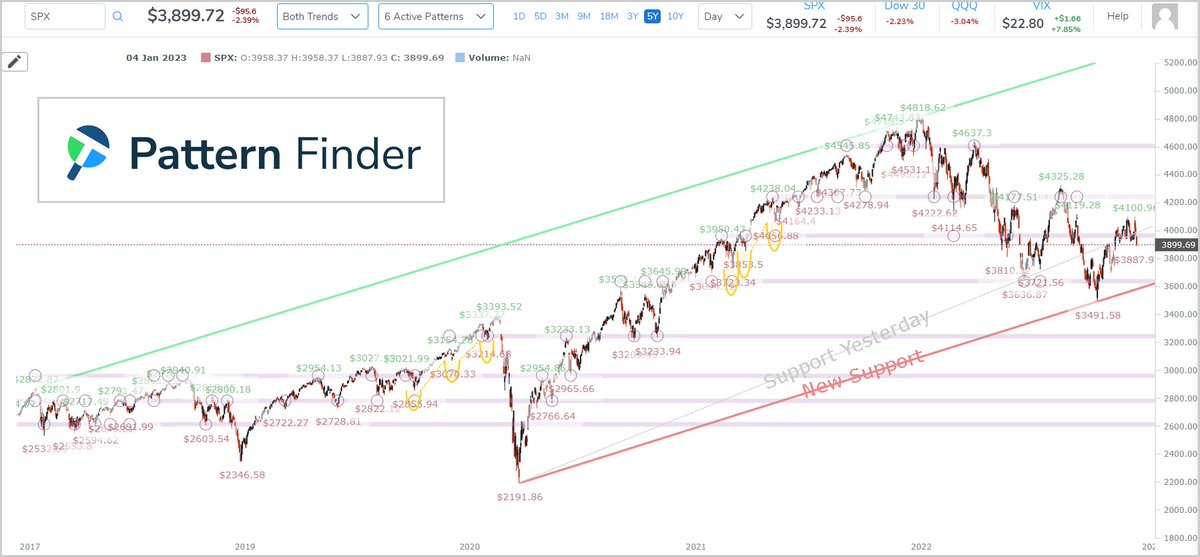
 $SPX
$SPX 


 $HALL
$HALL


 Chart #2: $META


 $DCBO
$DCBO


 $TTD
$TTD


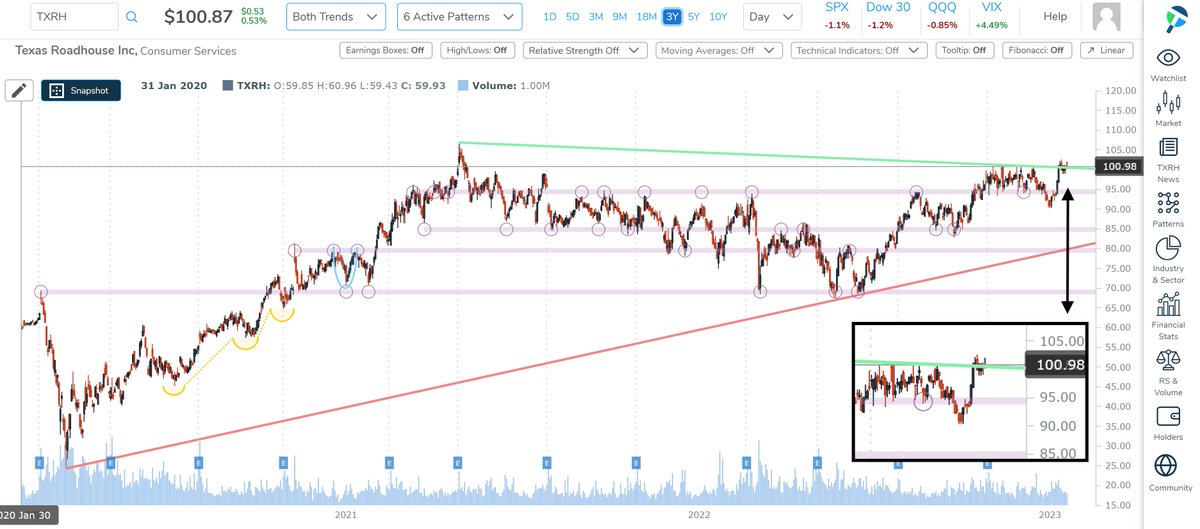
 $TXRH
$TXRH