
𝗧𝗵𝗲 𝗨𝗹𝘁𝗶𝗺𝗮𝘁𝗲 𝟮𝟬𝟬 𝗘𝗠𝗔 𝗦𝘁𝗿𝗮𝘁𝗲𝗴𝘆 𝗳𝗼𝗿 𝗣𝗼𝘀𝗶𝘁𝗶𝗼𝗻𝗮𝗹 𝗧𝗿𝗮𝗱𝗶𝗻𝗴
🧵 𝗔 𝗧𝗵𝗿𝗲𝗮𝗱 🧵
🧵 𝗔 𝗧𝗵𝗿𝗲𝗮𝗱 🧵
200 EMA : THE LONG TERM TREND
🔸 When a stock price crosses its 200-day moving average, it is a
technical signal that a reversal has occurred.
🔸 A stock above 200 ema is considered bullish in its long term trend and if its below 200 ema its considered bearish
[2/18]
🔸 When a stock price crosses its 200-day moving average, it is a
technical signal that a reversal has occurred.
🔸 A stock above 200 ema is considered bullish in its long term trend and if its below 200 ema its considered bearish
[2/18]
🔸 A simple rule of not buying stocks below 200 ema for short term trading could save a lot of money
🔸 Some may not agree with this and its ok!
[3/18]
🔸 Some may not agree with this and its ok!
[3/18]

One may consider investing in stocks if the stock is below 200 ema only if he is confirmed about the fundamentals of the stock
TREND:
🔸 200 ema trending up : Uptrend
🔸 200 ema sideways : Consolidation
🔸 200 ema trending down : downtrend
[4/18]
TREND:
🔸 200 ema trending up : Uptrend
🔸 200 ema sideways : Consolidation
🔸 200 ema trending down : downtrend
[4/18]
𝗛𝗼𝘄 𝘁𝗼 𝗮𝗽𝗽𝗹𝘆 ?
Select: Moving Average Exponential
[5/18]
Select: Moving Average Exponential
[5/18]


𝗥𝗲𝗹𝗮𝘁𝗶𝘃𝗲 𝘀𝘁𝗿𝗲𝗻𝗴𝘁𝗵
Type
“Relative Strength”
By bharattrader
Period : 123 ( for 6 months of trading )
[8/18]
Type
“Relative Strength”
By bharattrader
Period : 123 ( for 6 months of trading )
[8/18]

🔸 Relative Strength has a reference zero line
🔸 Line >0 Stock is 𝗢𝘂𝘁𝗽𝗲𝗿𝗳𝗼𝗿𝗺𝗶𝗻𝗴
🔸 Line <0 Stock is 𝗨𝗻𝗱𝗲𝗿𝗽𝗲𝗿𝗳𝗼𝗿𝗺𝗶𝗻𝗴
🔸 RS period 123 as we have around 123 trading days in 6 month of trading
🔸 RS reference as Nifty50 as benchmark index
[9/18]
🔸 Line >0 Stock is 𝗢𝘂𝘁𝗽𝗲𝗿𝗳𝗼𝗿𝗺𝗶𝗻𝗴
🔸 Line <0 Stock is 𝗨𝗻𝗱𝗲𝗿𝗽𝗲𝗿𝗳𝗼𝗿𝗺𝗶𝗻𝗴
🔸 RS period 123 as we have around 123 trading days in 6 month of trading
🔸 RS reference as Nifty50 as benchmark index
[9/18]
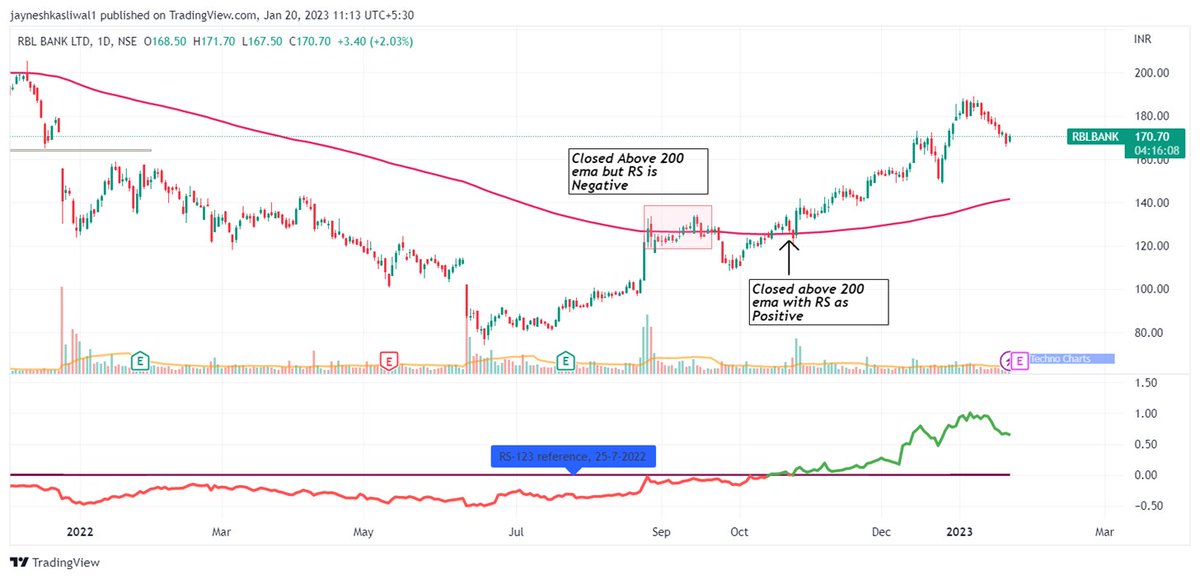
Strategy
🔸 Look for Reversal on stocks near 200 ema after a general market pullback in daily time frame
🔸 Buy when stock closes above the 200 ema with the 123 period RS line green
🔸 If the stock is closing above 200 ema but the Rs line is red it should not be bought
[10/18]
🔸 Look for Reversal on stocks near 200 ema after a general market pullback in daily time frame
🔸 Buy when stock closes above the 200 ema with the 123 period RS line green
🔸 If the stock is closing above 200 ema but the Rs line is red it should not be bought
[10/18]
Value stocks generally reverse from 200 ema as it provides a good buy point to investors
Screener :
𝗵𝘁𝘁𝗽𝘀://𝗰𝗵𝗮𝗿𝘁𝗶𝗻𝗸.𝗰𝗼𝗺/𝘀𝗰𝗿𝗲𝗲𝗻𝗲𝗿/𝗳𝘂𝗻𝗱𝗮𝗺𝗲𝗻𝘁𝗮𝗹-𝘁𝗲𝗰𝗵𝗻𝗶𝗰𝗮𝗹-𝗰𝗿𝗼𝘀𝘀𝗶𝗻𝗴-𝟮𝟬𝟬-𝗲𝗺𝗮
[11/18]
Screener :
𝗵𝘁𝘁𝗽𝘀://𝗰𝗵𝗮𝗿𝘁𝗶𝗻𝗸.𝗰𝗼𝗺/𝘀𝗰𝗿𝗲𝗲𝗻𝗲𝗿/𝗳𝘂𝗻𝗱𝗮𝗺𝗲𝗻𝘁𝗮𝗹-𝘁𝗲𝗰𝗵𝗻𝗶𝗰𝗮𝗹-𝗰𝗿𝗼𝘀𝘀𝗶𝗻𝗴-𝟮𝟬𝟬-𝗲𝗺𝗮
[11/18]


𝗘𝗻𝘁𝗿𝘆 𝗿𝘂𝗹𝗲𝘀 :
🔸 Enter on close above 200 ema with RS 123 +
🔸 Stoploss in this case should be max 5 to 7% as holding stocks below 200 ema is not advised
🔸 Keep Pyramiding if stocks move higher and adding positions with trailing Stoploss using the 200 ema
[12/18]
🔸 Enter on close above 200 ema with RS 123 +
🔸 Stoploss in this case should be max 5 to 7% as holding stocks below 200 ema is not advised
🔸 Keep Pyramiding if stocks move higher and adding positions with trailing Stoploss using the 200 ema
[12/18]
🔸 Trends generally last 6 months to 1+ years depending on the overall trend of the markets as well
🔸 Best suited after the market has been into a correction
[13/18]
🔸 Best suited after the market has been into a correction
[13/18]
[14/18]
𝗘𝘅𝗮𝗺𝗽𝗹𝗲𝘀 :
𝘚𝘰𝘶𝘵𝘩 𝘪𝘯𝘥𝘪𝘢𝘯 𝘣𝘢𝘯𝘬
𝘈𝘊𝘌
[15/18]
𝘚𝘰𝘶𝘵𝘩 𝘪𝘯𝘥𝘪𝘢𝘯 𝘣𝘢𝘯𝘬
𝘈𝘊𝘌
[15/18]


𝗧𝗵𝗶𝗻𝗴𝘀 𝘁𝗼 𝗿𝗲𝗺𝗲𝗺𝗯𝗲𝗿🔸 You may have to go in and out of a trade multiple no of times stock is in choppy zone
🔸 Risk Reward is Highly Favourable as on winning trades we make a lot of money
🔸 Works best after general market correction
[16/18]
🔸 Risk Reward is Highly Favourable as on winning trades we make a lot of money
🔸 Works best after general market correction
[16/18]

Watch this complete Video :
[17/18]
[17/18]

Join our Telegram for Stock Analysis and know more about how we exited ADANI Stocks just during the crash
t.me/Techno_charts
[18/18]
t.me/Techno_charts
[18/18]
• • •
Missing some Tweet in this thread? You can try to
force a refresh


