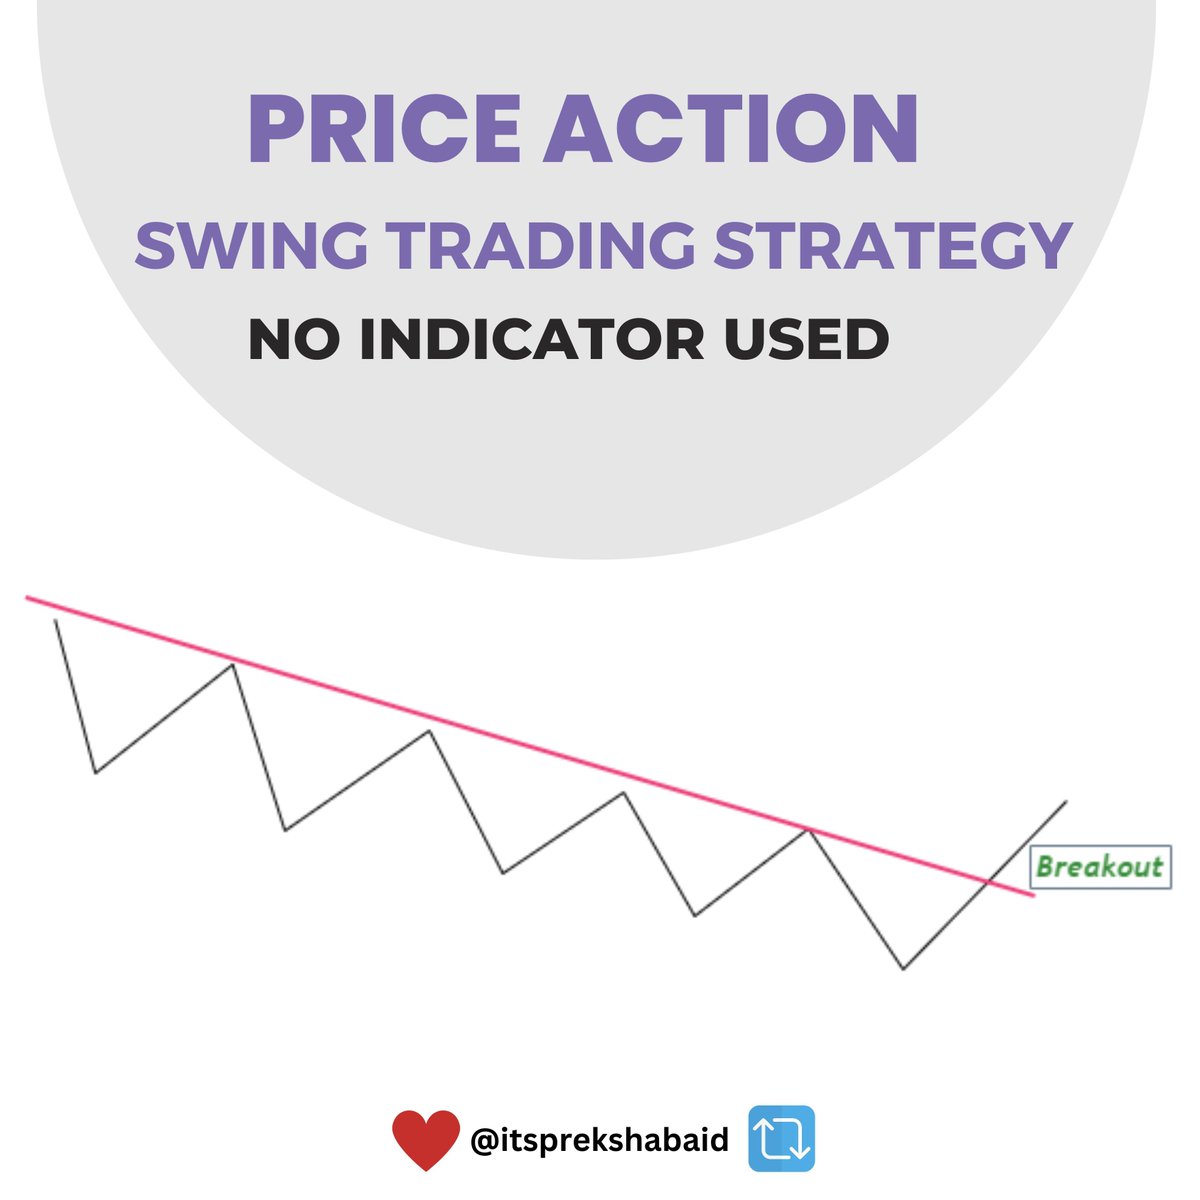
Simple Price Action - Swing Trading Strategy. 💚
No Indicator Used.
A THREAD 🧵
(1/13)
#StockMarketindia #trading #StockMarket @sunilgurjar01 @kuttrapali26
No Indicator Used.
A THREAD 🧵
(1/13)
#StockMarketindia #trading #StockMarket @sunilgurjar01 @kuttrapali26

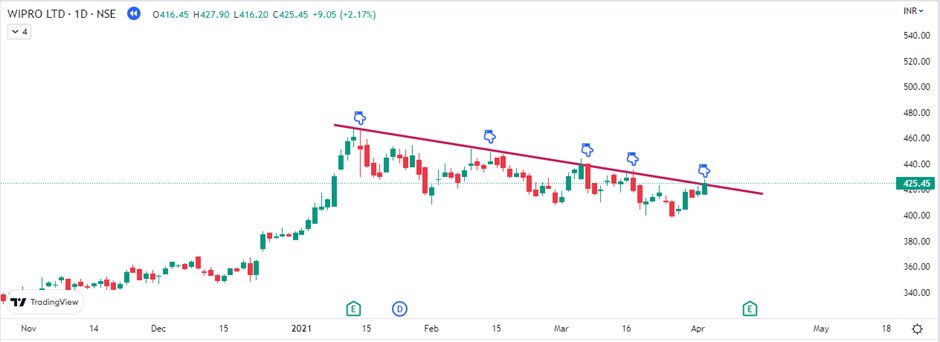
Step 1:
Identify the stocks which are in short term downtrend phase.
Let’s understand it with the chart of Wipro.
Date: Feb 2021
Here we can see, stock is in short term Correction/ Downtrend. (2/13)
Identify the stocks which are in short term downtrend phase.
Let’s understand it with the chart of Wipro.
Date: Feb 2021
Here we can see, stock is in short term Correction/ Downtrend. (2/13)

Step 2:
Draw a trendline by connecting all swing highs & wait for the price to break the trendline.
The Trend Line Breakout technique helps you time your entry in a trending market. (3/13)
Draw a trendline by connecting all swing highs & wait for the price to break the trendline.
The Trend Line Breakout technique helps you time your entry in a trending market. (3/13)
Step 3
Once the price closes above the trendline, take entry after the confirmation.
For confirmation : Wait for second candle to close above the breakout candle.
Confirmation always protect from fake breakouts. (4/13)
Once the price closes above the trendline, take entry after the confirmation.
For confirmation : Wait for second candle to close above the breakout candle.
Confirmation always protect from fake breakouts. (4/13)

Step 4:
✔Retest level: If you missed to add stock at breakout level, retest can be the best level where risk reward ratio is highly favourable.
If the retest holds the breakout level, the market is likely to reverse in the opposite direction & can change the trend. (5/13)
✔Retest level: If you missed to add stock at breakout level, retest can be the best level where risk reward ratio is highly favourable.
If the retest holds the breakout level, the market is likely to reverse in the opposite direction & can change the trend. (5/13)

Step 6:
✔Stoploss: Once the price gives trend line breakout, place your stoploss below the breakout candle.
Now the price should not come below this trendline, else the breakout will fail. (6/13)
✔Stoploss: Once the price gives trend line breakout, place your stoploss below the breakout candle.
Now the price should not come below this trendline, else the breakout will fail. (6/13)
Step 6:
#Trendline breakout is powerful setup for swing trading, here we can see a clear up move in the stock after the trendline breakout.
The trend changed from downtrend to uptrend. (7/13)
#Trendline breakout is powerful setup for swing trading, here we can see a clear up move in the stock after the trendline breakout.
The trend changed from downtrend to uptrend. (7/13)

Step 7: Target/ Exit point –
✔I always follow next resistance level as my target.
✔Always mark strong resistance areas in your chart and use them as a target for a perfect exit. (8/13)
✔I always follow next resistance level as my target.
✔Always mark strong resistance areas in your chart and use them as a target for a perfect exit. (8/13)
Trendline breakout reverse the trend, You can always trail your stop loss to ride the massive trends. (9/13)
Current example to track for better understanding:
MAHINDRA LIFESPACE DEV LTD (MAHLIFE)
Date : 03-Feb-2023
Stock given trendline #breakout with volume. (10/13)
MAHINDRA LIFESPACE DEV LTD (MAHLIFE)
Date : 03-Feb-2023
Stock given trendline #breakout with volume. (10/13)

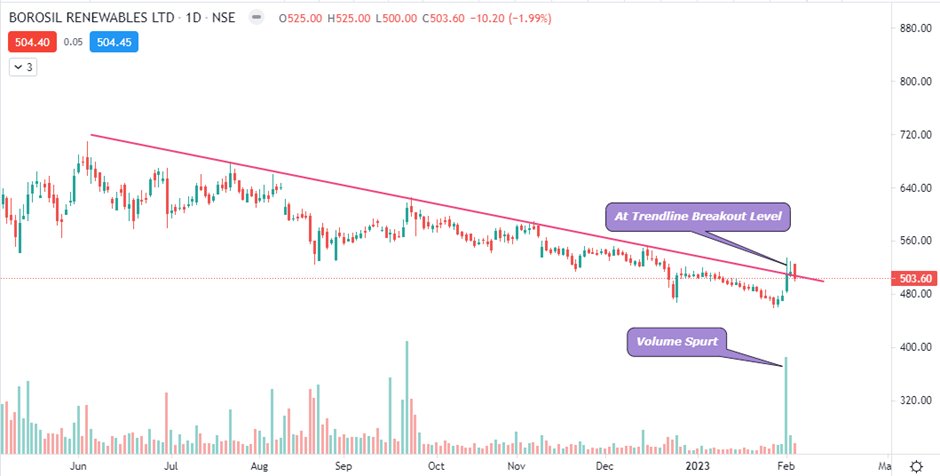
BOROSIL RENEWABLES LTD (BORORENEW)
Date : 03-Feb-2023
Stock is at trendline breakout level. (11/13)
Date : 03-Feb-2023
Stock is at trendline breakout level. (11/13)
BAJAJ AUTO
Date: 24-Jan-23
Recently given breakout and showing good strength. (12/13)
Date: 24-Jan-23
Recently given breakout and showing good strength. (12/13)

♥If you found this thread useful, please RT the first tweet.🔁 (13/13)
A Thread to learn : Simple range breakout strategy 👇
https://twitter.com/itsprekshaBaid/status/1618246899760533504?t=7BtsfCq0eiPH7f-hCT_8XQ&s=19
A Thread: To learn HAMMER candlestick pattern. 👇
https://twitter.com/itsprekshaBaid/status/1613103854870200321
A thread: To learn BULLISH ENGULFING candlestick pattern. 👇
https://twitter.com/itsprekshaBaid/status/1611971054347644929
• • •
Missing some Tweet in this thread? You can try to
force a refresh