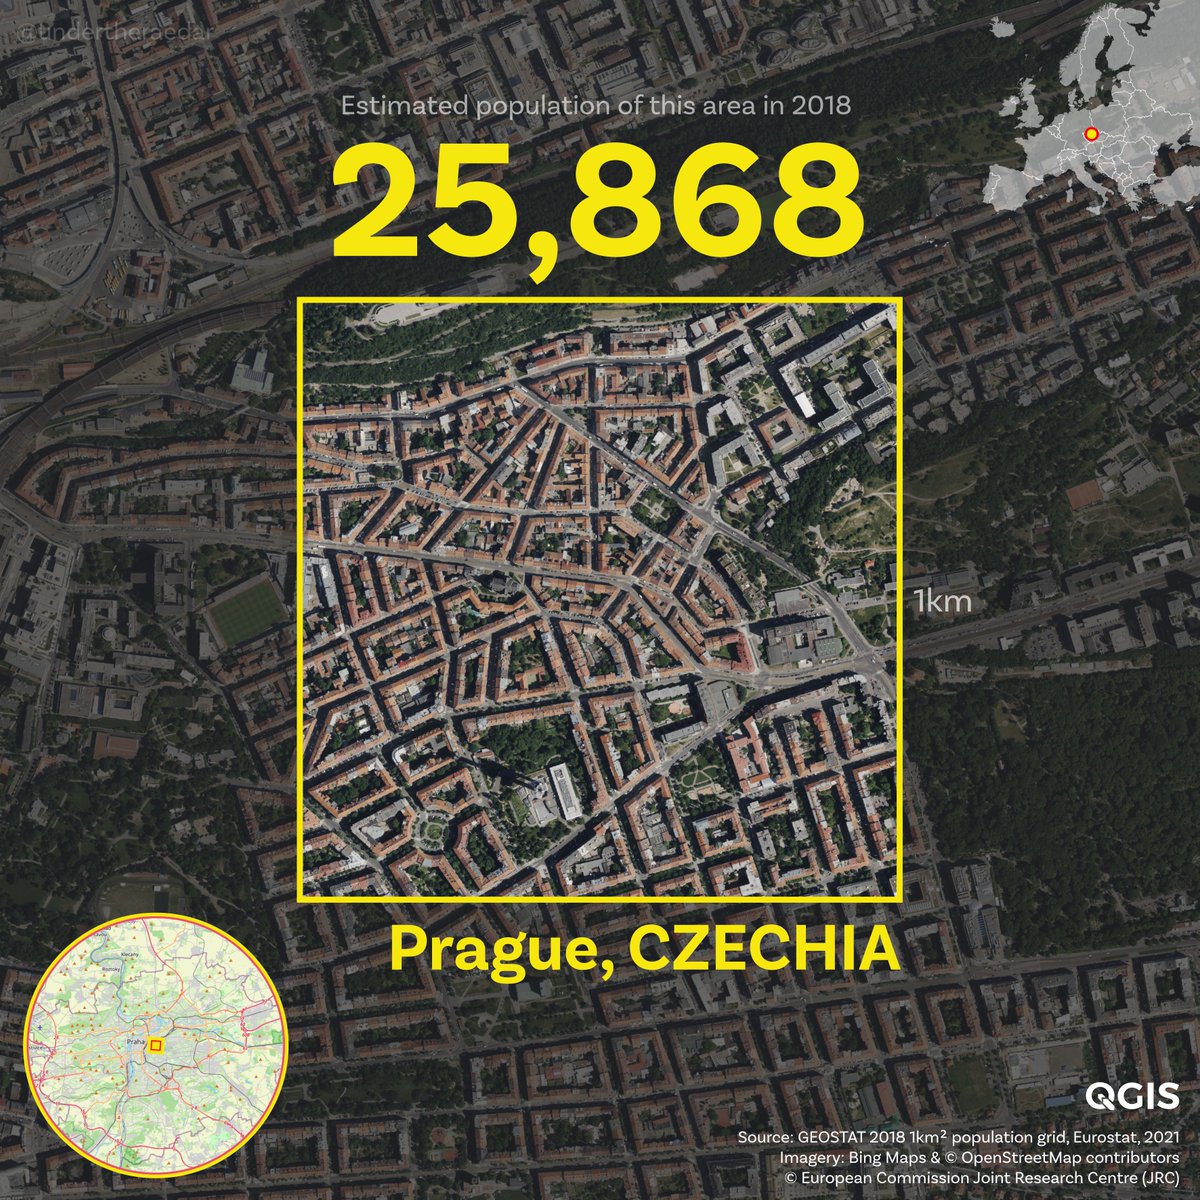
Okay, some European population density stuff now - starting with the top 100 1km grid squares by population across Europe, based on the most recent Eurostat data - more to follow
these are the top 3 by density, but I've shared a web folder with all 1km grid squares with more than 30,000 people living in them, as well as the top square in each of the 38 countries in the dataset
drive.google.com/drive/folders/…
drive.google.com/drive/folders/…


they're all really interesting to me, but I particularly liked Gijón, Bucharest and Valletta


there's a separate folder that has the top 1km grid square in each country, but to save a few clicks you can just watch them all in this video - so many interesting patterns - and note my higher number for the UK from 2021
statsmapsnpix.com/2023/02/where-…
statsmapsnpix.com/2023/02/where-…
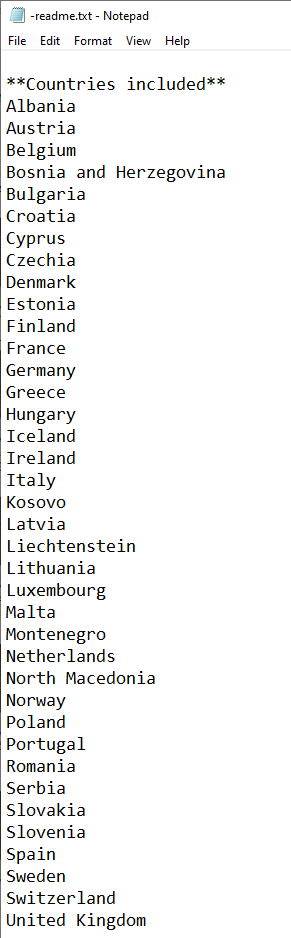
it's the Eurostat 1km grid data and I put a note in the web folder with full details, but here's a list of the 38 countries covered - the dataset is a bit of a beast but okay once you get to grips with it
drive.google.com/drive/folders/…
drive.google.com/drive/folders/…
so you're saying Spain and France tend to have a bit of urban density? Yes, just a bit


I've been looking at these things for many years, so this is an update to a previous set of maps that used older data - this set just helps locate some of the spikes on other maps I did, e.g.
theconversation.com/think-your-cou…
theconversation.com/think-your-cou…

I found 140 1km grid squares with more than 30,000 people - this is where they are - distributed quite widely across Spain, with all the French ones in Paris and a few elsewhere - but 89 of them are in Spain


there's a readme.txt file in the web folder with further information and some useful links, as well a couple of mp4s I posted above
drive.google.com/drive/folders/…
drive.google.com/drive/folders/…

as well as all the 1km grid squares with more than 30,000 people I also extracted the most populated 1km grid square for each country - here's the ones for Iceland, Denmark and Belgium


last time I did this I wasn't able to include city names but this time I've tried it but note it tends to be the wider urban area, rather than the official boundary - that bit gets a bit complicated when automating it, sorry (PS I also love Bilbao, didn't realise about Bucharest)


I tried to make sure the little locator maps allow those with local knowledge to see where the squares are, like here in Thessaloniki


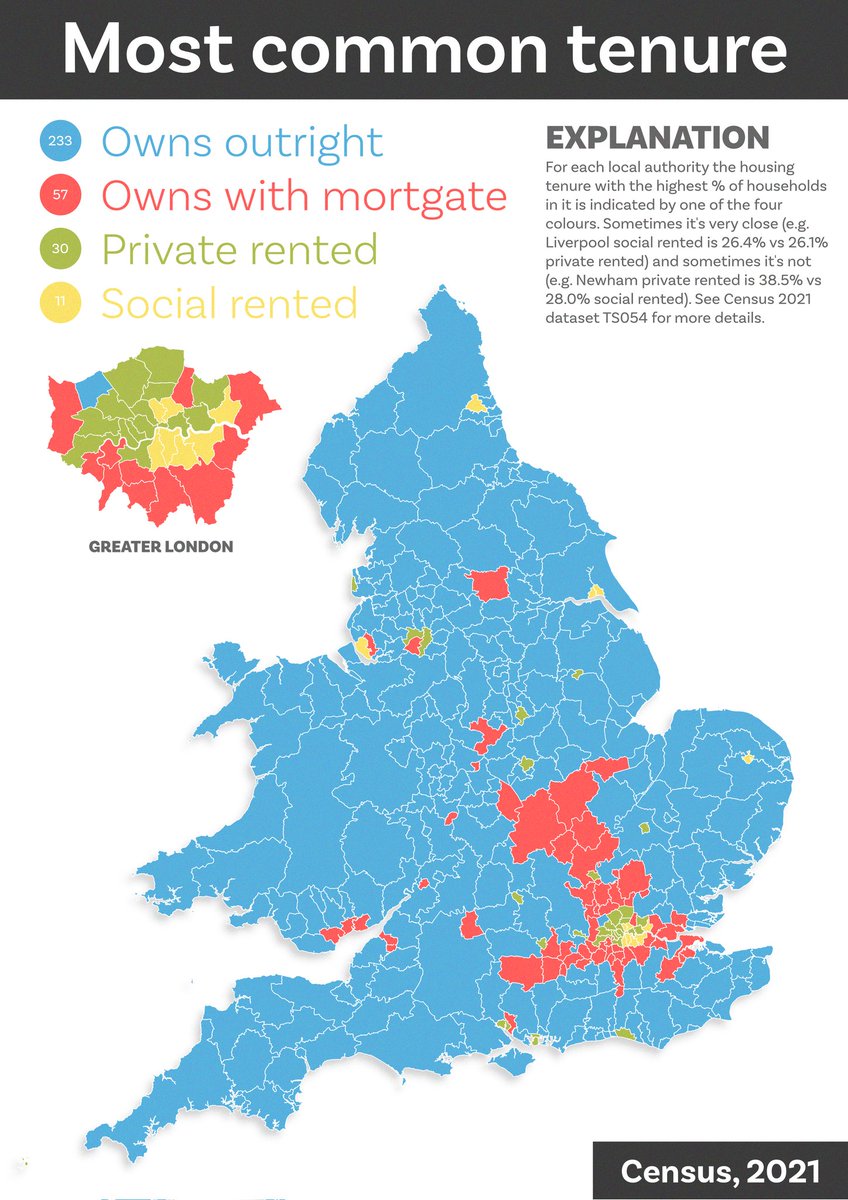
unlike with the Census 2021 data I looked at for the UK, in this data Portsmouth has the highest 1km density grid square outside London, which is perhaps not surprising - then Leicester, then Brighton (of course it does all depend on grid placement a bit)


in Scotland, Edinburgh has the highest density 1km grid square, followed not that far behind by Glasgow - so you could definitely argue the toss about margins of error here!


what about France but outside Paris? Still pretty high density in lots of places, just not Parisdensity - you have to go to 46 on the list to get a Marseille square, then Lyon at 56, Rennes at 60


for Italy we get Rome and Naples, and for Germany we get Berlin at the top of the list - again, very interesting street patterns here


some 1km grid squares look super-dense from above in relation to the urban fabric, but aren't as highly populated as you may expect - e.g. this one in Palermo

this example from Lisbon provides a bit of a contrast to the one in Palermo above - very similar population but lots and lots of green

for Ireland, the list of areas with more than 10,000 in a 1km grid cell goes Dublin, Dublin, Dublin, Dublin, Dublin, Dublin - here's the highest one

the dataset isn't just for the EU because Eurostat covers a much wider area here so we get to see the numbers in places like Niš, Serbia and Durrës, Albania


the highest population in any single 1km grid square in Poland is in Szczecin, followed by Warsaw and then Wrocław (normally the highest density in a country isn't quite that much higher than the second one)


as we may expect, Germany features a number of cities among the top densities


there are literally millions of these squares across Europe so this thread could go on forever, but I'll pause for now by adding the most populous 1km grid square where I live - and you can read more about the highest densities in the UK here:
statsmapsnpix.com/2023/02/where-…
statsmapsnpix.com/2023/02/where-…

one thing I would like to know is what has been the highest density humans have *ever* lived at - e.g. maybe this example from one of my slides on density

some other very interesting ones - Budapest, Vienna, Athens and Stockholm


two points about Stockholm, one of which is particularly interesting to north of Scotland folk like me:
1. Look closely at the Stockholm map, and then Google it en.wikipedia.org/wiki/Inverness…
2. Here's what the high density square looks like on the ground - google.com/maps/place/Sto…
1. Look closely at the Stockholm map, and then Google it en.wikipedia.org/wiki/Inverness…
2. Here's what the high density square looks like on the ground - google.com/maps/place/Sto…

I thought Amsterdam might have a slightly higher top figure, but well done Oslo for lining up with the grid, mostly - very kind of you


a little bit of terraced housing density from England with these examples from Southend, Liverpool and Leeds


add the wrong Leeds image above so you can say "This is Leeds" here instead

and for now, that is that, so I'll leave you with Helsinki - this is the highest population in any 1km grid square in Finland, according the Eurostat grid data, but of course Finland has good 1km grid data of its own
stat.fi/org/avoindata/…
stat.fi/org/avoindata/…

minor nerd note on all this: I did automate the formatting of the population numbers according to the country they related to but then I lost track of who actually uses a space or a . or a , and wasn't 100% sure it was right so left it with the comma
I spent only a few hours on this*, but it's a fairly quick thing to put together thanks to QGIS and Eurostat
*and maybe a decade thinking about population density!
*and maybe a decade thinking about population density!


if you were one of those highfalutin urbanist types you might try a thought experiment where you combined the 100 densest 1km squares in Europe into a single city of 10km by 10km to get a population of 3.8 million and then give it a name nobody will like

a note on the city names on the images - these are taken from the wider metro areas, so yes sometimes we get 'Barcelona' when a square is in, say, the municipality of L'Hospitalet de Llobregat - not ideal at times of course
ghsl.jrc.ec.europa.eu/ucdb2018visual…
ghsl.jrc.ec.europa.eu/ucdb2018visual…

these Spanish ones are also pretty interesting examples because there is a) a ton of non-residential space and b) 10,000+ in 1km sq is still a lot


• • •
Missing some Tweet in this thread? You can try to
force a refresh