This graph is a lie.
It is very easy to show you why.
It is claiming to show a cumulative death rate by vaccination status in a population with heart failure.
onlinejcf.com/action/showPdf…
It is very easy to show you why.
It is claiming to show a cumulative death rate by vaccination status in a population with heart failure.
onlinejcf.com/action/showPdf…

Let's unpick it bit by bit.
They measured deaths from 1st Jan '21 to 24th Jan '22.
A total of 389 days.
Let's check, the last value on the graph.
They give us the size of the population in each group at the end of the study.
They measured deaths from 1st Jan '21 to 24th Jan '22.
A total of 389 days.
Let's check, the last value on the graph.
They give us the size of the population in each group at the end of the study.

Using the deaths in the table, the cumulative incidence curve for mortality should peak at:
unvac = 599/3196 = 0.19
partially = 75/645 = 0.12
fully = 195/2200 = 0.09
boosted = 36/1053 = 0.03
Hmm - that's not what the graph shows.
Let's dig a bit deeper.
unvac = 599/3196 = 0.19
partially = 75/645 = 0.12
fully = 195/2200 = 0.09
boosted = 36/1053 = 0.03
Hmm - that's not what the graph shows.
Let's dig a bit deeper.

Let's ignore the vaccinations for a moment and see how many people died over time.
Here we see two spikes in the death curve.
Why would that be?
Here we see two spikes in the death curve.
Why would that be?

It is not a good match for covid deaths in USA at the time.

I have tried to reverese engineer the calculation of the rates. We have the deaths and we have the starting and final population sizes for each group.
The rest is estimated.
There is only a small range of possibilities for the population size of each group each week.
The rest is estimated.
There is only a small range of possibilities for the population size of each group each week.
This is what the cumulative incidence chart looks more like in reality:

But cumulative charts can hide a lot of interesting information so I also plotted it as the actual number of deaths ocurring in each period.
e.g. Subtracting the penultimate column from the last column shows deaths in last 49 days of the study gives
32
9
27
12 deaths.
e.g. Subtracting the penultimate column from the last column shows deaths in last 49 days of the study gives
32
9
27
12 deaths.
Plotting the deaths that occured in each period as a mortality rate gives this.
The high yellow point was only 2 deaths in a small population - it can be ignored.
The high yellow point was only 2 deaths in a small population - it can be ignored.

What we see is that in the early period the deaths were seen in the unvaccinated population but as time went on deaths started in the vaccinated population.
By the end the death rate was the same in all groups.
By the end the death rate was the same in all groups.

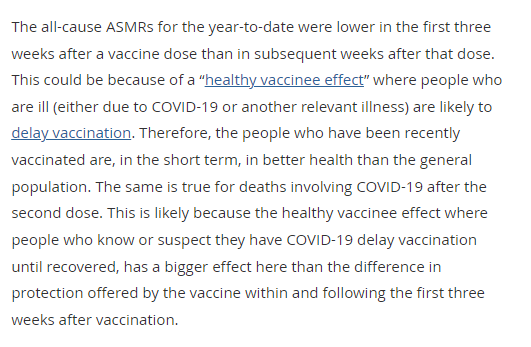
This is evidence of what is called a "healthy vaccinee effect."
It is the phenomenon of the dying rejecting a vaccine. They then die unvaccinated while the apparent death rate of the vaccinated population seems low for a while.
Eventually it all evens out as time catches up.
It is the phenomenon of the dying rejecting a vaccine. They then die unvaccinated while the apparent death rate of the vaccinated population seems low for a while.
Eventually it all evens out as time catches up.
It is not evidence that the vaccine saved lives.
The claims that vaccine would impact on death outcomes beyond covid has always been a bizarre one.
The claims that vaccine would impact on death outcomes beyond covid has always been a bizarre one.

There were 904 deaths in this population during the study period.
Nowhere do they say how many were deaths with a mention of covid.
Now, isn't that a bit odd for a paper on deaths after covid vaccination?
Nowhere do they say how many were deaths with a mention of covid.
Now, isn't that a bit odd for a paper on deaths after covid vaccination?
Note that the data for hospitalisation for the unvaccinated is not shown but is instead merged with the partially vaccinated.
People who didn't complete the initial course may represent those who became very unwell after vaccination, coincidentally or through injury.
People who didn't complete the initial course may represent those who became very unwell after vaccination, coincidentally or through injury.

Please feel free to try and squeeze a vaccine favourable picture out of the raw data by altering the population sizes that I estimated.
You will struggle to.
You will struggle to.
One author has responded with the excuse that I did not account for censoring.
I have redone the graphs having removed those who had died from the denominator.
They look almost identical.
The message remains the same.
I have redone the graphs having removed those who had died from the denominator.
They look almost identical.
The message remains the same.


• • •
Missing some Tweet in this thread? You can try to
force a refresh