Thread: excess mortality and COVID death reporting in Canada during COVID
All Canadian Excess Mortality Tracker data and graphs available here: covid19resources.ca/public/excess-…
All Canadian Excess Mortality Tracker data and graphs available here: covid19resources.ca/public/excess-…

The graphs I'll show are a bit complicated. But they're simplified versions of what you can find on the tracker, because I've deselected % excess mortality for individual age groups to make it easier to see patterns.
This graph here shows the data for fast-reporting provinces (NL, QC, AB, BC), with a comparison to the values for Canada as a whole (including the slow-reporting provinces).

All ages % excess mortality for the fast-reporting provinces is shown as thick BLACK line.
All ages % excess mortality for Canada is shown as thick RED line.
% excess mortality values are plotted on the LEFT y-axis.
All ages % excess mortality for Canada is shown as thick RED line.
% excess mortality values are plotted on the LEFT y-axis.

% excess mortality is the number of untimely/excess/extra deaths in a given week ABOVE what would be expected based on the ordinary number of deaths in that week in pre-COVID years.
Estimated % excess mortality is calculated for each age group separately (then summed for the total), so changes are NOT due to population aging.
We use the excess mortality estimates from @StatCan_eng, who also adjust for expected effects of aging.
We use the excess mortality estimates from @StatCan_eng, who also adjust for expected effects of aging.
@StatCan_eng What we do differently, is that we use the US CDC-preferred method for estimating excess mortality during periods where death reporting is delayed due to mortality crises (like COVID). When excess mortality estimates are negative, they're converted to zeroes.
@StatCan_eng Using this method is important if you want to compare regions with different times of onset of COVID mortality. It will slightly overestimate excess mortality in low prevalence times/regions, but is crucial if you have delayed death reporting, which is a big problem in Canada.
@StatCan_eng We will be switching to the non-CDC method as each province completes more than 99% of death reporting and once >95% of province/PHAC-reported COVID deaths have showed up in the Canadian Vital Statistics Death Database (CVS-D). So far, no Cdn province has hit that, even for 2020.
@StatCan_eng Back to the graph.
So, the thick black and red lines show % all ages excess mortality.
The thin blue (fast-reporting provinces) and red (Canada) lines show reported COVID deaths/100,000 population, plotted on the right axis.
So, the thick black and red lines show % all ages excess mortality.
The thin blue (fast-reporting provinces) and red (Canada) lines show reported COVID deaths/100,000 population, plotted on the right axis.

@StatCan_eng Plotting both % excess mortality and reported COVID deaths/100,000 on the same graph allows us to compare the dynamics of both types of data.
@StatCan_eng Plotting them together also gives a visual sense of how many COVID deaths have showed up in the CVS-D, and of how long reporting delays are.
To track reported COVID deaths, we collect the cumulative number of COVID deaths for each province reported in multiple datasets.
To track reported COVID deaths, we collect the cumulative number of COVID deaths for each province reported in multiple datasets.

@StatCan_eng The datasets include datasets provided by provinces themselves (ON, QC), and deaths reported in weekly PHAC report and associated csv (this is largely aggregate numbers pulled by PHAC from provincial reports, plus numbers that come in to the PHAC dataset of individual cases).
@StatCan_eng We also pull cumulative deaths from the PHAC case dataset when it is posted each month by StatsCan (usually posted 1-2 weeks after excess mortality update).
And, we pull cumulative COVID deaths that show up in the CVS-D.
And, we pull cumulative COVID deaths that show up in the CVS-D.
@StatCan_eng Then, for any given week, we take the highest cumulative total deaths reported from the different data sources. In general, the further back you go in the epidemic, the more likely it is that the highest number is the one in the CVS-D, since the CVS-D records actual week of death
@StatCan_eng Death reporting by other sources often reports/records deaths later than deaths recorded in the CVS-D, which makes sense.
@StatCan_eng But, a lot of COVID deaths are still missing from the CVS-D, even for 2020. This is because even for 2020 there are still about 11,000 deaths in Canada for which cause of death reporting has not been completed. Most of them won't be COVID deaths, but some are.
@StatCan_eng If we still have so much outstanding death reporting for 2020, you can imagine how many COVID deaths have not yet showed up in the CVS-D for years after 2020.
So, as the pandemic continues, cumulative totals in the CVS-D are often less than deaths reported in other data sources.
So, as the pandemic continues, cumulative totals in the CVS-D are often less than deaths reported in other data sources.
@StatCan_eng For those who are interested, here are how many provincially/PHAC-reported COVID deaths from 2020 have not yet showed up in the CVS-D.
NL: none from 2020 reported to CVS-D yet
QC: 21 from 2020 not yet reported to CVS-D
ON: 468
MB: 67
AB: 41
CAN: 540 from 2020 not yet in CVS-D
NL: none from 2020 reported to CVS-D yet
QC: 21 from 2020 not yet reported to CVS-D
ON: 468
MB: 67
AB: 41
CAN: 540 from 2020 not yet in CVS-D
@StatCan_eng When >95% of COVID deaths for 2020 come in AND more than 99% of all cause of death reporting is complete we can move on to the non-CDC method of estimating excess mortality, but no province has met that combined threshold for 2020 yet.
@StatCan_eng What all of this means is that in the graphs I'm going to show you, the reported COVID deaths are often shifted right compared to excess mortality, and this shift is more pronounced the further along we go in the epidemic.

@StatCan_eng As reporting to the CVS-D gets closer to completion, the reported COVID death curve shifts left to coincide better with % excess mortality curves.
@StatCan_eng We may never get perfect alignment, since Canada has not been great about detecting/reporting younger deaths, and a lot of our situational awareness has been focused on long-term care.
@StatCan_eng So, our reported COVID deaths are also likely to be shifted a bit right of excess mortality because we count COVID deaths in LTC better than in the general population, and because waves have generally hit older populations later than younger populations.
@StatCan_eng Finally, if we have counted deaths better in LTC than in the non-LTC population, we'd expect reported COVID deaths to be higher than excess mortality in later parts of waves because a greater percentage of those reported deaths are likely to be incidental (with not from COVID).
@StatCan_eng About 20% of people living in LTC die each year normally. Since Quebec did a really good job of reporting COVID deaths for the first couple of years of COVID, we can estimate what % of reported COVID deaths pre-vaccine were incidental (with not from).
@StatCan_eng That number for QC in the pre-vaccine era is just over 20%, meaning that the province likely identified most COVID deaths during that period, and that about 20% of these were incidental (with, not from COVID).
@StatCan_eng Most provinces except MB never really reported enough COVID deaths in 2020 to exceed excess all-cause mortality by 20%, so basically all reported COVID deaths outside QC and MB and 2020 were from, not with COVID. And there are a lot of missing COVID deaths.
@StatCan_eng Some of these missing COVID deaths are coming into the CVS-D, slowly, so the gap of unexplained excess mortality for 2020 (difference between reported COVID deaths and all ages excess mortality) is narrowing.
@StatCan_eng The gap may disappear once provinces with COVID deaths not yet reported to CVS-D complete their reporting. And for NS, NB, SK and BC we're now seeing more 2020 deaths in the CVS-D than were reported by provinces on prov pages or to PHAC, so we'll likely see increases there too.
@StatCan_eng That's just 2020....I want to help people understand that even excess mortality estimates and reported COVID deaths for that year are still in flux.
@StatCan_eng From comparison of @CIHI_ICIS and PHAC data we know there are still likely thousands of 2020 COVID hospitalizations and ICU admissions in Canada that have not yet been reported to PHAC, which means there are likely still additional deaths that haven't been reported nationally.
@StatCan_eng @CIHI_ICIS All we can do is wait and keep updating data sources to figure out when reporting for 2020 is reasonably complete.
Given that there's still a lot of outstanding reporting for 2020, you can imagine that numbers for 2021, 2022 and 2023 are even further behind.
Given that there's still a lot of outstanding reporting for 2020, you can imagine that numbers for 2021, 2022 and 2023 are even further behind.
@StatCan_eng @CIHI_ICIS ok, let's come back to that graph again, to point out one more thing about the curves.
Reported COVID death curves are often fatter/flatter at the top than excess mortality curves, especially earlier in the epidemic.
Reported COVID death curves are often fatter/flatter at the top than excess mortality curves, especially earlier in the epidemic.
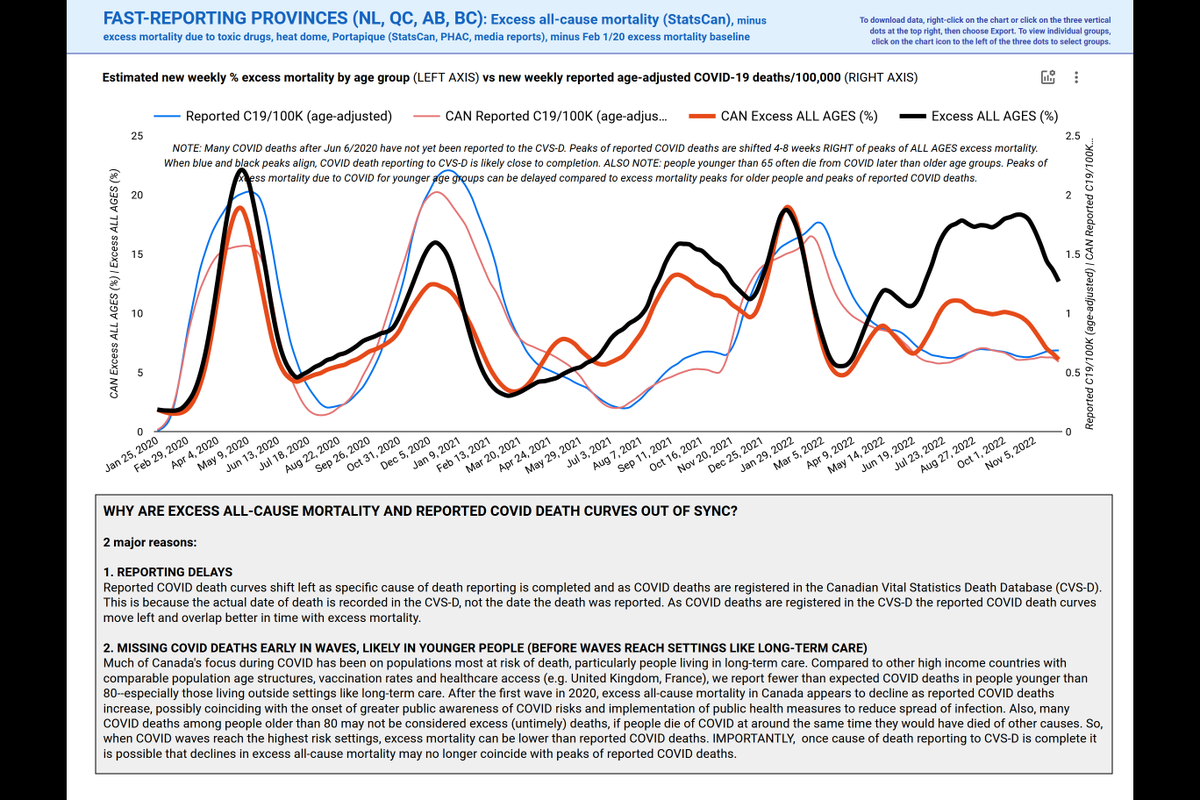
@StatCan_eng @CIHI_ICIS This happens when reported COVID deaths in all datasets are not yet in sync, and when cumulative totals of deaths reported by provinces/PHAC reach their maxima later than cumulative totals of CVS-D-reported deaths. The length of the plateau roughly reflects the reporting delay.
@StatCan_eng @CIHI_ICIS For the first wave in 2020, that delay is about one month. For the big December wave in 2020, the delay is about 2 weeks, although there are still a chunk of deaths from that wave missing from the CVS-D.
That makes sense. Our reporting got faster.
That makes sense. Our reporting got faster.
@StatCan_eng @CIHI_ICIS But, as you'll see when I finally show graphs for individual provinces, there are still some pretty long reporting delays in some provinces, and some reported COVID death curves only seem to make sense if earlier unreported COVID deaths are being added in later reporting waves.
@StatCan_eng @CIHI_ICIS OK, so, I think I've covered some of the major things it's important to think about when looking at these graphs.
Let's get to the graphs themselves.
And keep in mind that reporting in the Omicron period is still far behind, especially outside the fast-reporting provinces.
Let's get to the graphs themselves.
And keep in mind that reporting in the Omicron period is still far behind, especially outside the fast-reporting provinces.

@StatCan_eng @CIHI_ICIS Also keep in mind that apparent declines in excess mortality since ~Oct/22, even in fast-reporting provinces, may well reflect reporting delays.
Even the fast-reporting provinces keep adding more deaths in earlier months over time, so the fall 2022 numbers will still go up.
Even the fast-reporting provinces keep adding more deaths in earlier months over time, so the fall 2022 numbers will still go up.

@StatCan_eng @CIHI_ICIS Finally, as CVS-D reporting for 2021 comes in, the reported COVID deaths for the summer and fall are slowly increasing--there's a big gap in unexplained excess mortality for that period, but as you can see, it closely follows the Delta wave.

@StatCan_eng @CIHI_ICIS Unfortunately, we can't do anything except wait for provinces to report before we can understand that gap. But it's important to know that in QC, which still reported COVID deaths well through much of 2021, all 2021 excess mortality is accounted for by reported COVID deaths.
@StatCan_eng @CIHI_ICIS In 2022, the gap between reported COVID deaths and excess mortality is really, really big.
We're working on estimating the total expected with COVID and from COVID deaths for Omicron, plus expected excess mortality directly attributable to COVID deaths. I'll explain a bit later.
We're working on estimating the total expected with COVID and from COVID deaths for Omicron, plus expected excess mortality directly attributable to COVID deaths. I'll explain a bit later.

@StatCan_eng @CIHI_ICIS I'll get to the Omicron estimates later in the thread, but first will share the graphs showing % excess mortality vs reported COVID deaths/100K for each province for the COVID epidemic to date.
@StatCan_eng @CIHI_ICIS One last thing I forgot to add is that our excess mortality estimates EXCLUDE estimated excess mortality attributable to toxic drugs and heat domes.
It's certain some of the deaths due to toxic drugs have been missed/not yet been reported, due to similar slow death reporting.
It's certain some of the deaths due to toxic drugs have been missed/not yet been reported, due to similar slow death reporting.
@StatCan_eng @CIHI_ICIS We update the toxic drug death estimates every month from the PHAC reporting site, and by calculating % excess mortality attributable to suicides and all accidents combined for each week of the epidemic (to try to catch missing drug deaths).
@StatCan_eng @CIHI_ICIS We're positive some of the unexplained excess mortality for each province is related to delayed/incomplete reporting of drug deaths, in addition to delayed/incomplete reporting of COVID deaths.
@StatCan_eng @CIHI_ICIS It's almost certain some of unexplained excess mortality, especially in the last year, is an indirect effect of COVID and severe challenges with accessing healthcare in Canada.
@StatCan_eng @CIHI_ICIS The problem is....it's hard to estimate how much of it is due to health system overload unless provinces actually report their f'ing COVID and toxic drug deaths in a timely fashion.
Waiting until 2025 to understand large unexplained gaps in excess mortality in 2022 is too late.
Waiting until 2025 to understand large unexplained gaps in excess mortality in 2022 is too late.
@StatCan_eng @CIHI_ICIS If provinces actually prioritized fast, complete reporting of two of the major current contributors to excess mortality (toxic drugs and COVID), we might actually have a sense of the scale and causes (and policy responses) to the problem.
@StatCan_eng @CIHI_ICIS And provinces HAVE to stop massaging reported COVID deaths. Just report all you identify. It's not hard to figure out after the fact what % were from vs with COVID. Not reporting all of them in a timely fashion leaves these big unexplained mortality gaps where misinfo seeps in.
@StatCan_eng @CIHI_ICIS OK, keeping all these caveats (and complaints!) in mind, here are the graphs for each province.
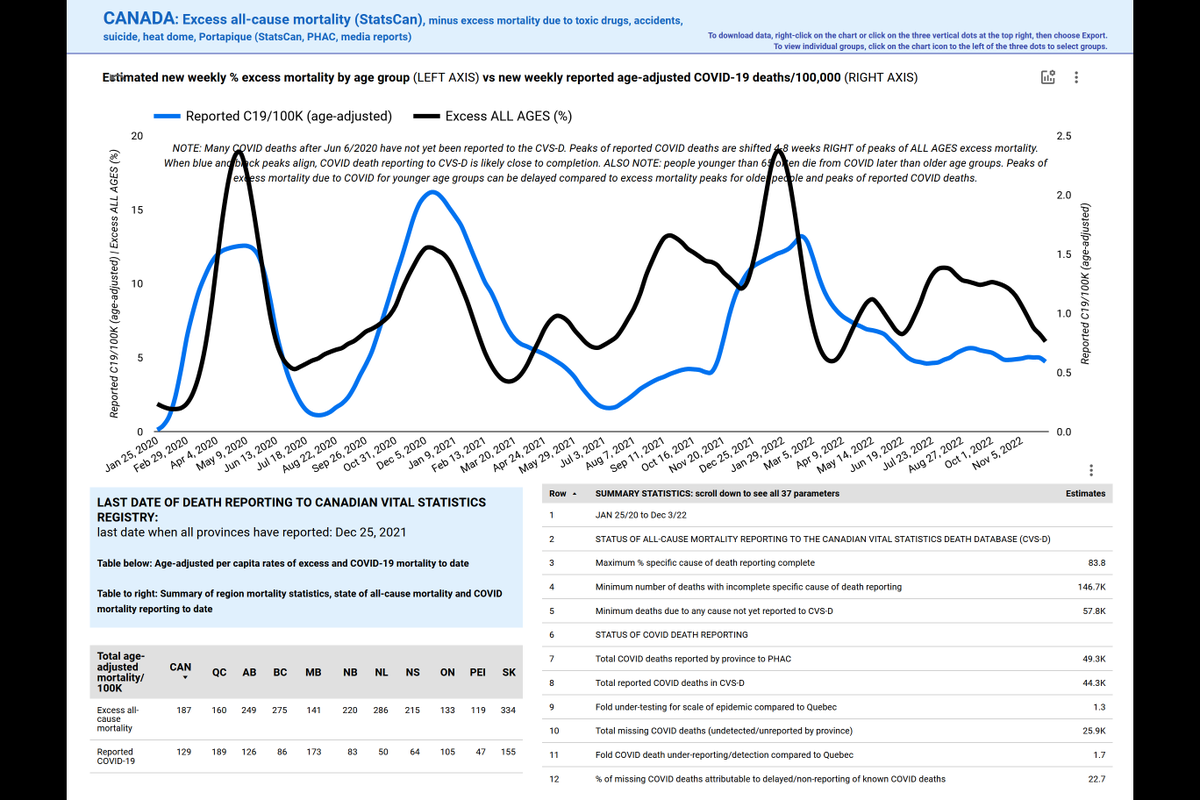
@StatCan_eng @CIHI_ICIS CANADA
Jan 25/20-Dec 3/23
Total drug/heat-dome-adjusted excess deaths: 71,405
Total reported COVID deaths: 49,286
Total unexplained excess mortality: 25,856
Jan 25/20-Dec 3/23
Total drug/heat-dome-adjusted excess deaths: 71,405
Total reported COVID deaths: 49,286
Total unexplained excess mortality: 25,856
NEWFOUNDLAND AND LABRADOR
Jan 25/20-Dec 3/23
Total drug/heat-dome-adjusted excess deaths: 1,592
Total reported COVID deaths: 278
Total unexplained excess mortality: 1,314
Jan 25/20-Dec 3/23
Total drug/heat-dome-adjusted excess deaths: 1,592
Total reported COVID deaths: 278
Total unexplained excess mortality: 1,314

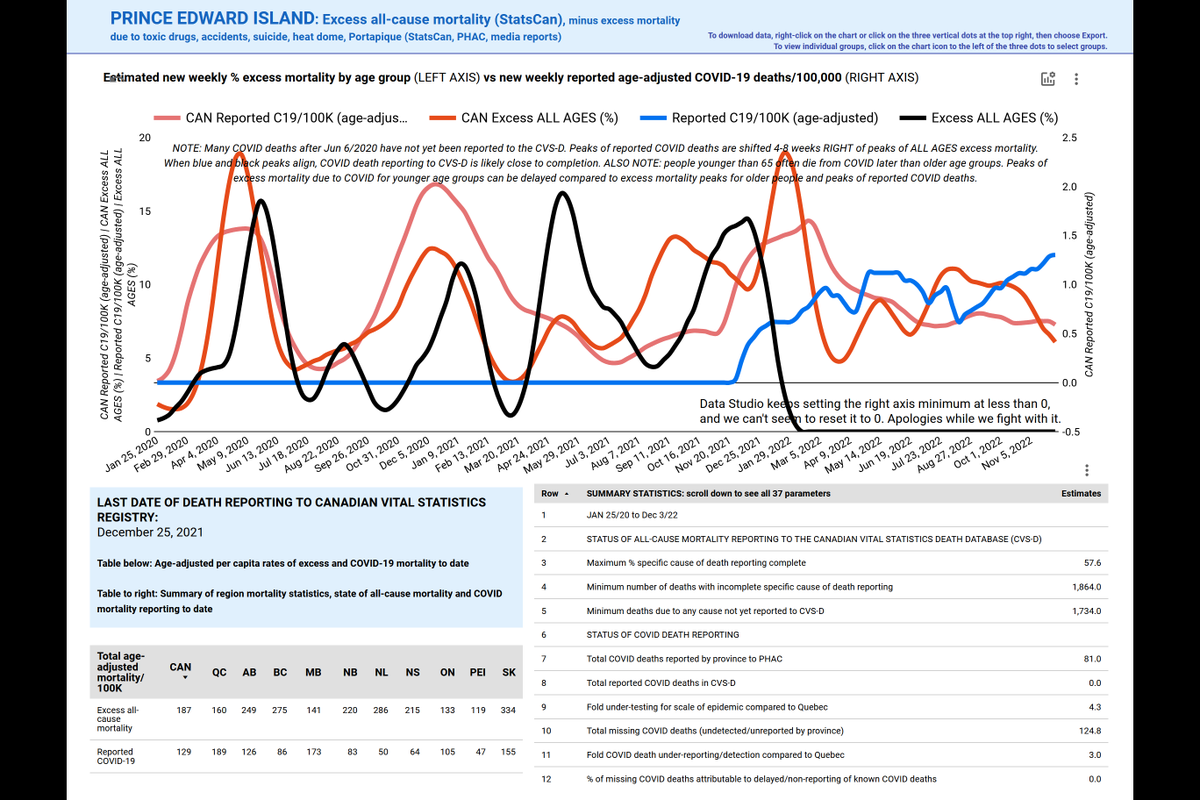
PRINCE EDWARD ISLAND
Jan 25/20-Dec 3/23
Total drug/heat-dome-adjusted excess deaths: 206
Total reported COVID deaths: 81
Total unexplained excess mortality: 125
Last death reporting date to CVS-D: Dec 25/21 (yes, 2021)
Jan 25/20-Dec 3/23
Total drug/heat-dome-adjusted excess deaths: 206
Total reported COVID deaths: 81
Total unexplained excess mortality: 125
Last death reporting date to CVS-D: Dec 25/21 (yes, 2021)
NOVA SCOTIA
Jan 25/20-Dec 3/23
Total drug/heat-dome-adjusted excess deaths: 2,246
Total reported COVID deaths: 666
Total unexplained excess mortality: 1,580
Last death reporting date to CVS-D: Oct 29/22
Jan 25/20-Dec 3/23
Total drug/heat-dome-adjusted excess deaths: 2,246
Total reported COVID deaths: 666
Total unexplained excess mortality: 1,580
Last death reporting date to CVS-D: Oct 29/22

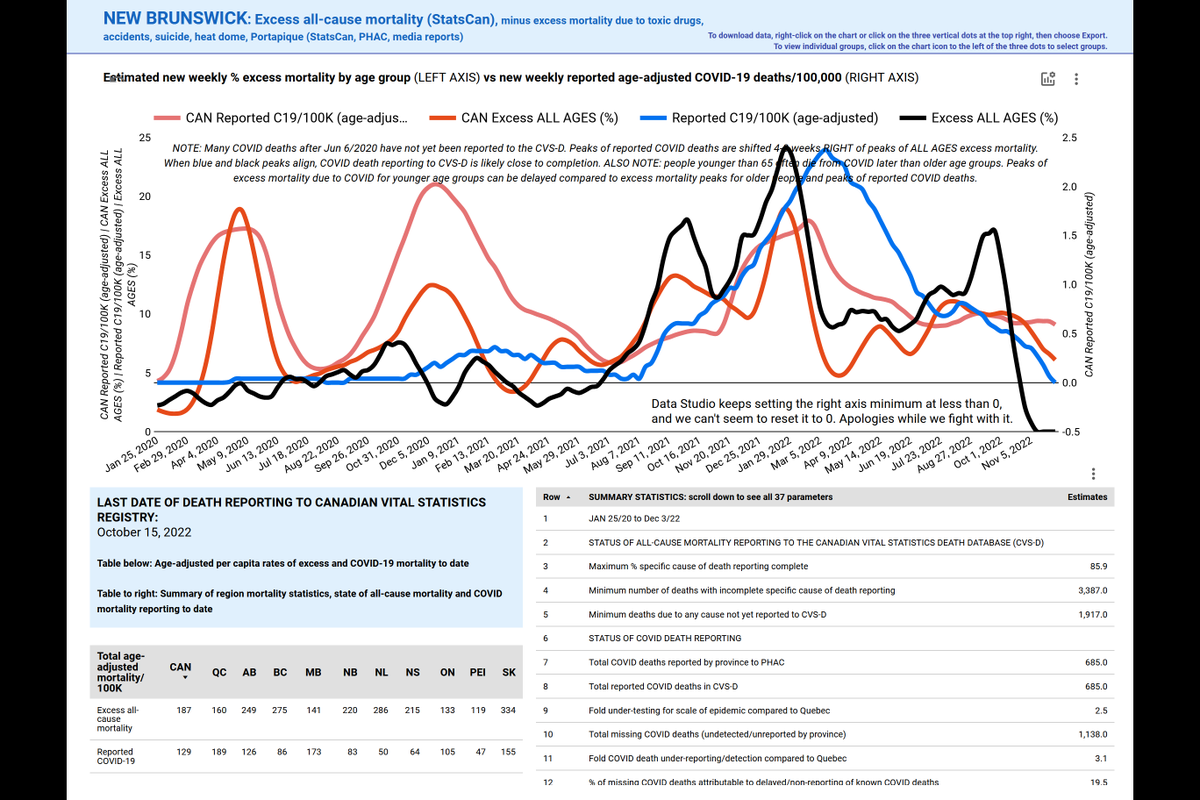
NEW BRUNSWICK
Jan 25/20-Dec 3/23
Total drug/heat-dome-adjusted excess deaths: 1,823
Total reported COVID deaths: 685
Total unexplained excess mortality: 1,138
Last death reporting date to CVS-D: Oct 15/22
Jan 25/20-Dec 3/23
Total drug/heat-dome-adjusted excess deaths: 1,823
Total reported COVID deaths: 685
Total unexplained excess mortality: 1,138
Last death reporting date to CVS-D: Oct 15/22
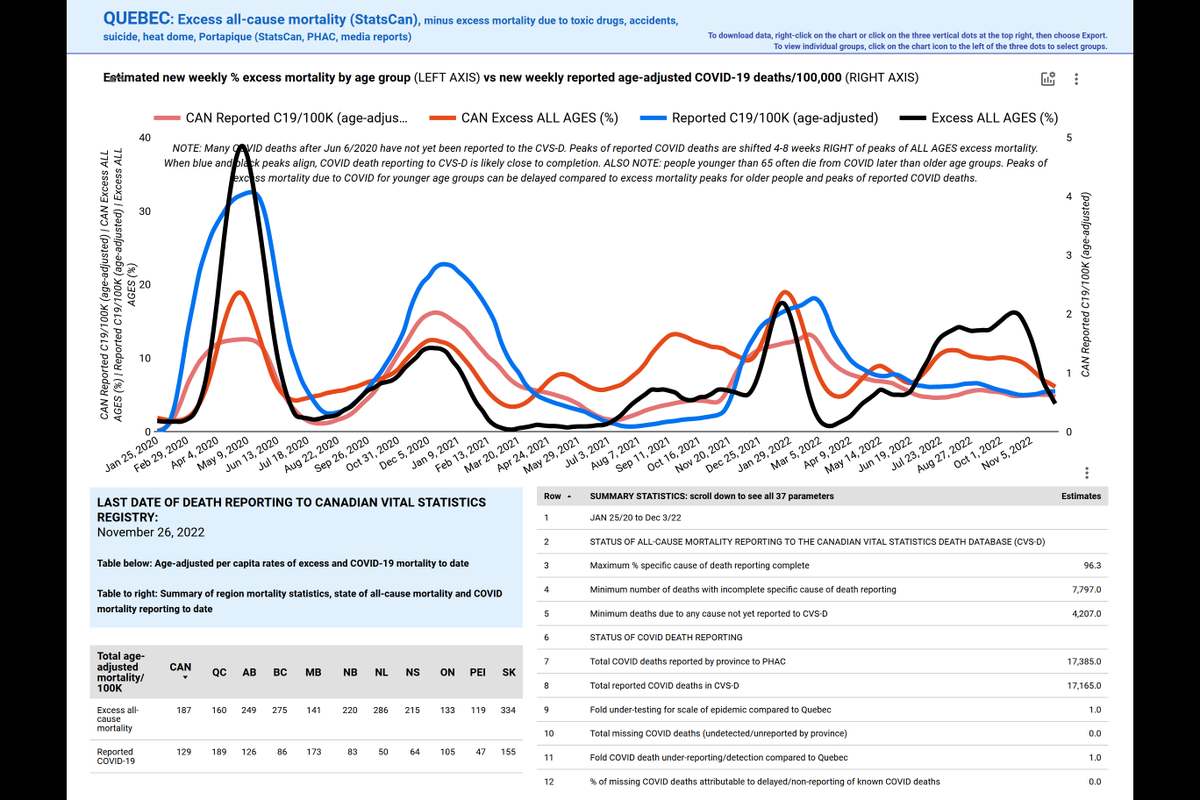
QUEBEC
Jan 25/20-Dec 3/23
Total drug/heat-dome-adjusted excess deaths: 14,691
Total reported COVID deaths: 17,385
Total unexplained excess mortality: 0
Last death reporting date to CVS-D: Nov 25/22
Jan 25/20-Dec 3/23
Total drug/heat-dome-adjusted excess deaths: 14,691
Total reported COVID deaths: 17,385
Total unexplained excess mortality: 0
Last death reporting date to CVS-D: Nov 25/22
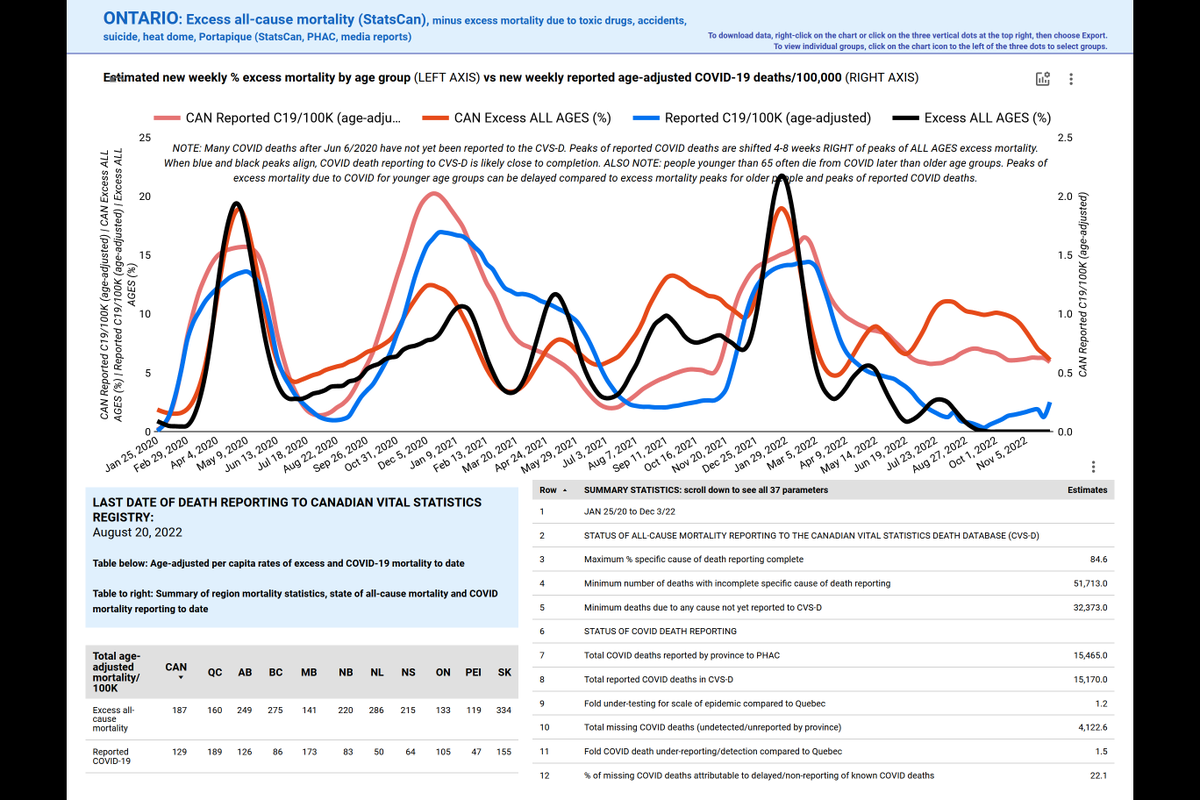
ONTARIO
Jan 25/20-Dec 3/23
Total drug/heat-dome-adjusted excess deaths: 19,588
Total reported COVID deaths: 15,465
Total unexplained excess mortality: 4,123
Last death reporting date to CVS-D: Aug 20/22
Jan 25/20-Dec 3/23
Total drug/heat-dome-adjusted excess deaths: 19,588
Total reported COVID deaths: 15,465
Total unexplained excess mortality: 4,123
Last death reporting date to CVS-D: Aug 20/22
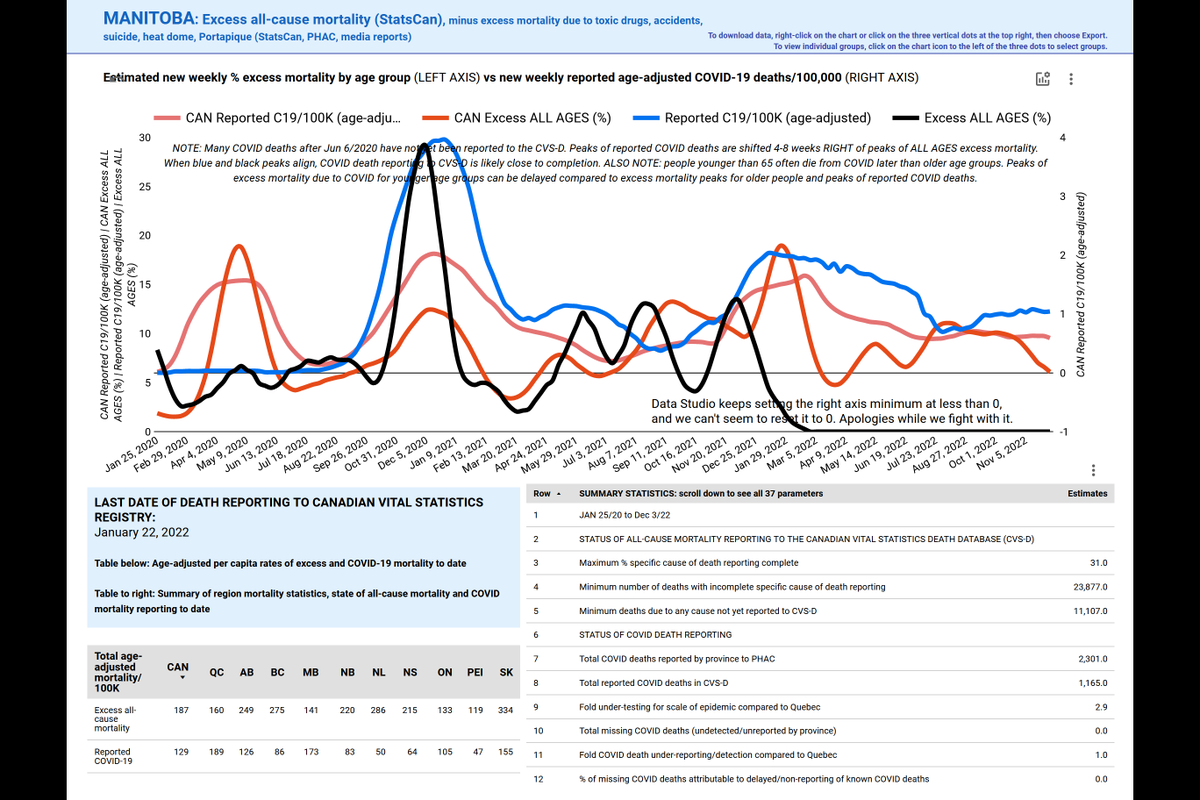
MANITOBA
Jan 25/20-Dec 3/23
Total drug/heat-dome-adjusted excess deaths: 1,882
Total reported COVID deaths: 2,301
Total unexplained excess mortality: 0
Last death reporting date to CVS-D: Jan 22/22
Jan 25/20-Dec 3/23
Total drug/heat-dome-adjusted excess deaths: 1,882
Total reported COVID deaths: 2,301
Total unexplained excess mortality: 0
Last death reporting date to CVS-D: Jan 22/22
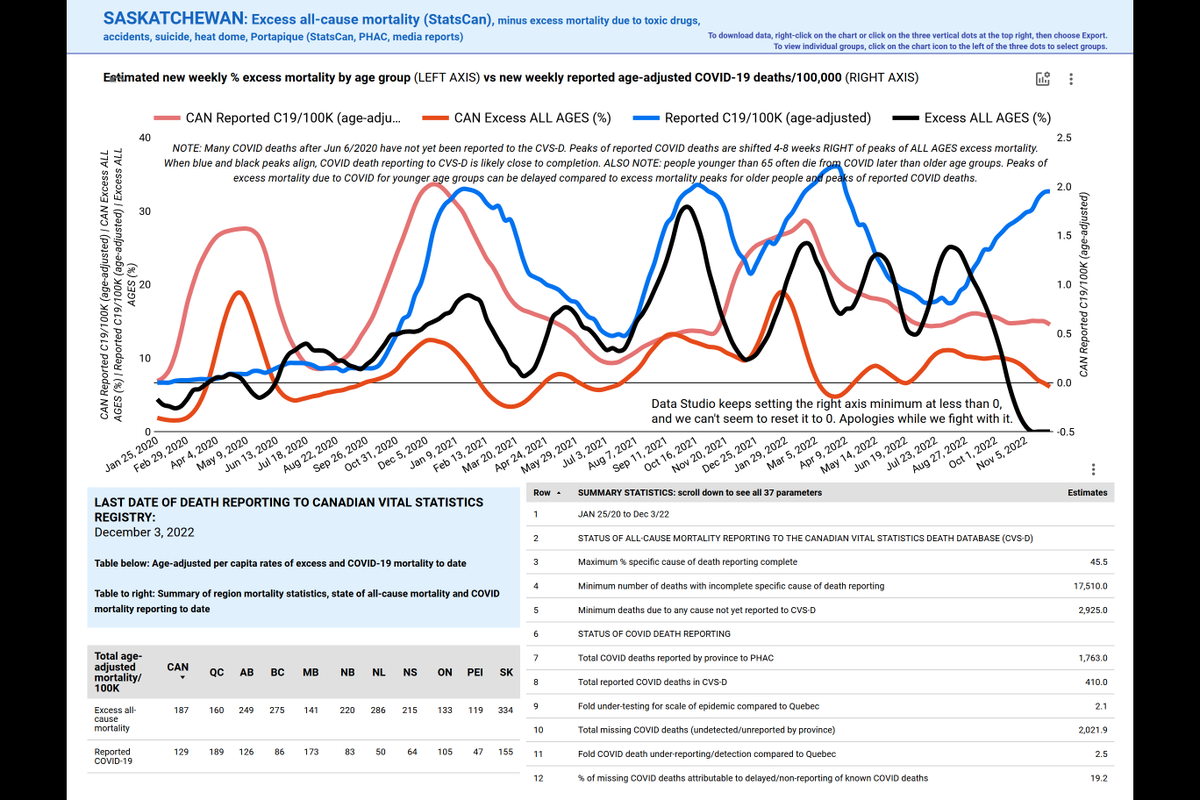
SASKATCHEWAN
Jan 25/20-Dec 3/23
Total drug/heat-dome-adjusted excess deaths: 3,785
Total reported COVID deaths: 1,763
Total unexplained excess mortality: 2,022
Last death reporting date to CVS-D: Dec 3/22
Jan 25/20-Dec 3/23
Total drug/heat-dome-adjusted excess deaths: 3,785
Total reported COVID deaths: 1,763
Total unexplained excess mortality: 2,022
Last death reporting date to CVS-D: Dec 3/22
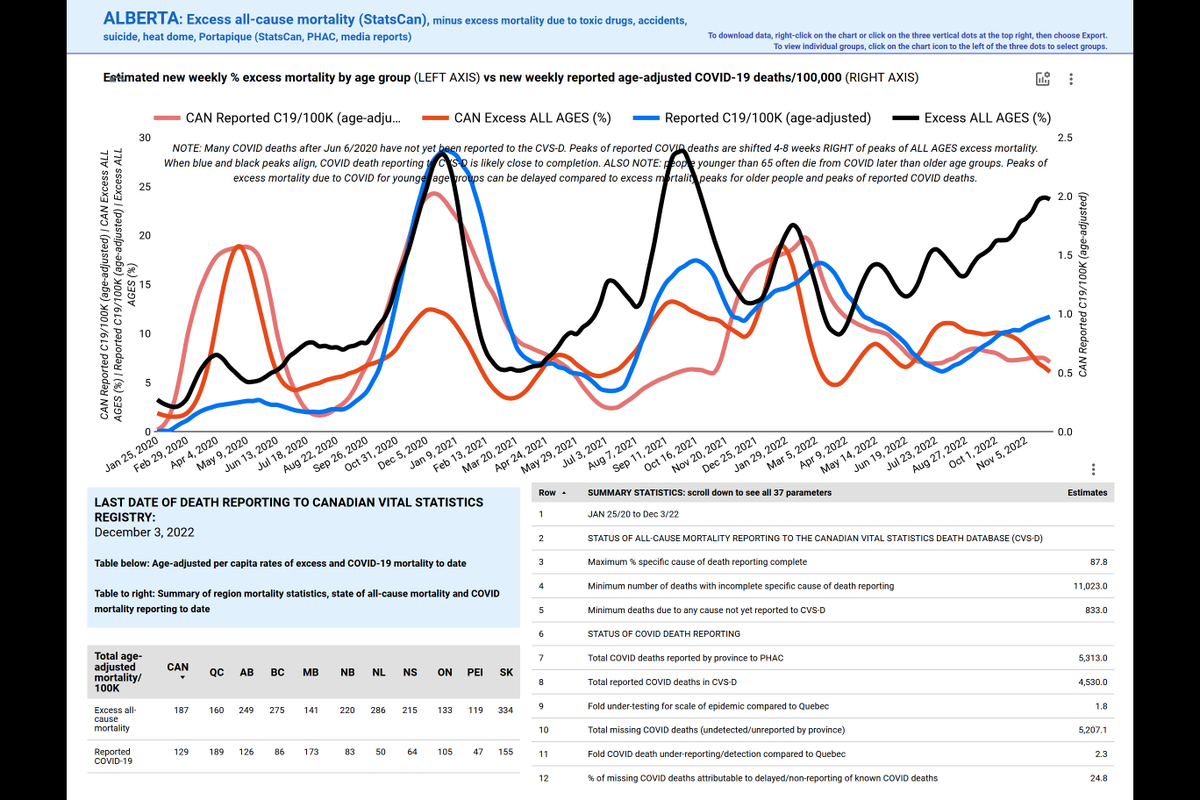
ALBERTA
Jan 25/20-Dec 3/23
Total drug/heat-dome-adjusted excess deaths: 10,520
Total reported COVID deaths: 5,313
Total unexplained excess mortality: 5,207
Last death reporting date to CVS-D: Dec 3/22
Jan 25/20-Dec 3/23
Total drug/heat-dome-adjusted excess deaths: 10,520
Total reported COVID deaths: 5,313
Total unexplained excess mortality: 5,207
Last death reporting date to CVS-D: Dec 3/22
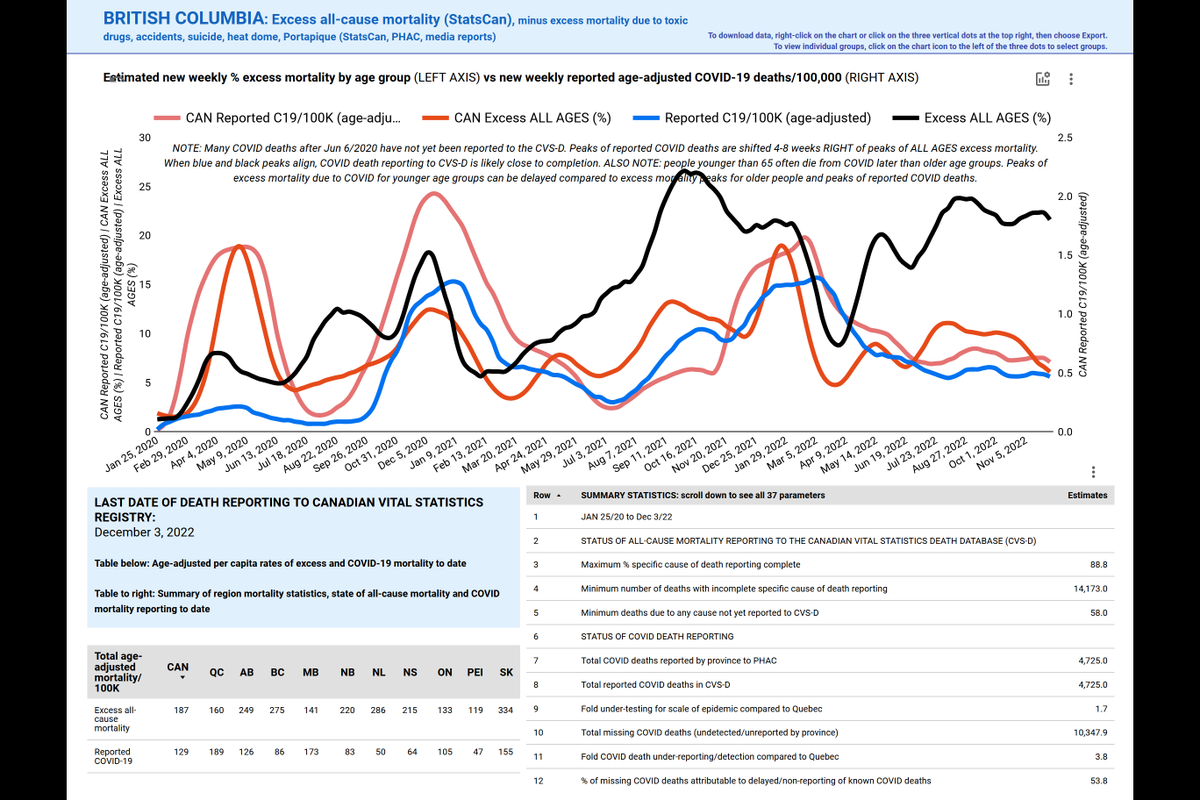
BRITISH COLUMBIA
Jan 25/20-Dec 3/23
Total drug/heat-dome-adjusted excess deaths: 15,073
Total reported COVID deaths: 4,725
Total unexplained excess mortality: 10,348
Last death reporting date to CVS-D: Dec 3/22
Jan 25/20-Dec 3/23
Total drug/heat-dome-adjusted excess deaths: 15,073
Total reported COVID deaths: 4,725
Total unexplained excess mortality: 10,348
Last death reporting date to CVS-D: Dec 3/22
I'm going to take a short break, then come back to try to explain how we're estimating expected Omicron deaths and excess mortality directly attributable to these deaths ("from" Omicron deaths), so that we can estimate how much under-reporting of COVID deaths we're seeing.
Why do we need to do this? Because we need to know how many COVID deaths are going unreported in each province (i.e. how many are expected), if we want to estimate the additional impact of health care system overload on excess mortality.
We have pretty decent approximations of expected total and with vs from expected COVID deaths from Dec 2/21 to Dec 3/22, as well as estimates of how much excess mortality we can still expect to see as reporting trickles in.
There's still more work to do, but hope this helps.
There's still more work to do, but hope this helps.
ok, brief break. BRB.
Alright, here goes my first attempt at explaining our efforts to estimate total excess mortality directly attributable to COVID during the Omicron era.
In the report linked at the top of the thread you can find the accompanying graphs on pp 17-19.
In the report linked at the top of the thread you can find the accompanying graphs on pp 17-19.
First, we start with population infection fatality rates for each province, based on pop age structure, age-specific vax, boost rates, age-specific Omicron IFRs from UK data.
Methods and sources are found at our weekly Canadian COVID data page here: covid19resources.ca/covid-hazard-i…
Methods and sources are found at our weekly Canadian COVID data page here: covid19resources.ca/covid-hazard-i…
Other inputs include excess all-cause mortality in people 45+ pre-Omicron for each province (more deaths pre-Omicron reduces expected popIFR during Omicron, because of "depletion" from population of people susceptible to death from COVID).
For example, expected Omicron PopIFRs for Atlantic provinces were higher than for Alberta, for example, because many fewer people died of COVID pre-Omicron in Atlantic Canada.
We also input the odds ratio for vaccine protection against death published by @GovCanHealth. This has not been available since Sep 15/22, so after that date we're using estimates from UK data.
@GovCanHealth We need to know the age of people who have died each week during Omicron to adjust the estimated popIFR for that week (since it's expected to be lower if mainly younger people are being infected)...this we get from the PHAC dataset in the weekly epi report.
@GovCanHealth The folks at PHAC added a downloadable CSV to their graphs for age-specific death reporting, which has made life much, much, MUCH better for us....thank you :)
@GovCanHealth We could wait for the monthly StatsCan publication of the PHAC dataset, but weekly data are better. Plus, StatsCan excludes deaths of people younger than 40, which is not helpful for our purposes.
@GovCanHealth The weekly popIFR estimates also take into account the number of people who have died (been "depleted" from the population of people susceptible to death).
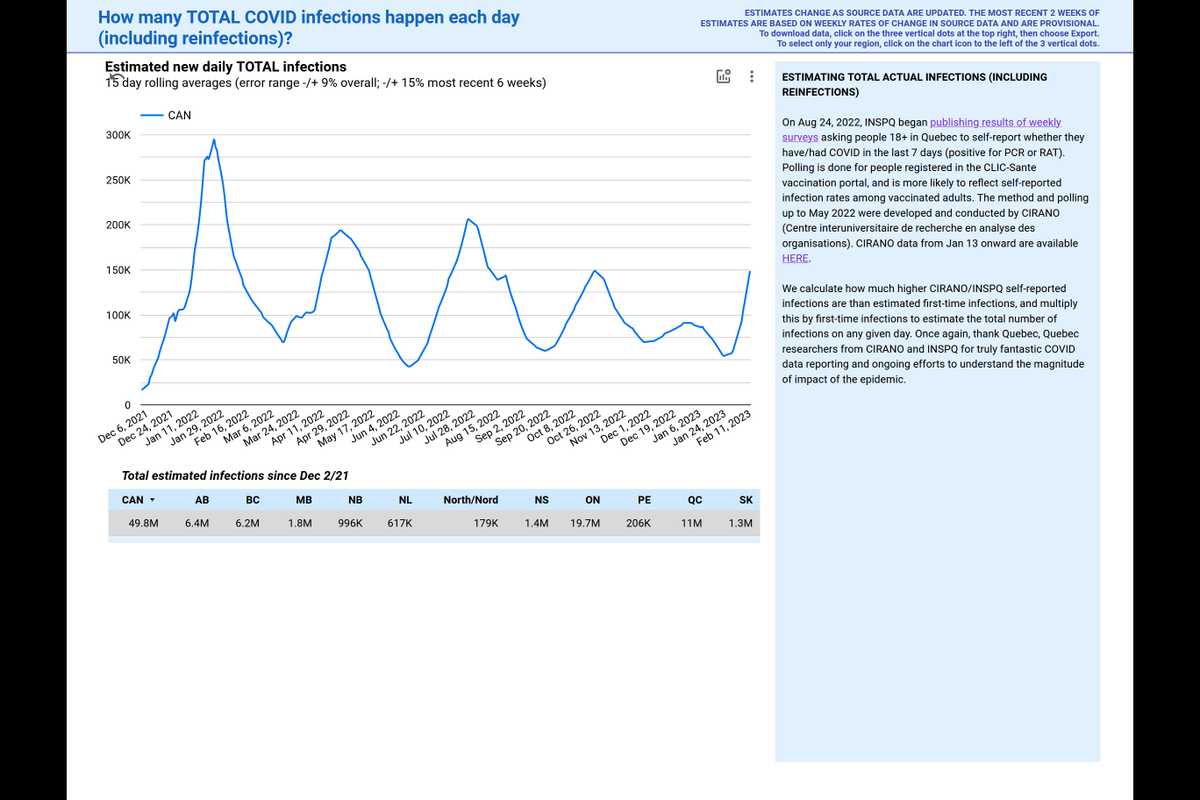
@GovCanHealth Using all of this (and additional info described in the weekly Canadian COVID data report), we can estimate the prevalence of infection in the whole population--the % of people infected on any given day (top graph here--you can select your province in report's interactive graphs)
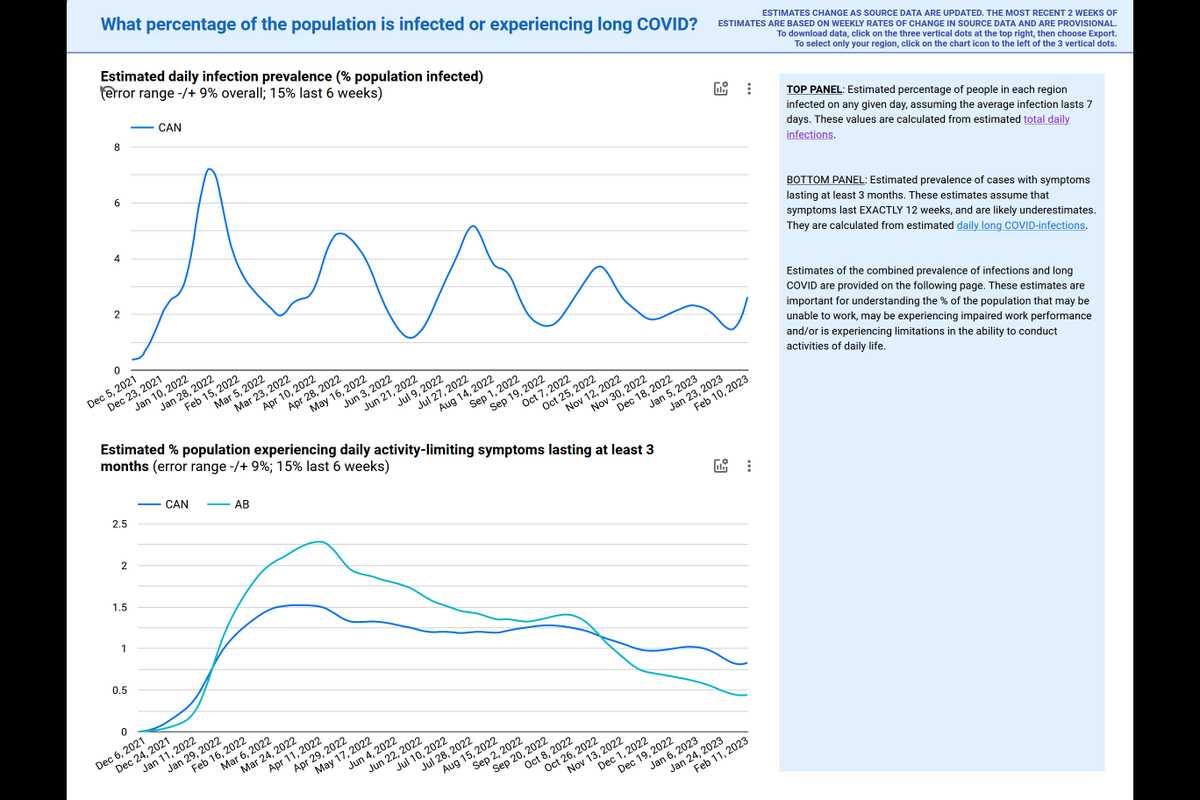
@GovCanHealth These prevalence estimates are anchored in weekly survey data from Quebec which asks people if they've tested positive via RAT or PCR. Once we know this for QC, we can estimate it for other provinces, using a number of different data sources (please see report!).
@GovCanHealth We also estimate first time infections, which are anchored to seroprevalence data published monthly by @COVIDimmunityTF .
The % pop infected prevalence values we get are pretty damn close to prevalence values from the UK, which actually does surveillance testing every week.
The % pop infected prevalence values we get are pretty damn close to prevalence values from the UK, which actually does surveillance testing every week.
@GovCanHealth @COVIDimmunityTF We can use all of this to estimate the number of deaths we'd expect each week in each province, given estimated first time infection numbers and the age of the population infected.
@GovCanHealth @COVIDimmunityTF These estimates where shakier earlier in Omicron, but are pretty firm now that many, many people have been infected and we have a lot of seroprevalence and excess mortality data, not to mention the deaths that weren't reported early on finally trickling in to PHAC and the CVS-D.
@GovCanHealth @COVIDimmunityTF So, we can estimate total expected COVID deaths, using popIFRs for each province, first time infection numbers, age of pop infected etc, but how do we distinguish with vs from COVID deaths?
@GovCanHealth @COVIDimmunityTF This isn't a trivial problem during Omicron, when prevalence of infection in the population on any given day has been so high (~3.0% on average every day since the start of Omicron for Canada--most provinces fairly close to that number overall).
@GovCanHealth @COVIDimmunityTF Let's start using Canada as an example. It's the top left graph in the panel here.
The black line shows the total expected COVID deaths during Omicron to Dec 3/22. Pink line is total reported COVID deaths. Blue line is total excess mortality reported (recall reporting delays...)
The black line shows the total expected COVID deaths during Omicron to Dec 3/22. Pink line is total reported COVID deaths. Blue line is total excess mortality reported (recall reporting delays...)

@GovCanHealth @COVIDimmunityTF In the yellow-ish box overlaid on the Canada graph you can see some summary data where we show the total number of expected COVID deaths.
Total expected COVID deaths for Canada from Dec 2/21 to Dec 3/22: 45,942
Total expected COVID deaths for Canada from Dec 2/21 to Dec 3/22: 45,942

@GovCanHealth @COVIDimmunityTF Using the average infection prevalence during this period (3.1%), and the number of people expected to die from non-COVID causes during this period, we can estimate how many of the expected 46,000 COVID deaths in Canada during this period are incidental (with, not from): 8,891.
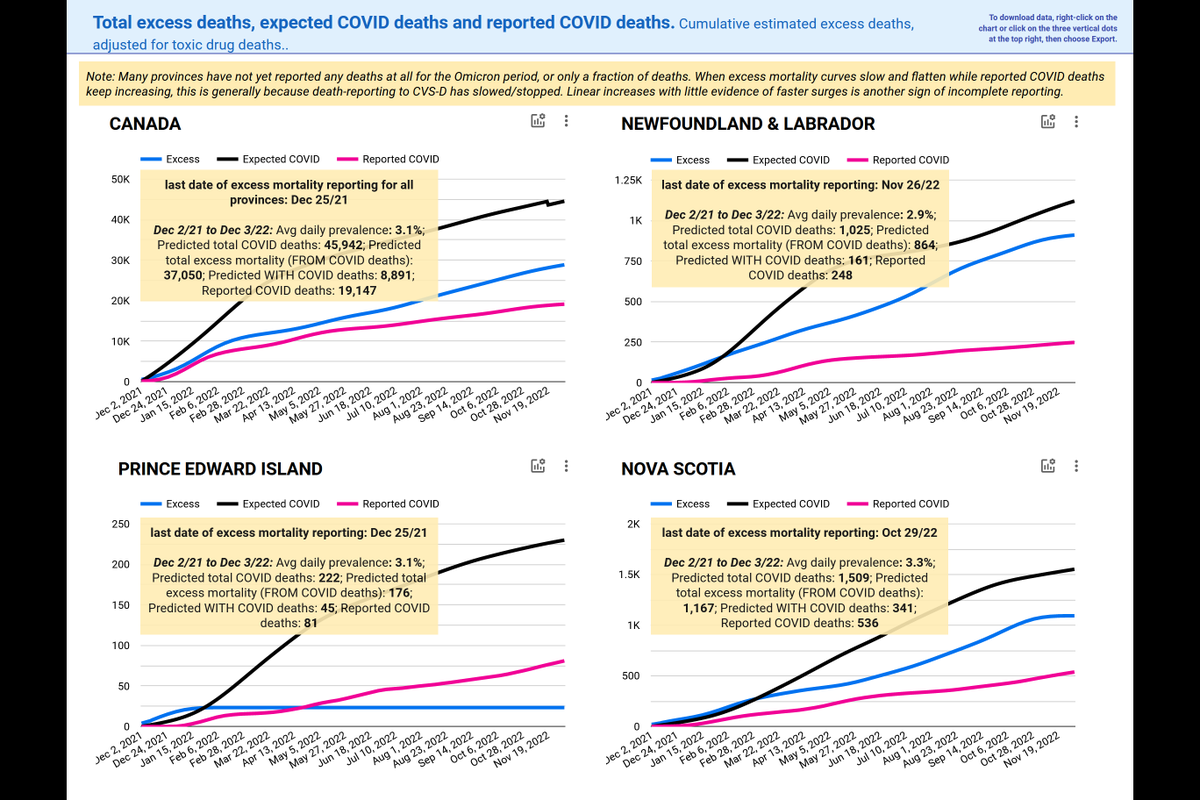
@GovCanHealth @COVIDimmunityTF The difference between total expected COVID deaths and estimated incidental (with not from) COVID deaths is 37,050.
This is the excess mortality we'd expect to be directly caused by COVID.
Canada has reported 19,147 COVID deaths, or about 51% of "from/excess" COVID deaths.
This is the excess mortality we'd expect to be directly caused by COVID.
Canada has reported 19,147 COVID deaths, or about 51% of "from/excess" COVID deaths.
@GovCanHealth @COVIDimmunityTF BTW, about 2-fold under-detection/reporting of COVID deaths for Canada during this period matches up well to the rate of ICU admission under-reporting for April 2021 to March 2022 calculated from ICU admissions reported by @CIHI_ICIS vs ICU admissions reported by provinces
@GovCanHealth @COVIDimmunityTF @CIHI_ICIS Just because ICU admissions have been under-reported by 50% in Canada (a problem dating back to 2020 also BTW) doesn't mean that under-reporting is the only issue for COVID deaths, but it's almost certain it contributes.
@GovCanHealth @COVIDimmunityTF @CIHI_ICIS In fact, we know under-reporting of deaths is an issue as deaths come into the CVS-D and PHAC case dataset that weren't reported publicly by provinces, contemporaneously or in cumulative publicly-reported death totals.
@GovCanHealth @COVIDimmunityTF @CIHI_ICIS But for deaths there's also a fairly large problem that's likely attributable to under-testing and inadequate access to testing outside settings like LTC (if provinces even test routinely in LTC, which many don't). Plus no post-mortem testing if someone dies of probably COVID.
@GovCanHealth @COVIDimmunityTF @CIHI_ICIS Let's go back to the graph I was showing you.
We still have a bunch of work to do for these graphs, because we need to plot curves for expected excess mortality, to make it easier to understand.
We still have a bunch of work to do for these graphs, because we need to plot curves for expected excess mortality, to make it easier to understand.

@GovCanHealth @COVIDimmunityTF @CIHI_ICIS For example, during really big waves when weekly infection prevalence is very high (~7% at peak of BA.1 wave, ~5% at height of BA.2 and summer BA.5 waves) there can be a lot of incidental (with not from) COVID deaths, especially at the peaks.

@GovCanHealth @COVIDimmunityTF @CIHI_ICIS The difference between the black curve and the blue excess mortality curve is the incidental with not from deaths.
But, all-cause mortality reporting in Canada is incredibly slow, and we have a lot of outstanding death reporting for the Omicron period, in every province.
But, all-cause mortality reporting in Canada is incredibly slow, and we have a lot of outstanding death reporting for the Omicron period, in every province.

@GovCanHealth @COVIDimmunityTF @CIHI_ICIS So, we need to plot an expected excess mortality curve to guesstimate what COVID excess mortality will look like once all-cause mortality reporting is complete.
Now, it's on my list of things to do, but with grant and paper writing I'm a little behind!
Now, it's on my list of things to do, but with grant and paper writing I'm a little behind!
@GovCanHealth @COVIDimmunityTF @CIHI_ICIS But, in the short term we're providing those yellow-ish overlaid text boxes to show you the total estimates for the period in question.
@GovCanHealth @COVIDimmunityTF @CIHI_ICIS One day, god willing, the graphs will include expected COVID excess mortality curves, and once we have those, we can start estimating excess mortality attributable to other causes, like healthcare system overload.
@GovCanHealth @COVIDimmunityTF @CIHI_ICIS If/when observed (reported) excess mortality exceeds expected COVID-attributable excess mortality curves, then we can estimate the mortality impact of healthcare system overload.
But all-cause mortality reporting for every single Canadian province is too far behind to do this.
But all-cause mortality reporting for every single Canadian province is too far behind to do this.
@GovCanHealth @COVIDimmunityTF @CIHI_ICIS Another thing to add to the data wishlist....
As those of you who have followed Canadian influenza morbidity/mortality reporting for years will know, provinces are ridiculously uncooperative in reporting flu outcomes to PHAC.
As those of you who have followed Canadian influenza morbidity/mortality reporting for years will know, provinces are ridiculously uncooperative in reporting flu outcomes to PHAC.
@GovCanHealth @COVIDimmunityTF @CIHI_ICIS PHAC uses sentinel sites/reporting networks to estimate flu impact. It's not bad--they make it work, god love them, but it is NOT as good as if every bloody province simply flipping reported age-specific flu hospitalizations, ICU admissions, deaths to PHAC quickly and completely.
@GovCanHealth @COVIDimmunityTF @CIHI_ICIS Why does adequate flu reporting matter so much right now?
Because on Thanksgiving weekend, for the first time during Omicron, Quebec's excess all-cause mortality passed reported COVID deaths (top right panel).
Because on Thanksgiving weekend, for the first time during Omicron, Quebec's excess all-cause mortality passed reported COVID deaths (top right panel).

@GovCanHealth @COVIDimmunityTF @CIHI_ICIS We estimate that about a third of Quebec's Omicron deaths have been missed. That number hovered around 10-15% for much of Omicron, but has really jumped lately, and we're not sure if this reflects a change in testing/reporting in the province (which is heart-breaking).
@GovCanHealth @COVIDimmunityTF @CIHI_ICIS QC does look like it's still reporting all/most "from" COVID deaths pretty fully, and it takes a while for dates of death to be corrected in the province's dataset.
So, we don't know yet if from COVID deaths are missing. And reported deaths might catch up to excess mortality.
So, we don't know yet if from COVID deaths are missing. And reported deaths might catch up to excess mortality.
@GovCanHealth @COVIDimmunityTF @CIHI_ICIS But....there is substantial reason to be concerned that QC excess mortality passing reported COVID deaths is an effect of the intense early flu season (maybe also an increase in toxic drug deaths--which have become a bigger problem in QC in the last 6ish months).
@GovCanHealth @COVIDimmunityTF @CIHI_ICIS All of this is to say that bloody provinces need to bloody start reporting ALL their hospitalizations, ICU admissions and deaths attributed to COVID, flu and toxic drug deaths nationally...within a month of the death, as is the norm in many high income countries.
@GovCanHealth @COVIDimmunityTF @CIHI_ICIS We have no f'ing idea why so many people in this lugubriously bureaucratic country are dying because our reporting is so ponderously slow and rife with pissing contests and non-cooperation.
Get the f over yourselves and start reporting nationally now. People's live matter.
Get the f over yourselves and start reporting nationally now. People's live matter.
@GovCanHealth @COVIDimmunityTF @CIHI_ICIS And stop the paternalistic/image-managing massage of data. Just f'ing tell people what is happening. We're adults. Yes, people will be (rightfully) pissed off that you kept so much information from the general public.
@GovCanHealth @COVIDimmunityTF @CIHI_ICIS But look around you. Do you think the reaction will last more than a month? People will forget--they're numb to all of this now.
@GovCanHealth @COVIDimmunityTF @CIHI_ICIS What matters is that you quickly and fully disclose info so that policy makers have actual national data to start developing responses that have a hope of being effective.
@GovCanHealth @COVIDimmunityTF @CIHI_ICIS What matters more? Harm reduction and preventing at least some of these untimely, EXCESS deaths? Or reputation management?
At some point, you personally have to stop going with the flow. I know you're tired, and the systems have subsumed individual efforts again.
At some point, you personally have to stop going with the flow. I know you're tired, and the systems have subsumed individual efforts again.
@GovCanHealth @COVIDimmunityTF @CIHI_ICIS But your actions and your voice matter, and the numbers all do eventually come out. It's better to know that you're genuinely pushing back on culture from within to try to save lives, and for others around you to see that.
@GovCanHealth @COVIDimmunityTF @CIHI_ICIS I'd bet others keeping to themselves are thinking the same and may start speaking and/or pushing back (again? quietly?) if they see you do it.
It's incredibly hard within a professional culture--I know--oodles of judgement and dismissing.
But those lives matter. And you care.
It's incredibly hard within a professional culture--I know--oodles of judgement and dismissing.
But those lives matter. And you care.
@GovCanHealth @COVIDimmunityTF @CIHI_ICIS Not only do those lives matter and do you care about it, but your voice matters. It especially matters for those whose voices go unheard.
From @CIHI_ICIS data we know that the majority of severe outcomes are still happening in the lowest income quintile neighbourhoods.
From @CIHI_ICIS data we know that the majority of severe outcomes are still happening in the lowest income quintile neighbourhoods.
@GovCanHealth @COVIDimmunityTF @CIHI_ICIS We know from @StatCan_eng and ON Science Table reports that this is where the majority of deaths have happened too.
Per cap death reported rates for First Nations are higher than the national average, despite much MUCH younger demographics.
Per cap death reported rates for First Nations are higher than the national average, despite much MUCH younger demographics.

@GovCanHealth @COVIDimmunityTF @CIHI_ICIS @StatCan_eng You know all this, and how people who are racialized and/or who live with disabilities have been disproportionately affected. Infected more. Hospitalized more. Dying more.
@GovCanHealth @COVIDimmunityTF @CIHI_ICIS @StatCan_eng This fall we were at nearly 20% excess mortality in the fastest-reporting provinces, even though even their death reporting is still really incomplete.

@GovCanHealth @COVIDimmunityTF @CIHI_ICIS @StatCan_eng The week of Feb 5, the number of people reporting positive RAT or PCR tests in Quebec's weekly survey increased by 64% compared to the week before.
Here's the current estimate of total infections for Canada--that curve may slow, but it's not looking good right now.
Here's the current estimate of total infections for Canada--that curve may slow, but it's not looking good right now.
@GovCanHealth @COVIDimmunityTF @CIHI_ICIS @StatCan_eng Waste water and test positivity rate reporting is 2 weeks behind--the info we have from these is already 2 weeks late.
From the Feb 2 @UKHSA report it's clear protection against all severe COVID outcomes is declining at a similar rate after 4th dose as it did for previous doses.
From the Feb 2 @UKHSA report it's clear protection against all severe COVID outcomes is declining at a similar rate after 4th dose as it did for previous doses.
@GovCanHealth @COVIDimmunityTF @CIHI_ICIS @StatCan_eng @UKHSA The U.S. had a pretty serious XBB.1.5 wave of hospitalizations. That was nearly 2 months ago, when their fall boosters were fresher than they now are in Canada (although yes, I know they started booster rollout sooner).
There's a confluence of warning signs that we need to act.
There's a confluence of warning signs that we need to act.
@GovCanHealth @COVIDimmunityTF @CIHI_ICIS @StatCan_eng @UKHSA Many of you who can push internally (if not externally--I know the challenges with that right now) are colleagues and friends. I know you and who you are and what you care about. I know this can't be sitting well with you, and that you're worried too.
@GovCanHealth @COVIDimmunityTF @CIHI_ICIS @StatCan_eng @UKHSA And I know it's easy for an academic with tenure to say these things publicly--much easier than for you.
But you do matter, and your voice internally can contribute to critical mass, and to empowering others to speak up who feel the same.
But you do matter, and your voice internally can contribute to critical mass, and to empowering others to speak up who feel the same.
@GovCanHealth @COVIDimmunityTF @CIHI_ICIS @StatCan_eng @UKHSA So, apparently having spent far too much of my Friday afternoon on this thread instead of flipping working on the runway of papers and grants, here now are estimates for total expected Omicron deaths and excess mortality for each province.
@GovCanHealth @COVIDimmunityTF @CIHI_ICIS @StatCan_eng @UKHSA Sigh. Sorry about the rant. I compartmentalize, but if I'm looking at a lot of data types and they're all flashing warnings, then I start getting really worried. And then I get angry. And then I say things here. Hoping that something clicks for someone quietly reading.
@GovCanHealth @COVIDimmunityTF @CIHI_ICIS @StatCan_eng @UKHSA CANADA
Dec 2/21 to Dec 3/22
🔵Estimated total COVID deaths: 45,942
🔵Estimated total "from" COVID deaths (excess mortality): 37,050
🔵Estimated total "with" COVID deaths (incidental): 8,891
🔵Reported COVID deaths: 19,147
Error range of estimates: -/+16%
Dec 2/21 to Dec 3/22
🔵Estimated total COVID deaths: 45,942
🔵Estimated total "from" COVID deaths (excess mortality): 37,050
🔵Estimated total "with" COVID deaths (incidental): 8,891
🔵Reported COVID deaths: 19,147
Error range of estimates: -/+16%

@GovCanHealth @COVIDimmunityTF @CIHI_ICIS @StatCan_eng @UKHSA NEWFOUNDLAND AND LABRADOR
Dec 2/21 to Dec 3/22
🔵Estimated total COVID deaths: 1,025
🔵Estimated total "from" COVID deaths (excess mortality): 864
🔵Estimated total "with" COVID deaths (incidental): 161
🔵Reported COVID deaths: 248
Error range of estimates: -/+16%
Dec 2/21 to Dec 3/22
🔵Estimated total COVID deaths: 1,025
🔵Estimated total "from" COVID deaths (excess mortality): 864
🔵Estimated total "with" COVID deaths (incidental): 161
🔵Reported COVID deaths: 248
Error range of estimates: -/+16%

@GovCanHealth @COVIDimmunityTF @CIHI_ICIS @StatCan_eng @UKHSA PRINCE EDWARD ISLAND
Dec 2/21 to Dec 3/22
🔵Estimated total COVID deaths: 222
🔵Estimated total "from" COVID deaths (excess mortality): 176
🔵Estimated total "with" COVID deaths (incidental): 45
🔵Reported COVID deaths: 81
Error range of estimates: -/+16%
Dec 2/21 to Dec 3/22
🔵Estimated total COVID deaths: 222
🔵Estimated total "from" COVID deaths (excess mortality): 176
🔵Estimated total "with" COVID deaths (incidental): 45
🔵Reported COVID deaths: 81
Error range of estimates: -/+16%

NOVA SCOTIA
Dec 2/21 to Dec 3/22
🔵Estimated total COVID deaths: 1,509
🔵Estimated total "from" COVID deaths (excess mortality): 1,167
🔵Estimated total "with" COVID deaths (incidental): 341
🔵Reported COVID deaths: 536
Error range of estimates: -/+16%
Dec 2/21 to Dec 3/22
🔵Estimated total COVID deaths: 1,509
🔵Estimated total "from" COVID deaths (excess mortality): 1,167
🔵Estimated total "with" COVID deaths (incidental): 341
🔵Reported COVID deaths: 536
Error range of estimates: -/+16%

NEW BRUNSWICK
Dec 2/21 to Dec 3/22
🔵Estimated total COVID deaths: 1,780
🔵Estimated total "from" COVID deaths (excess mortality): 1,531
🔵Estimated total "with" COVID deaths (incidental): 239
🔵Reported COVID deaths: 535
Error range of estimates: -/+16%
Dec 2/21 to Dec 3/22
🔵Estimated total COVID deaths: 1,780
🔵Estimated total "from" COVID deaths (excess mortality): 1,531
🔵Estimated total "with" COVID deaths (incidental): 239
🔵Reported COVID deaths: 535
Error range of estimates: -/+16%

QUEBEC
Dec 2/21 to Dec 3/22
🔵Estimated total COVID deaths: 8,703
🔵Estimated total "from" COVID deaths (excess mortality): 6,621
🔵Estimated total "with" COVID deaths (incidental): 2,082
🔵Reported COVID deaths: 5,770
Error range of estimates: -/+16%
Dec 2/21 to Dec 3/22
🔵Estimated total COVID deaths: 8,703
🔵Estimated total "from" COVID deaths (excess mortality): 6,621
🔵Estimated total "with" COVID deaths (incidental): 2,082
🔵Reported COVID deaths: 5,770
Error range of estimates: -/+16%

ONTARIO
Dec 2/21 to Dec 3/22
🔵Estimated total COVID deaths: 13,972
🔵Estimated total "from" COVID deaths (excess mortality): 10,623
🔵Estimated total "with" COVID deaths (incidental): 3,349
🔵Reported COVID deaths: 4,729
Error range of estimates: -/+16%
Dec 2/21 to Dec 3/22
🔵Estimated total COVID deaths: 13,972
🔵Estimated total "from" COVID deaths (excess mortality): 10,623
🔵Estimated total "with" COVID deaths (incidental): 3,349
🔵Reported COVID deaths: 4,729
Error range of estimates: -/+16%
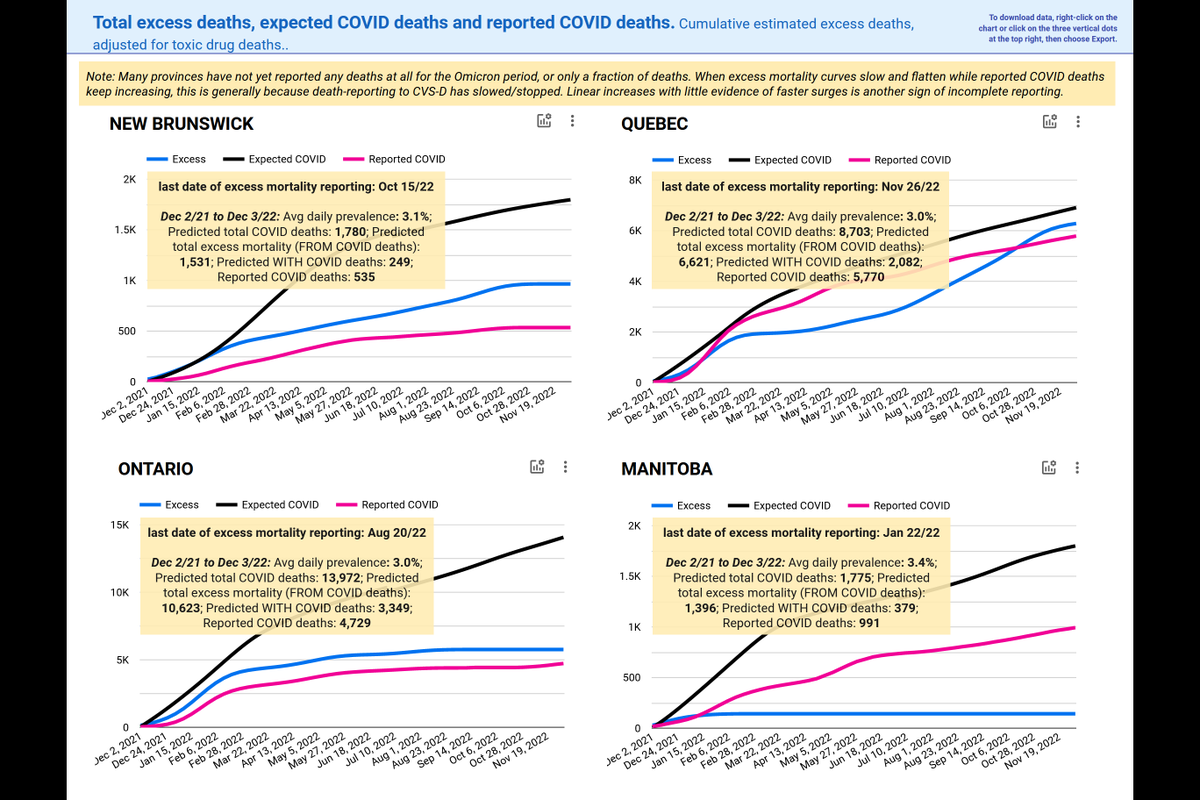
MANITOBA
Dec 2/21 to Dec 3/22
🔵Estimated total COVID deaths: 1,775
🔵Estimated total "from" COVID deaths (excess mortality): 1,396
🔵Estimated total "with" COVID deaths (incidental): 379
🔵Reported COVID deaths: 991
Error range of estimates: -/+16%
Dec 2/21 to Dec 3/22
🔵Estimated total COVID deaths: 1,775
🔵Estimated total "from" COVID deaths (excess mortality): 1,396
🔵Estimated total "with" COVID deaths (incidental): 379
🔵Reported COVID deaths: 991
Error range of estimates: -/+16%

SASKATCHEWAN
Dec 2/21 to Dec 3/22
🔵Estimated total COVID deaths: 2,455
🔵Estimated total "from" COVID deaths (excess mortality): 2,194
🔵Estimated total "with" COVID deaths (incidental): 262
🔵Reported COVID deaths: 845
Error range of estimates: -/+16%
Dec 2/21 to Dec 3/22
🔵Estimated total COVID deaths: 2,455
🔵Estimated total "from" COVID deaths (excess mortality): 2,194
🔵Estimated total "with" COVID deaths (incidental): 262
🔵Reported COVID deaths: 845
Error range of estimates: -/+16%
Sorry. For some reason, when I try to upload the SK screenshot my Twitter keeps freezing.
There's probably something to learn from that, maybe about SK? It's breaking the Matrix?
There's probably something to learn from that, maybe about SK? It's breaking the Matrix?
Here's an attempt to load the SK screenshot again

Phew. 18th try's a charm, I guess.
ALBERTA
Dec 2/21 to Dec 3/22
🔵Estimated total COVID deaths: 6,006
🔵Estimated total "from" COVID deaths (excess mortality): 5,083
🔵Estimated total "with" COVID deaths (incidental): 982
🔵Reported COVID deaths: 2,068
Error range of estimates: -/+16%
Dec 2/21 to Dec 3/22
🔵Estimated total COVID deaths: 6,006
🔵Estimated total "from" COVID deaths (excess mortality): 5,083
🔵Estimated total "with" COVID deaths (incidental): 982
🔵Reported COVID deaths: 2,068
Error range of estimates: -/+16%
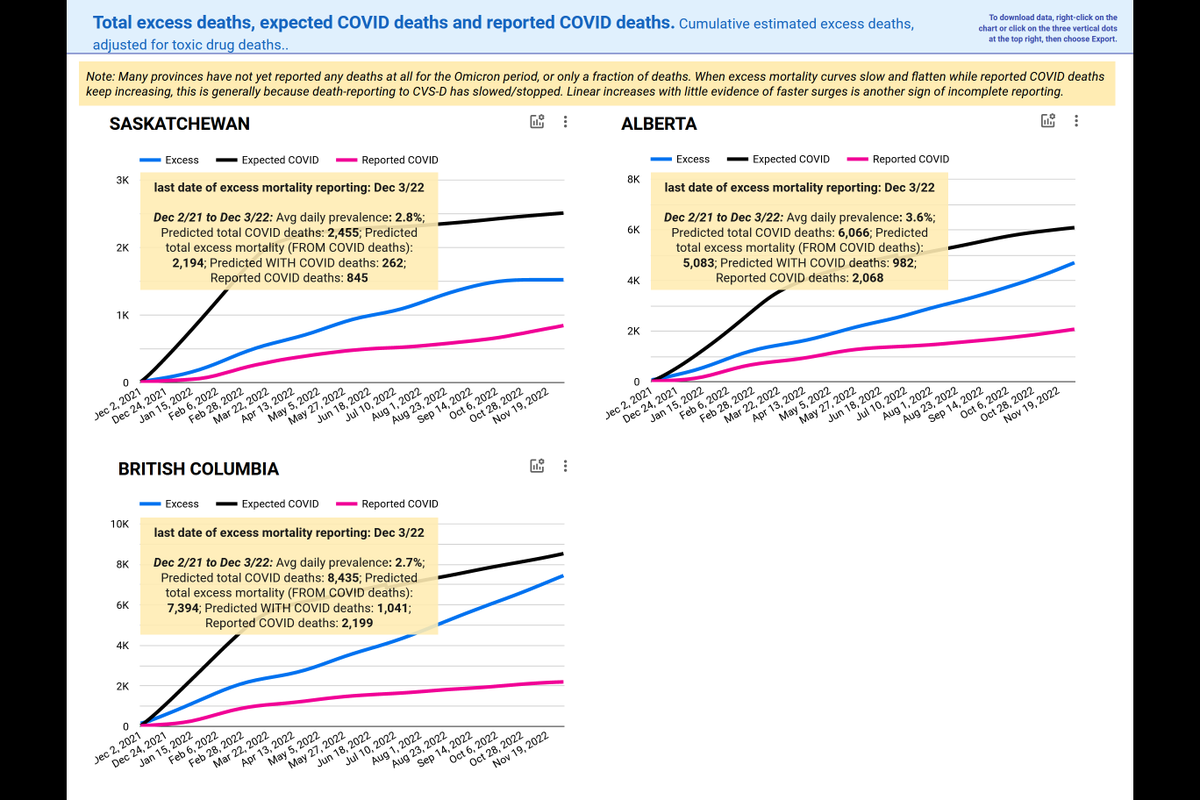
BRITISH COLUMBIA
Dec 2/21 to Dec 3/22
🔵Estimated total COVID deaths: 8,435
🔵Estimated total "from" COVID deaths (excess mortality): 7,394
🔵Estimated total "with" COVID deaths (incidental): 1,041
🔵Reported COVID deaths: 2,199
Error range of estimates: -/+16%
Dec 2/21 to Dec 3/22
🔵Estimated total COVID deaths: 8,435
🔵Estimated total "from" COVID deaths (excess mortality): 7,394
🔵Estimated total "with" COVID deaths (incidental): 1,041
🔵Reported COVID deaths: 2,199
Error range of estimates: -/+16%
Couldn't share the image for BC either, but it's the same one shown for AB and SK.
For those from Nunavut, Northwest Territories and Yukon, there are no excess mortality estimates for the pandemic yet. With very small death numbers and slow reporting, StatsCan can't do them until almost all data come in. Sorry....
Time for me to go do other things I should have been doing instead of tweeting.
But the excess mortality data are so concerning, and I can't seem to explain well enough why it's a problem. So, decided to take another crack at it again today, in the hopes that I'm finally clear.
But the excess mortality data are so concerning, and I can't seem to explain well enough why it's a problem. So, decided to take another crack at it again today, in the hopes that I'm finally clear.
@threadreaderapp unroll
• • •
Missing some Tweet in this thread? You can try to
force a refresh