The Feb 12-18 Canadian COVID Forecast and associated data are now live.
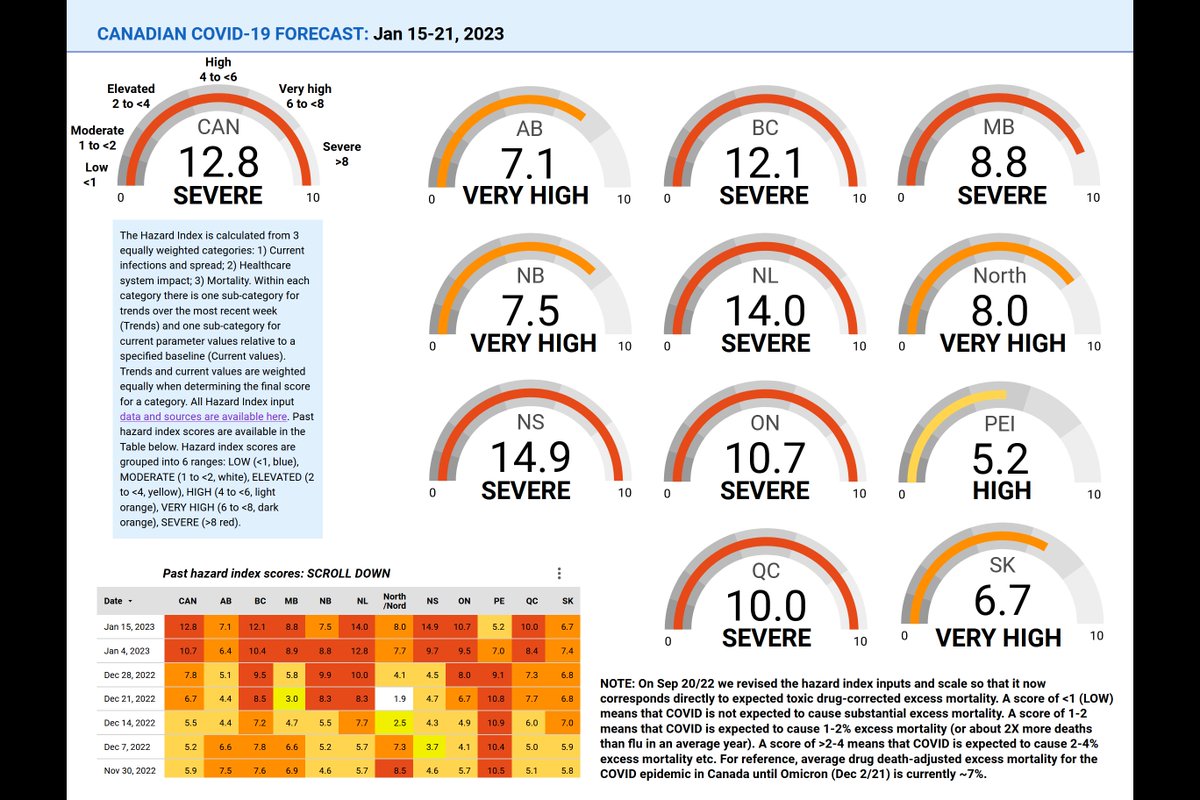
SEVERE: NS
VERY HIGH: CAN, BC, NB, ON, SK
HIGH: MB, NL, North, PEI
ELEVATED: AB, QC
About 1 in 47 people in Canada are CURRENTLY infected, with surge expected over next 1-2 weeks.
SEVERE: NS
VERY HIGH: CAN, BC, NB, ON, SK
HIGH: MB, NL, North, PEI
ELEVATED: AB, QC
About 1 in 47 people in Canada are CURRENTLY infected, with surge expected over next 1-2 weeks.

Here's the link where you can download png and jpeg versions of all graphics:
drive.google.com/drive/folders/…
drive.google.com/drive/folders/…
Recommendations this week are still cautious, even for regions where the forecast is currently ELEVATED or HIGH.
Why? Because @INSPQ survey of RAT/PCR+ people for week of Feb 5 found 69% increase compared to week before. It's often the first indicator to go up at start of surges
Why? Because @INSPQ survey of RAT/PCR+ people for week of Feb 5 found 69% increase compared to week before. It's often the first indicator to go up at start of surges
@INSPQ Data for other indicators that go into our forecast, such as test positivity rates, waste water are roughly 2 weeks behind the forecast date.
We're not seeing forecast scores shoot up yet, although curves are slowing/bending back up for multiple regions.
So, caution advised.
We're not seeing forecast scores shoot up yet, although curves are slowing/bending back up for multiple regions.
So, caution advised.
Canadian COVID Forecast Feb 12-18, 2023
CANADA
VERY HIGH
About 1 in every 47 people is infected.
HOW TO HELP:
Mask, get your booster, avoid non-essential indoor public places, social gatherings.
Higher risk: also avoid outdoor social gatherings.
CANADA
VERY HIGH
About 1 in every 47 people is infected.
HOW TO HELP:
Mask, get your booster, avoid non-essential indoor public places, social gatherings.
Higher risk: also avoid outdoor social gatherings.

Canadian COVID Forecast Feb 12-18, 2023
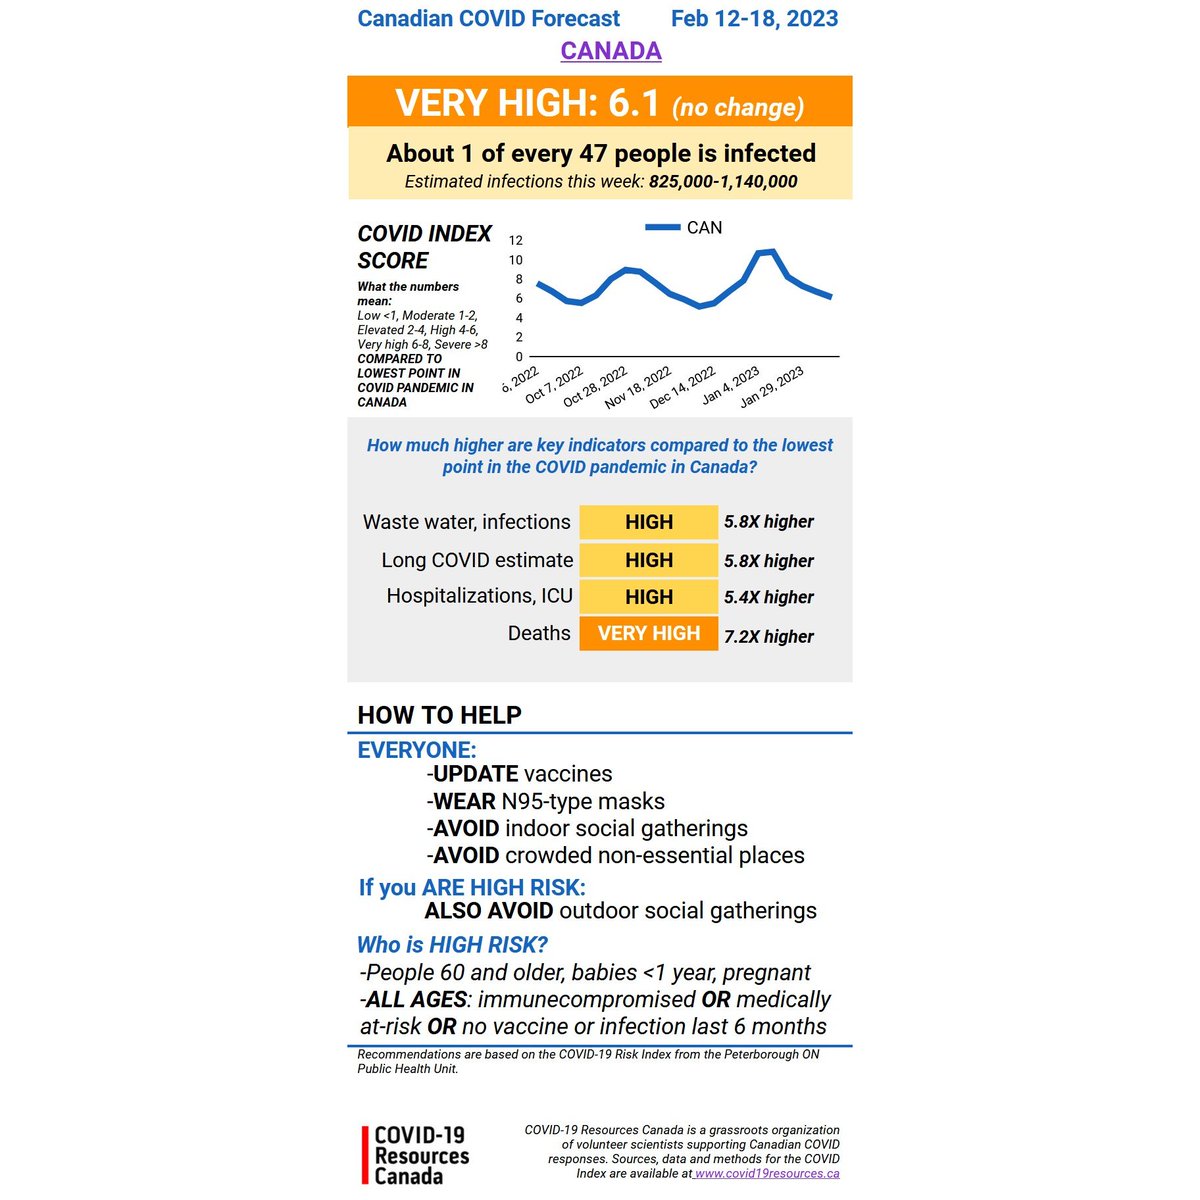
CANADA
VERY HIGH
About 1 in every 47 people infected
Compared to lowest point of pandemic in Canada:
🟡Waste water, infections, long COVID cases ~6X higher
🟡Hospitalizations ~5X higher
🟡Deaths ~7X higher
CANADA
VERY HIGH
About 1 in every 47 people infected
Compared to lowest point of pandemic in Canada:
🟡Waste water, infections, long COVID cases ~6X higher
🟡Hospitalizations ~5X higher
🟡Deaths ~7X higher

From @CDCgov :
About 1 in 5 adults have a health condition that might be related to their previous COVID-19 illness.
The best way to protect from long-lasting COVID symptoms is not getting COVID, and/or not getting it again.
About 1 in 5 adults have a health condition that might be related to their previous COVID-19 illness.
The best way to protect from long-lasting COVID symptoms is not getting COVID, and/or not getting it again.

Canadian COVID Forecast Feb 12-18, 2023
NEWFOUNDLAND AND LABRADOR
HIGH
About 1 in every 97 people is infected.
HOW TO HELP:
Mask, get your booster, avoid non-essential indoor public places, social gatherings.
Higher risk: also avoid outdoor social gatherings.
NEWFOUNDLAND AND LABRADOR
HIGH
About 1 in every 97 people is infected.
HOW TO HELP:
Mask, get your booster, avoid non-essential indoor public places, social gatherings.
Higher risk: also avoid outdoor social gatherings.

Canadian COVID Forecast Feb 12-18, 2023
NEWFOUNDLAND AND LABRADOR
HIGH
About 1 in every 97 people infected
Compared to lowest point of pandemic in Canada:
🟡Waste water, infections, long COVID cases ~2X higher
🟡Hospitalizations ~9X higher
🟡Deaths ~3X higher
NEWFOUNDLAND AND LABRADOR
HIGH
About 1 in every 97 people infected
Compared to lowest point of pandemic in Canada:
🟡Waste water, infections, long COVID cases ~2X higher
🟡Hospitalizations ~9X higher
🟡Deaths ~3X higher

Canadian COVID Forecast Feb 12-18, 2023
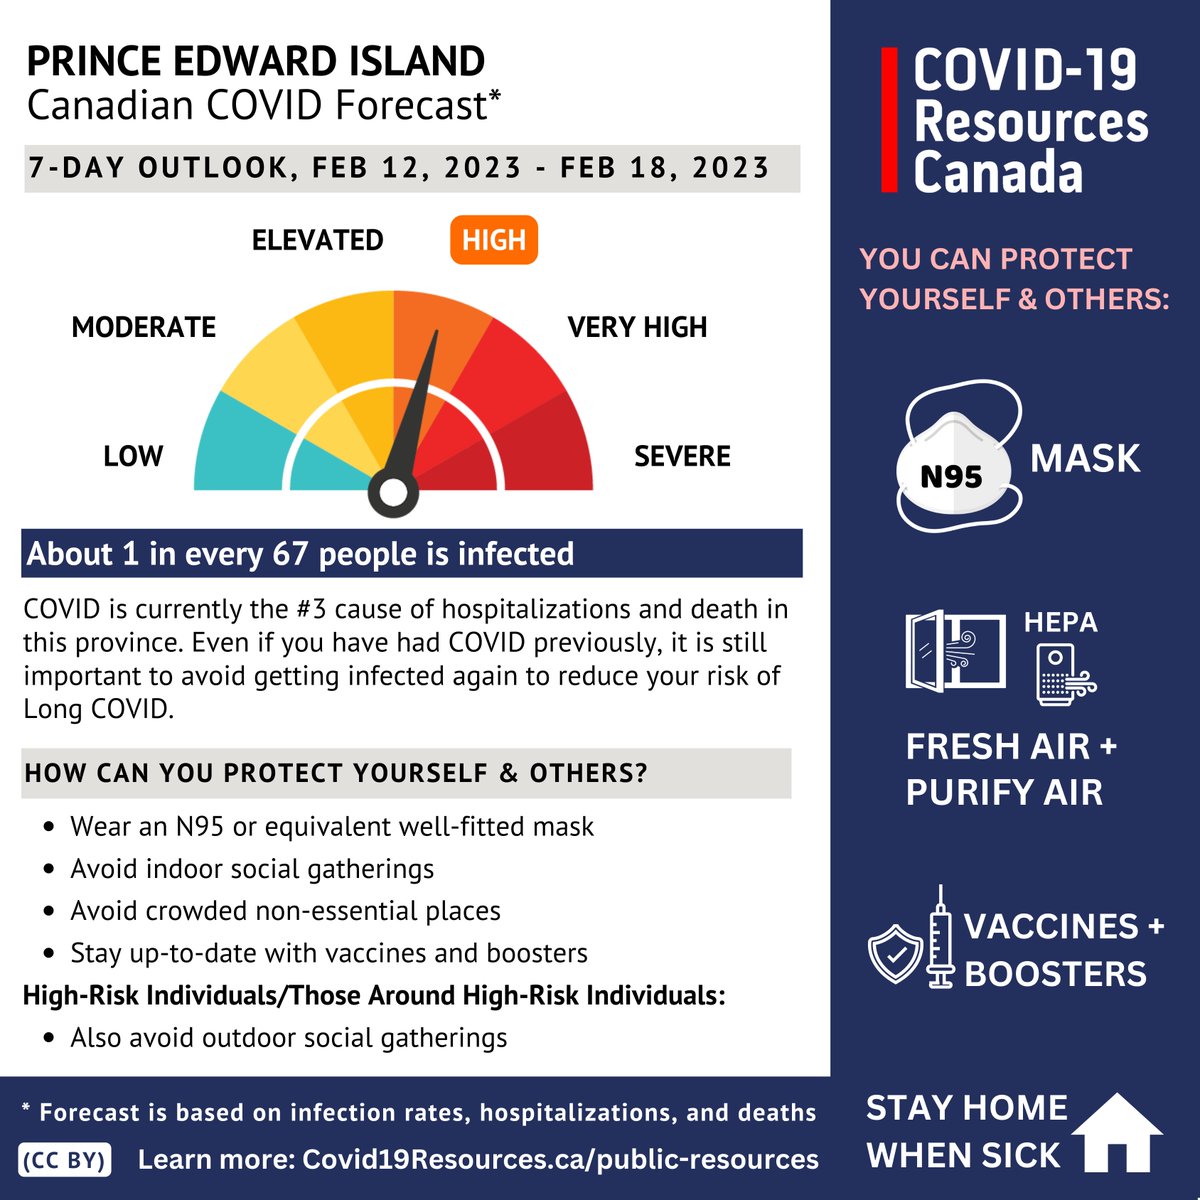
PRINCE EDWARD ISLAND
HIGH
About 1 in every 67 people is infected.
HOW TO HELP:
Mask, get your booster, avoid non-essential indoor public places, social gatherings.
Higher risk: also avoid outdoor social gatherings.
PRINCE EDWARD ISLAND
HIGH
About 1 in every 67 people is infected.
HOW TO HELP:
Mask, get your booster, avoid non-essential indoor public places, social gatherings.
Higher risk: also avoid outdoor social gatherings.
Canadian COVID Forecast Feb 12-18, 2023
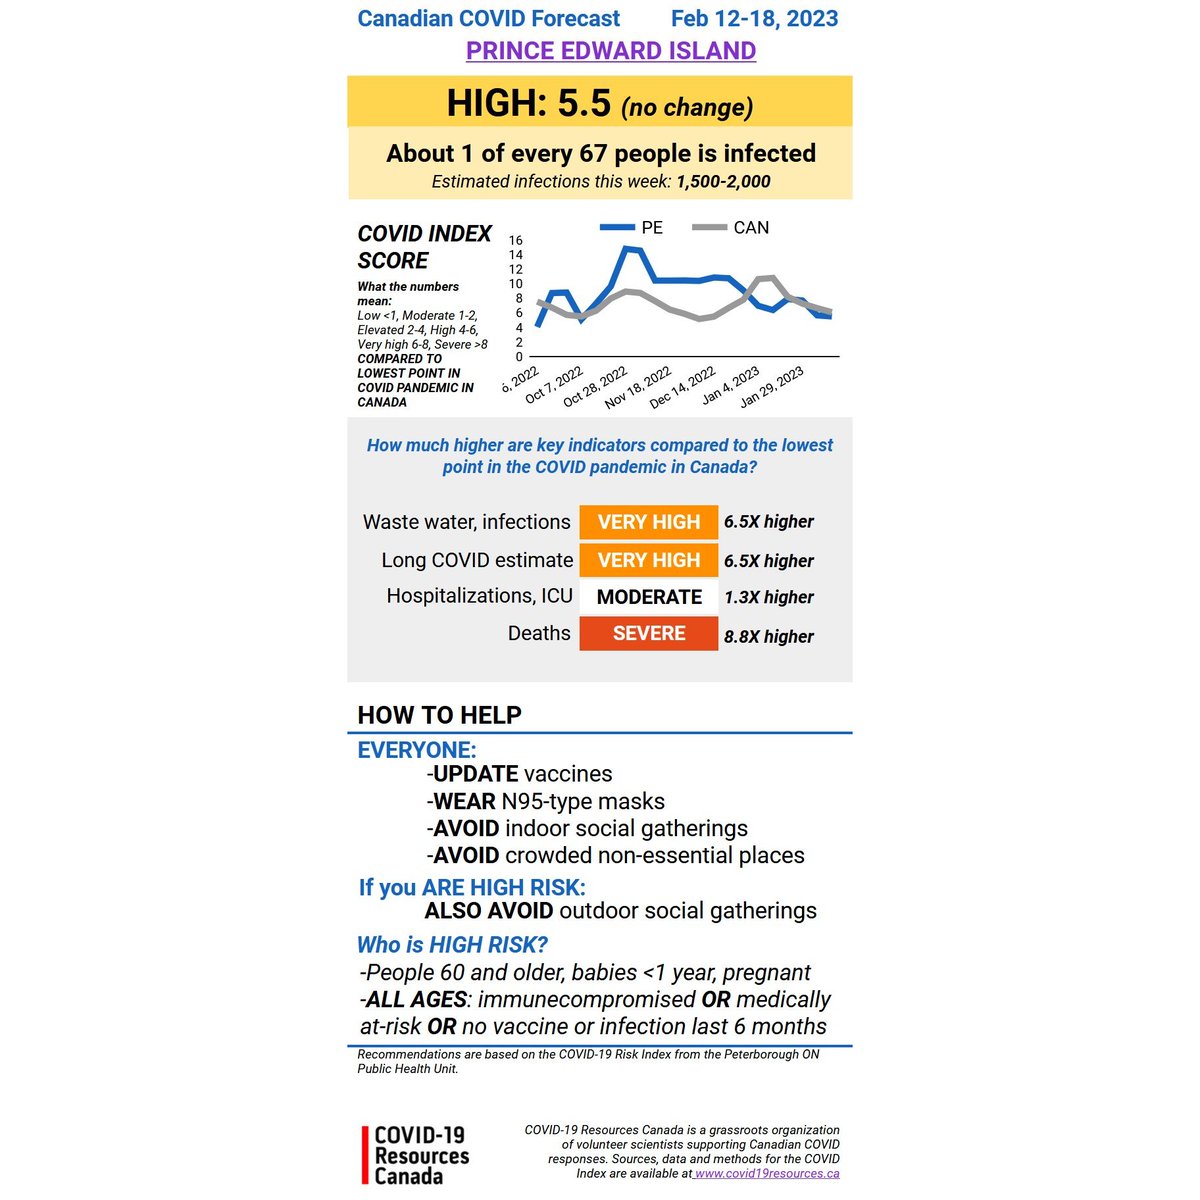
PRINCE EDWARD ISLAND
HIGH
About 1 in every 67 people infected
Compared to lowest point of pandemic in Canada:
🟡Waste water, infections, long COVID cases ~7X higher
🟡Hospitalizations: SIMILAR
🟡Deaths ~9X higher
PRINCE EDWARD ISLAND
HIGH
About 1 in every 67 people infected
Compared to lowest point of pandemic in Canada:
🟡Waste water, infections, long COVID cases ~7X higher
🟡Hospitalizations: SIMILAR
🟡Deaths ~9X higher
Canadian COVID Forecast Feb 12-18, 2023
NOVA SCOTIA
SEVERE
About 1 in every 33 people is infected.
HOW TO HELP:
Mask, get your booster, avoid non-essential indoor public places, social gatherings.
Higher risk: also avoid outdoor social gatherings.
NOVA SCOTIA
SEVERE
About 1 in every 33 people is infected.
HOW TO HELP:
Mask, get your booster, avoid non-essential indoor public places, social gatherings.
Higher risk: also avoid outdoor social gatherings.

Canadian COVID Forecast Feb 12-18, 2023
NOVA SCOTIA
SEVERE
About 1 in every 33 people infected
Compared to lowest point of pandemic in Canada:
🟡Waste water, infections, long COVID cases ~9X higher
🟡Hospitalizations: ~6X higher
🟡Deaths ~16X higher
NOVA SCOTIA
SEVERE
About 1 in every 33 people infected
Compared to lowest point of pandemic in Canada:
🟡Waste water, infections, long COVID cases ~9X higher
🟡Hospitalizations: ~6X higher
🟡Deaths ~16X higher

Canadian COVID Forecast Feb 12-18, 2023
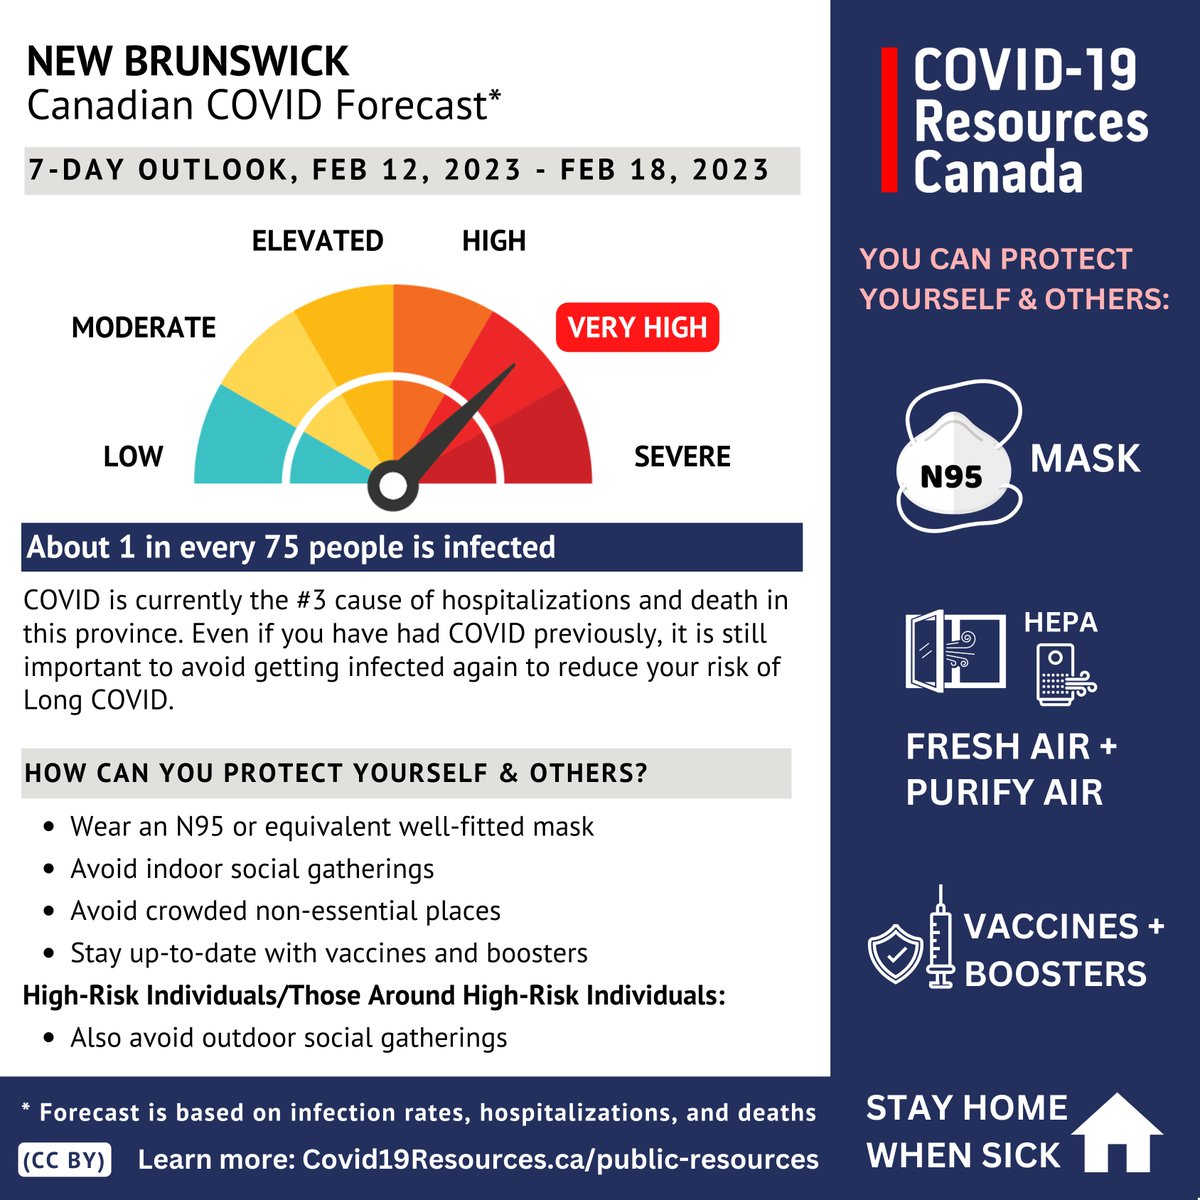
NEW BRUNSWICK
VERY HIGH
About 1 in every 75 people is infected.
HOW TO HELP:
Mask, get your booster, avoid non-essential indoor public places, social gatherings.
Higher risk: also avoid outdoor social gatherings.
NEW BRUNSWICK
VERY HIGH
About 1 in every 75 people is infected.
HOW TO HELP:
Mask, get your booster, avoid non-essential indoor public places, social gatherings.
Higher risk: also avoid outdoor social gatherings.
Canadian COVID Forecast Feb 12-18, 2023
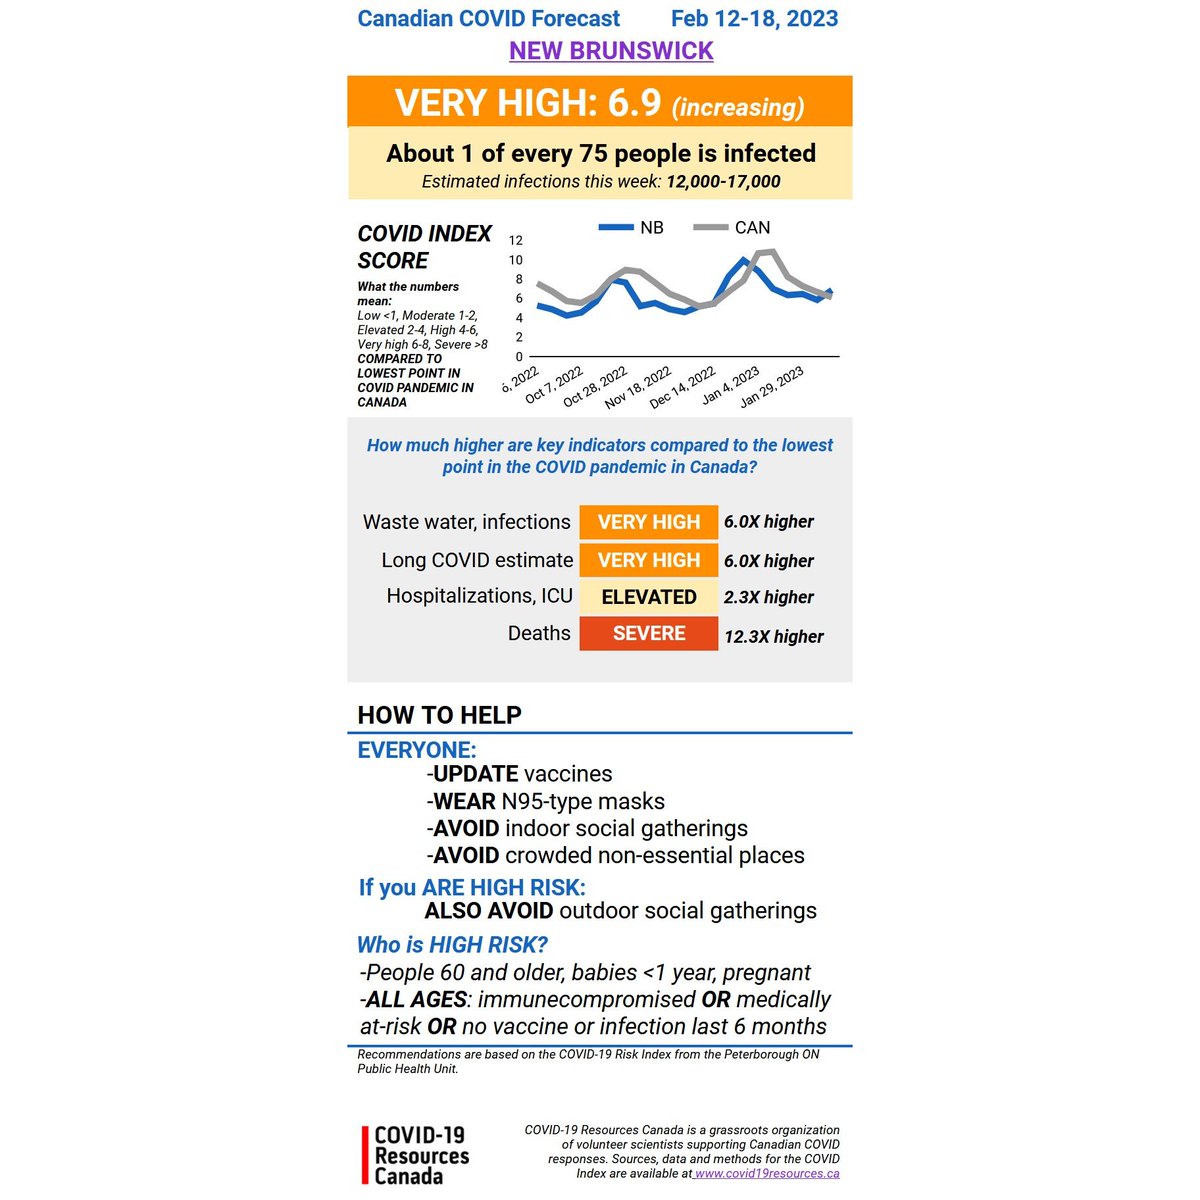
NEW BRUNSWICK
VERY HIGH
About 1 in every 75 people infected
Compared to lowest point of pandemic in Canada:
🟡Waste water, infections, long COVID cases ~6X higher
🟡Hospitalizations: ~2X higher
🟡Deaths ~12X higher
NEW BRUNSWICK
VERY HIGH
About 1 in every 75 people infected
Compared to lowest point of pandemic in Canada:
🟡Waste water, infections, long COVID cases ~6X higher
🟡Hospitalizations: ~2X higher
🟡Deaths ~12X higher
Canadian COVID Forecast Feb 12-18, 2023
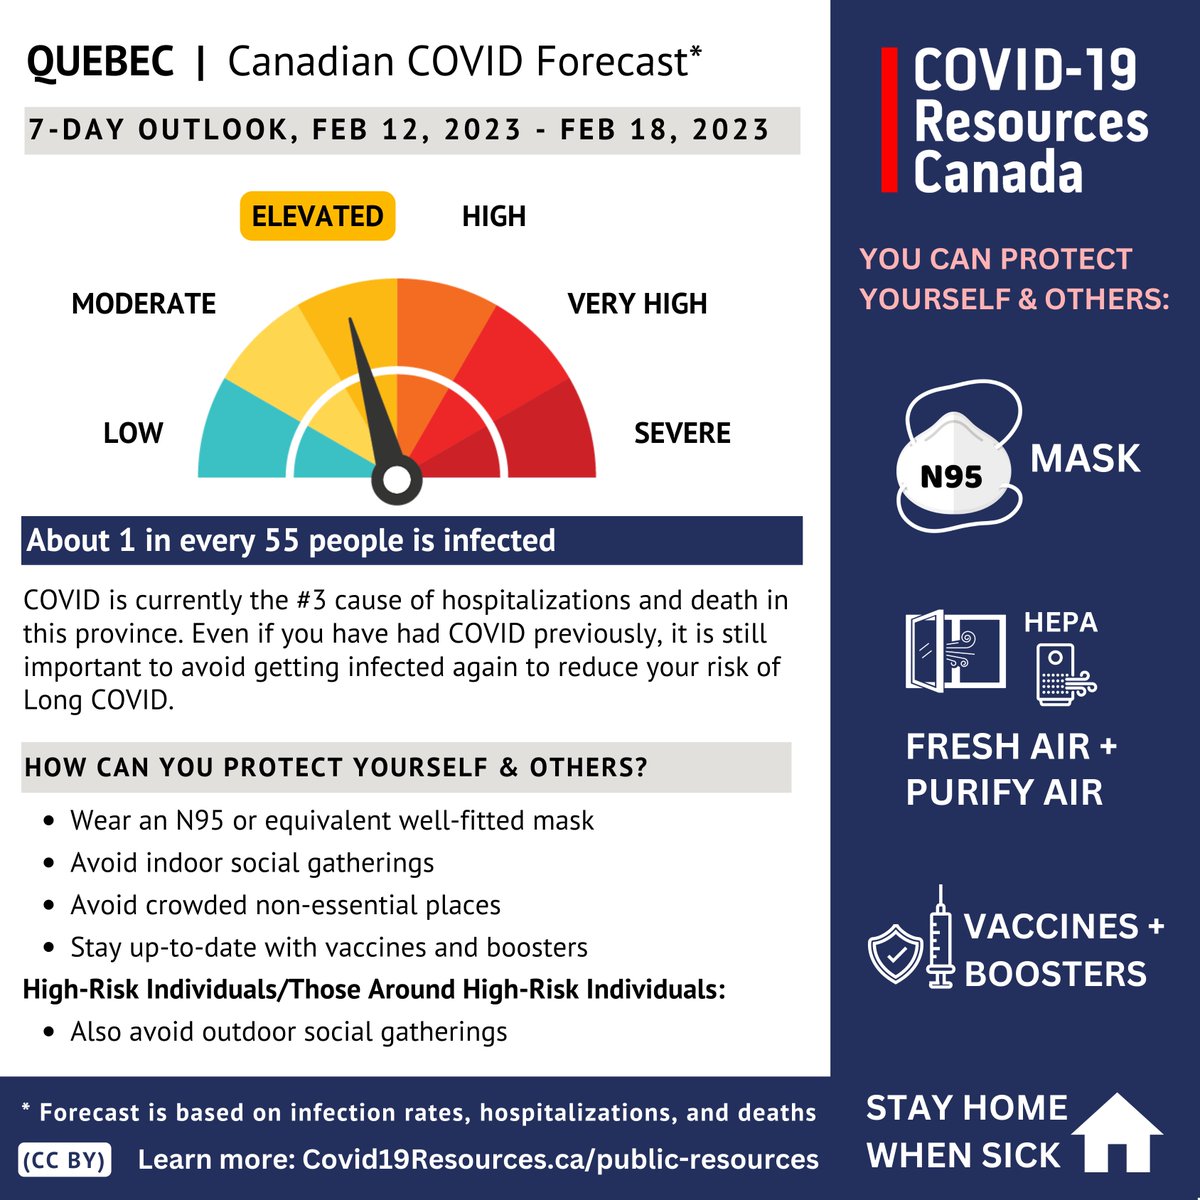
QUEBEC
ELEVATED
About 1 in every 55 people is infected.
HOW TO HELP:
Mask, get your booster, avoid non-essential indoor public places, social gatherings.
Higher risk: also avoid outdoor social gatherings.
QUEBEC
ELEVATED
About 1 in every 55 people is infected.
HOW TO HELP:
Mask, get your booster, avoid non-essential indoor public places, social gatherings.
Higher risk: also avoid outdoor social gatherings.
Bloody Twitter. Keeps prompting me to save or discard tweets when I want to send them. It's possible there may be some service interruptions on this thread, folks.
You'll hear anguished cries from the direction of Ontario.
You'll hear anguished cries from the direction of Ontario.
Canadian COVID Forecast Feb 12-18, 2023
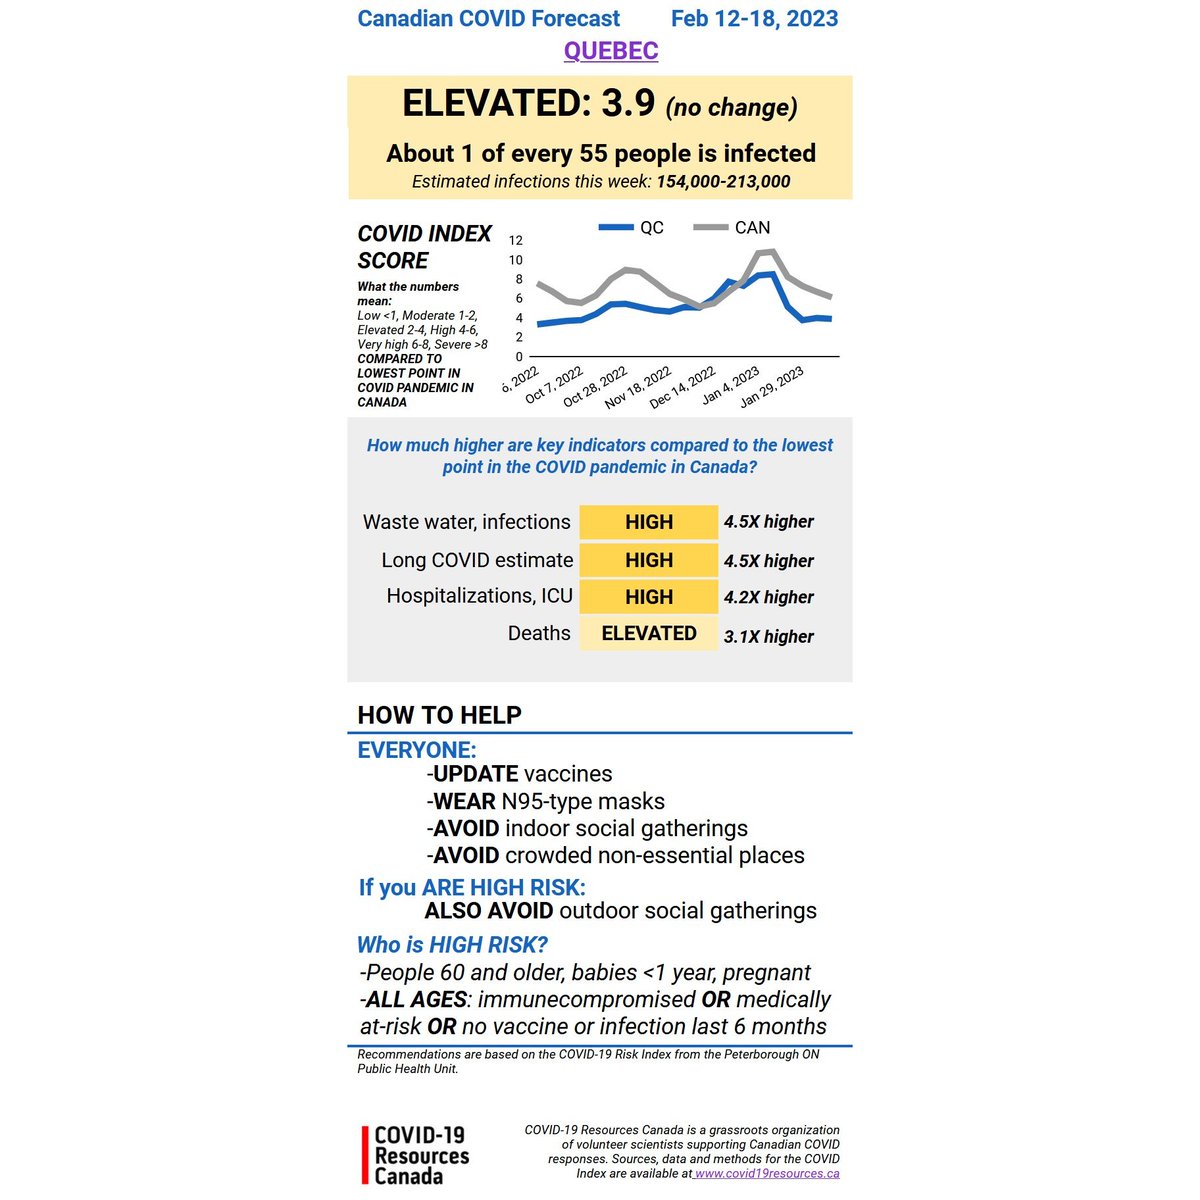
QUEBEC
ELEVATED
About 1 in every 55 people infected
Compared to lowest point of pandemic in Canada:
🟡Waste water, infections, long COVID cases ~5X higher
🟡Hospitalizations: ~4X higher
🟡Deaths ~3X higher
QUEBEC
ELEVATED
About 1 in every 55 people infected
Compared to lowest point of pandemic in Canada:
🟡Waste water, infections, long COVID cases ~5X higher
🟡Hospitalizations: ~4X higher
🟡Deaths ~3X higher
For those who often wonder why the COVID Forecast for QC goes up and down faster than for many regions (and doesn't get stuck at the highest points for as long).
Part of it is reporting--QC reporting is faster and more complete than most Canadian regions, and there's not as much of a problem with severe outcomes trickling in for weeks/months after they've happened.
But also, QC and the Prairie provinces too seem to have had a better go of Omicron than provinces that likely had experienced fewer severe outcomes and infections pre-Omicron.
The other thing that's important to know about the Prairie provinces and QC is that reporting of hospitalization and ICU admissions is pretty decent in all of these provinces. We don't see as much of the prolonged, dragged out reporting that we see in Atlantic Canada and Ontario.
BC hospital/ICU admission reporting is pretty decent too, at least compared to ON and Atlantic Canada. BC death reporting has really improved in the last year or so, but it's still a bit protracted, which may contribute to BC COVID forecast scores stalling at high points.
We also know from @COVIDimmunityTF seroprevalence data that as of early Dec, BC, ON and Atlantic provinces still had the lowest % the total population infected at least once.
So it's likely there's a bit more tinder (and more expected severe outcomes) in these provinces.
So it's likely there's a bit more tinder (and more expected severe outcomes) in these provinces.
@COVIDimmunityTF After that tangent, back to the forecasts
@COVIDimmunityTF Aargh. Too much chat. Not enough attention to detail. Just made a mistake in my Ontario tweets.
Starting them over.
Starting them over.
Canadian COVID Forecast Feb 12-18, 2023
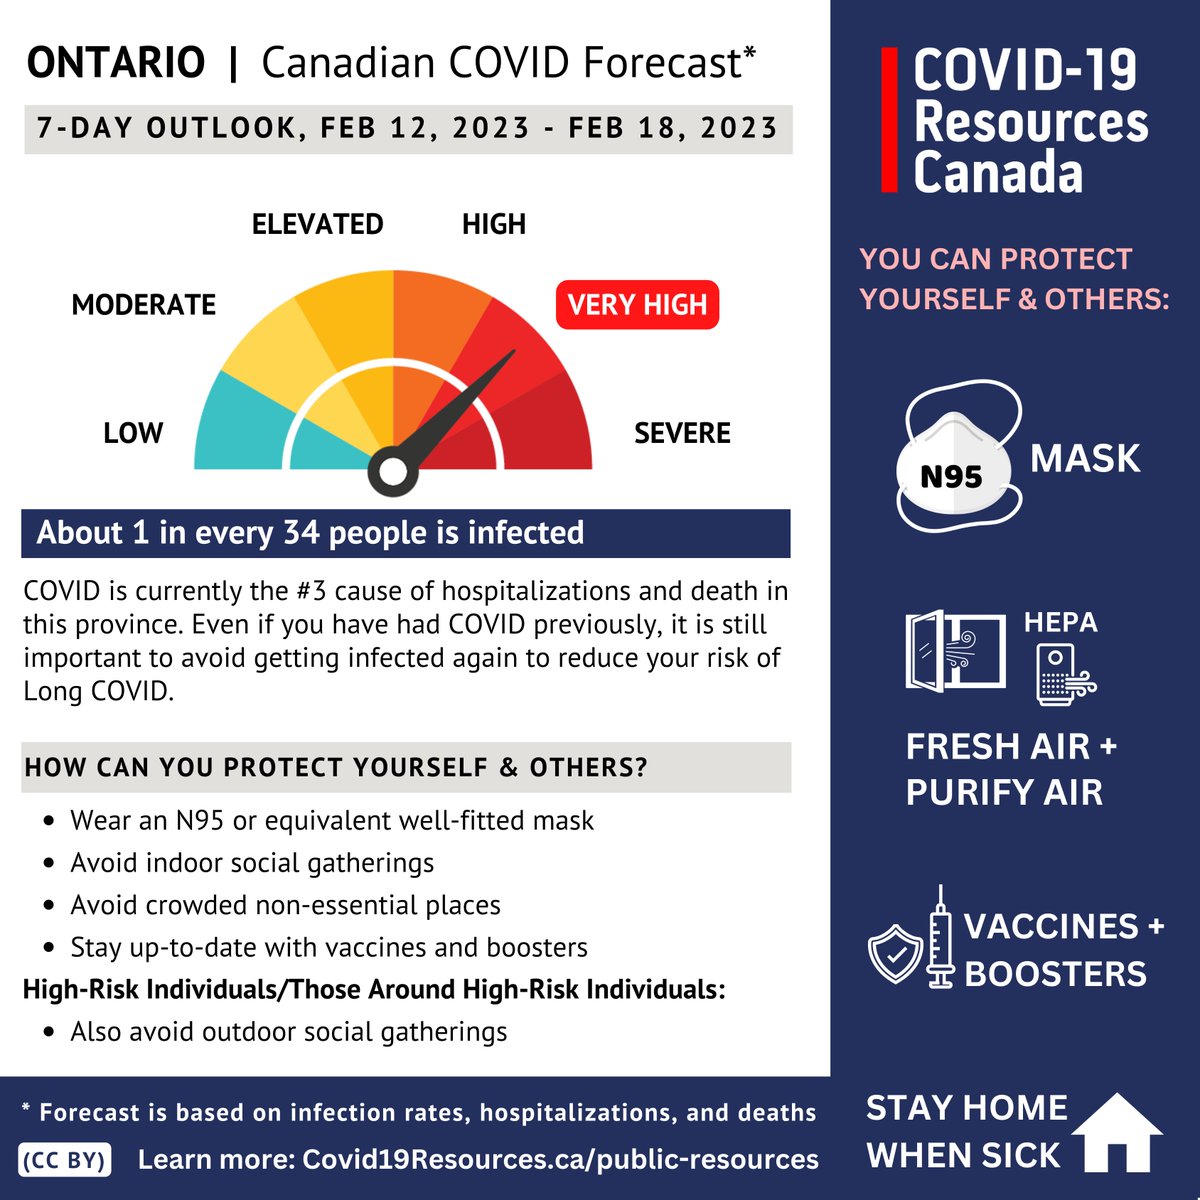
ONTARIO
VERY HIGH
About 1 in every 34 people is infected.
HOW TO HELP:
Mask, get your booster, avoid non-essential indoor public places, social gatherings.
Higher risk: also avoid outdoor social gatherings.
ONTARIO
VERY HIGH
About 1 in every 34 people is infected.
HOW TO HELP:
Mask, get your booster, avoid non-essential indoor public places, social gatherings.
Higher risk: also avoid outdoor social gatherings.
Canadian COVID Forecast Feb 12-18, 2023
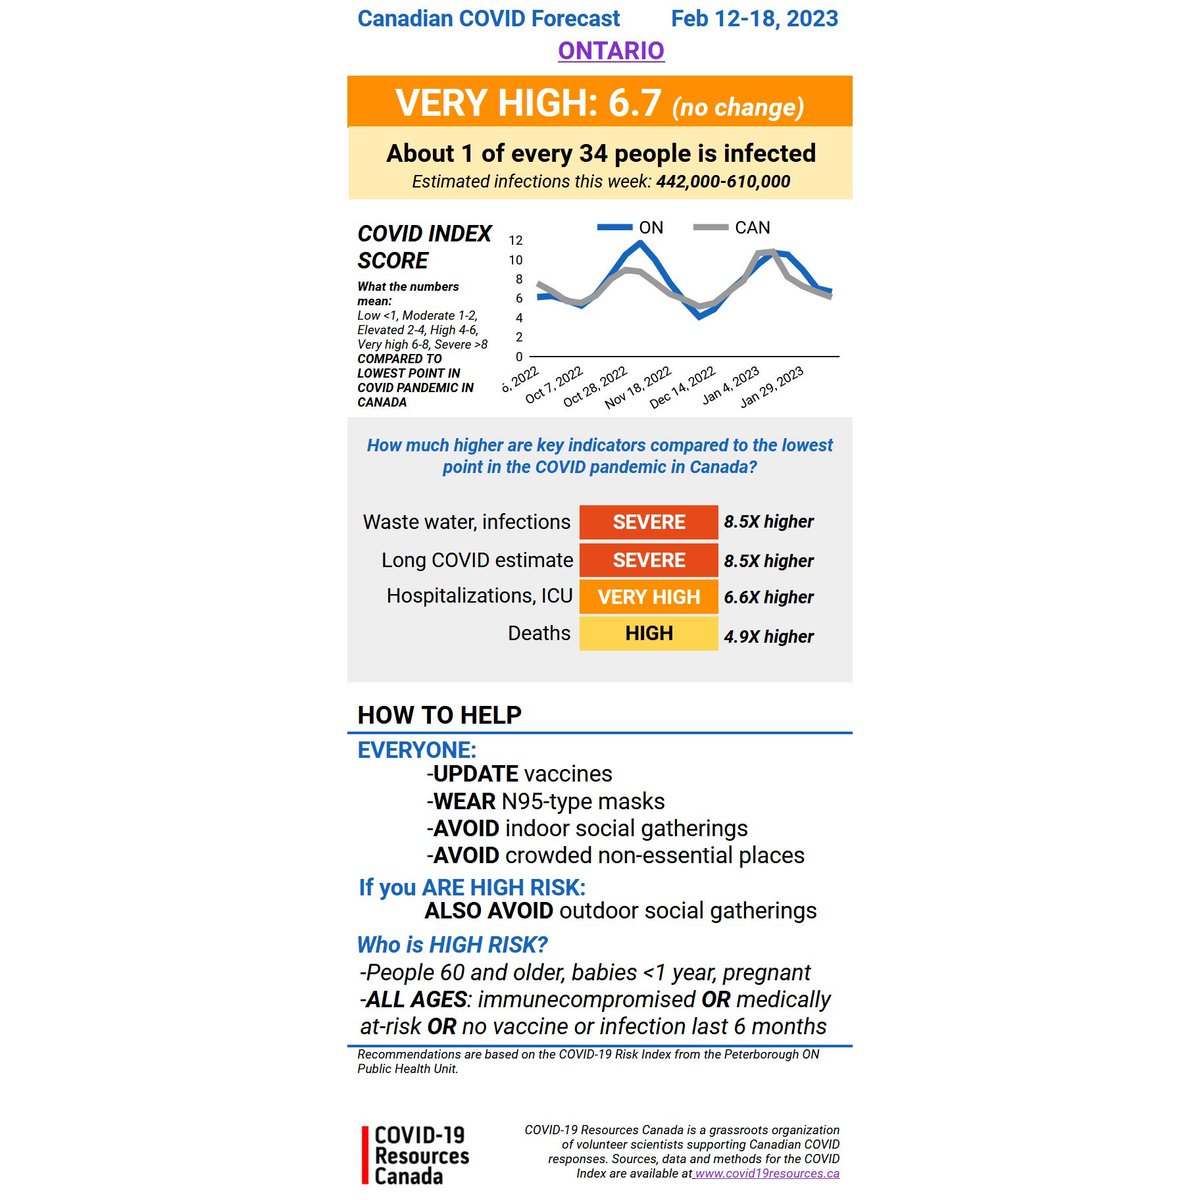
ONTARIO
VERY HIGH
About 1 in every 34 people infected
Compared to lowest point of pandemic in Canada:
🟡Waste water, infections, long COVID cases ~9X higher
🟡Hospitalizations: ~7X higher
🟡Deaths ~5X higher
ONTARIO
VERY HIGH
About 1 in every 34 people infected
Compared to lowest point of pandemic in Canada:
🟡Waste water, infections, long COVID cases ~9X higher
🟡Hospitalizations: ~7X higher
🟡Deaths ~5X higher
Canadian COVID Forecast Feb 12-18, 2023
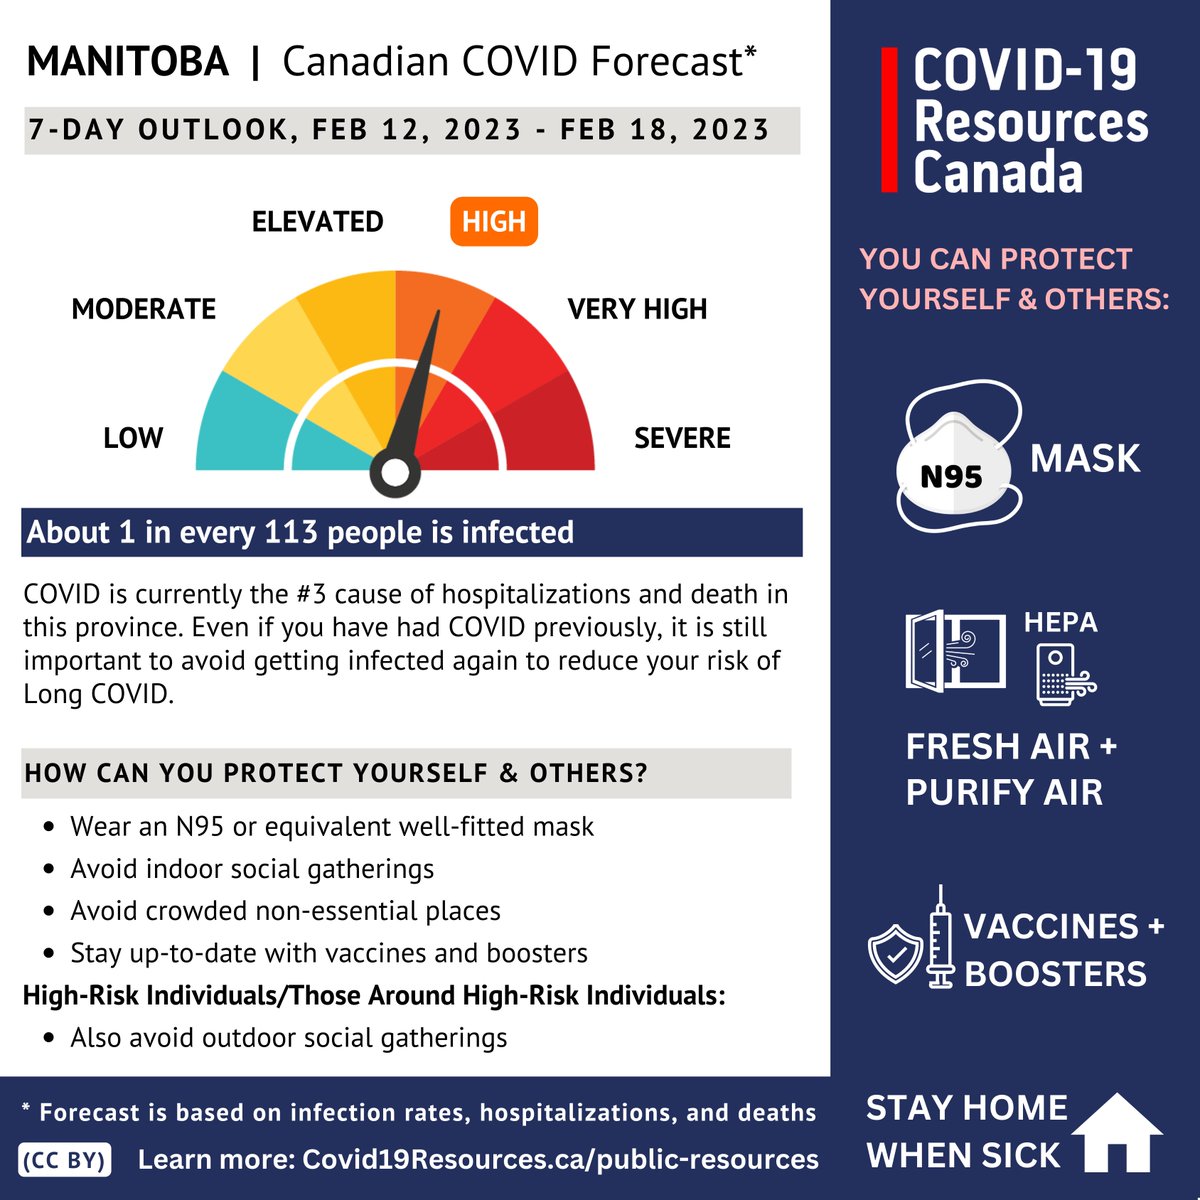
MANITOBA
HIGH
About 1 in every 113 people is infected.
HOW TO HELP:
Mask, get your booster, avoid non-essential indoor public places, social gatherings.
Higher risk: also avoid outdoor social gatherings.
MANITOBA
HIGH
About 1 in every 113 people is infected.
HOW TO HELP:
Mask, get your booster, avoid non-essential indoor public places, social gatherings.
Higher risk: also avoid outdoor social gatherings.
Canadian COVID Forecast Feb 12-18, 2023
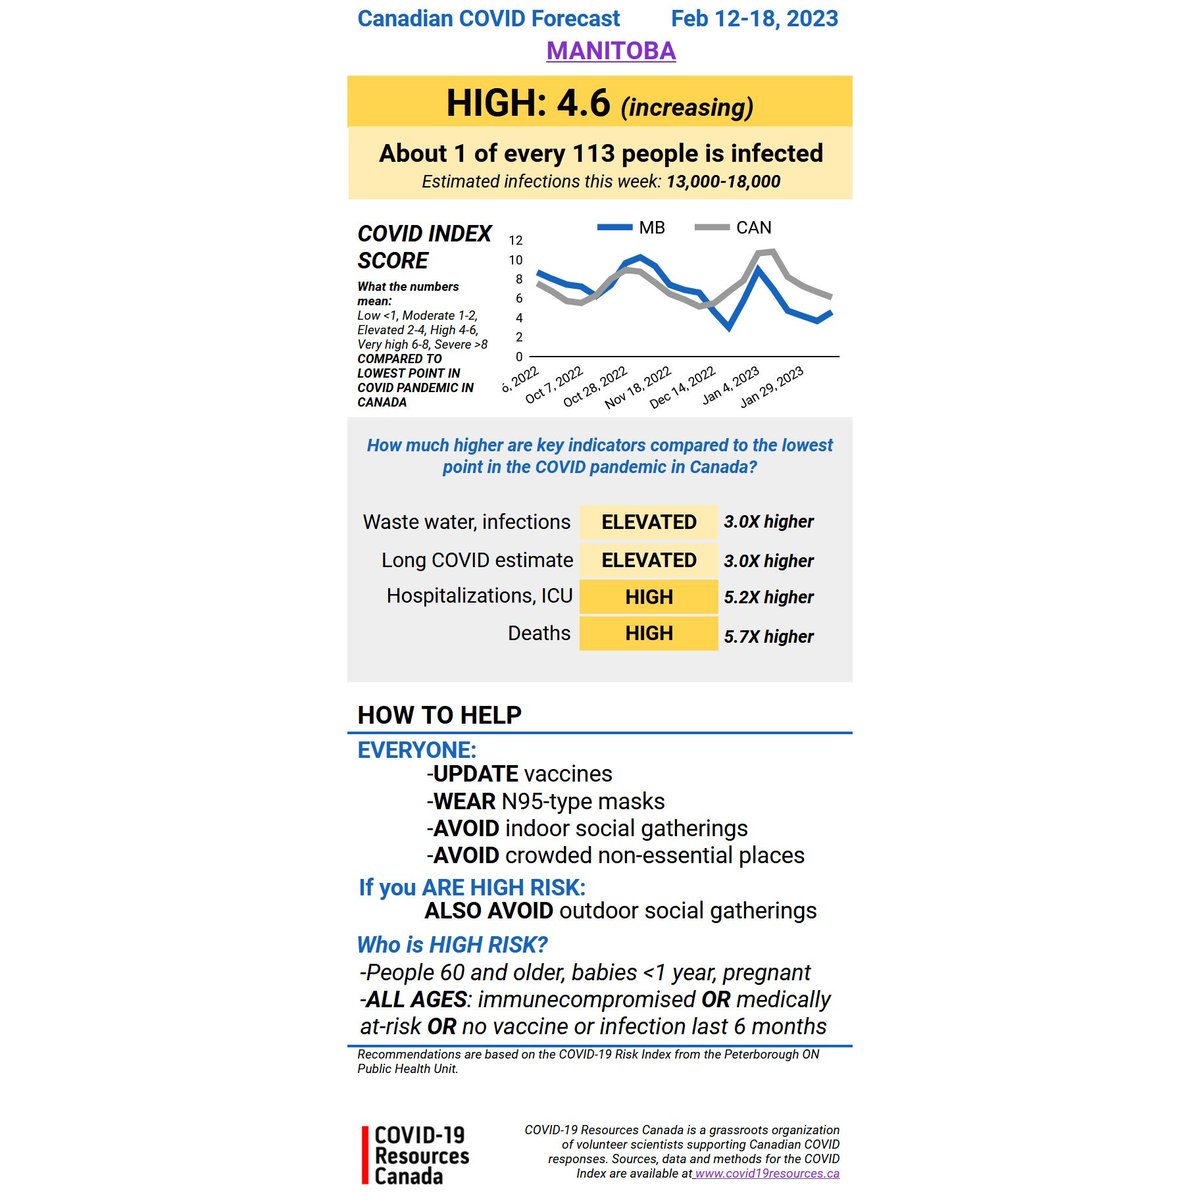
MANITOBA
HIGH
About 1 in every 113 people infected
Compared to lowest point of pandemic in Canada:
🟡Waste water, infections, long COVID cases ~3X higher
🟡Hospitalizations: ~5X higher
🟡Deaths ~6X higher
MANITOBA
HIGH
About 1 in every 113 people infected
Compared to lowest point of pandemic in Canada:
🟡Waste water, infections, long COVID cases ~3X higher
🟡Hospitalizations: ~5X higher
🟡Deaths ~6X higher
Canadian COVID Forecast Feb 12-18, 2023
SASKATCHEWAN
VERY HIGH
About 1 in every 98 people is infected.
HOW TO HELP:
Mask, get your booster, avoid non-essential indoor public places, social gatherings.
Higher risk: also avoid outdoor social gatherings.
SASKATCHEWAN
VERY HIGH
About 1 in every 98 people is infected.
HOW TO HELP:
Mask, get your booster, avoid non-essential indoor public places, social gatherings.
Higher risk: also avoid outdoor social gatherings.

Canadian COVID Forecast Feb 12-18, 2023
SASKATCHEWAN
VERY HIGH
About 1 in every 98 people infected
Compared to lowest point of pandemic in Canada:
🟡Waste water, infections, long COVID cases ~4X higher
🟡Hospitalizations: ~14X higher
🟡Deaths ~6X higher
SASKATCHEWAN
VERY HIGH
About 1 in every 98 people infected
Compared to lowest point of pandemic in Canada:
🟡Waste water, infections, long COVID cases ~4X higher
🟡Hospitalizations: ~14X higher
🟡Deaths ~6X higher

Canadian COVID Forecast Feb 12-18, 2023
ALBERTA
ELEVATED
About 1 in every 92 people is infected.
HOW TO HELP:
Mask, get your booster, avoid non-essential indoor public places, social gatherings.
Higher risk: also avoid outdoor social gatherings.
ALBERTA
ELEVATED
About 1 in every 92 people is infected.
HOW TO HELP:
Mask, get your booster, avoid non-essential indoor public places, social gatherings.
Higher risk: also avoid outdoor social gatherings.

Canadian COVID Forecast Feb 12-18, 2023
ALBERTA
ELEVATED
About 1 in every 92 people infected
Compared to lowest point of pandemic in Canada:
🟡Waste water, infections, long COVID cases ~3X higher
🟡Hospitalizations: ~2X higher
🟡Deaths ~2X higher
ALBERTA
ELEVATED
About 1 in every 92 people infected
Compared to lowest point of pandemic in Canada:
🟡Waste water, infections, long COVID cases ~3X higher
🟡Hospitalizations: ~2X higher
🟡Deaths ~2X higher

Canadian COVID Forecast Feb 12-18, 2023
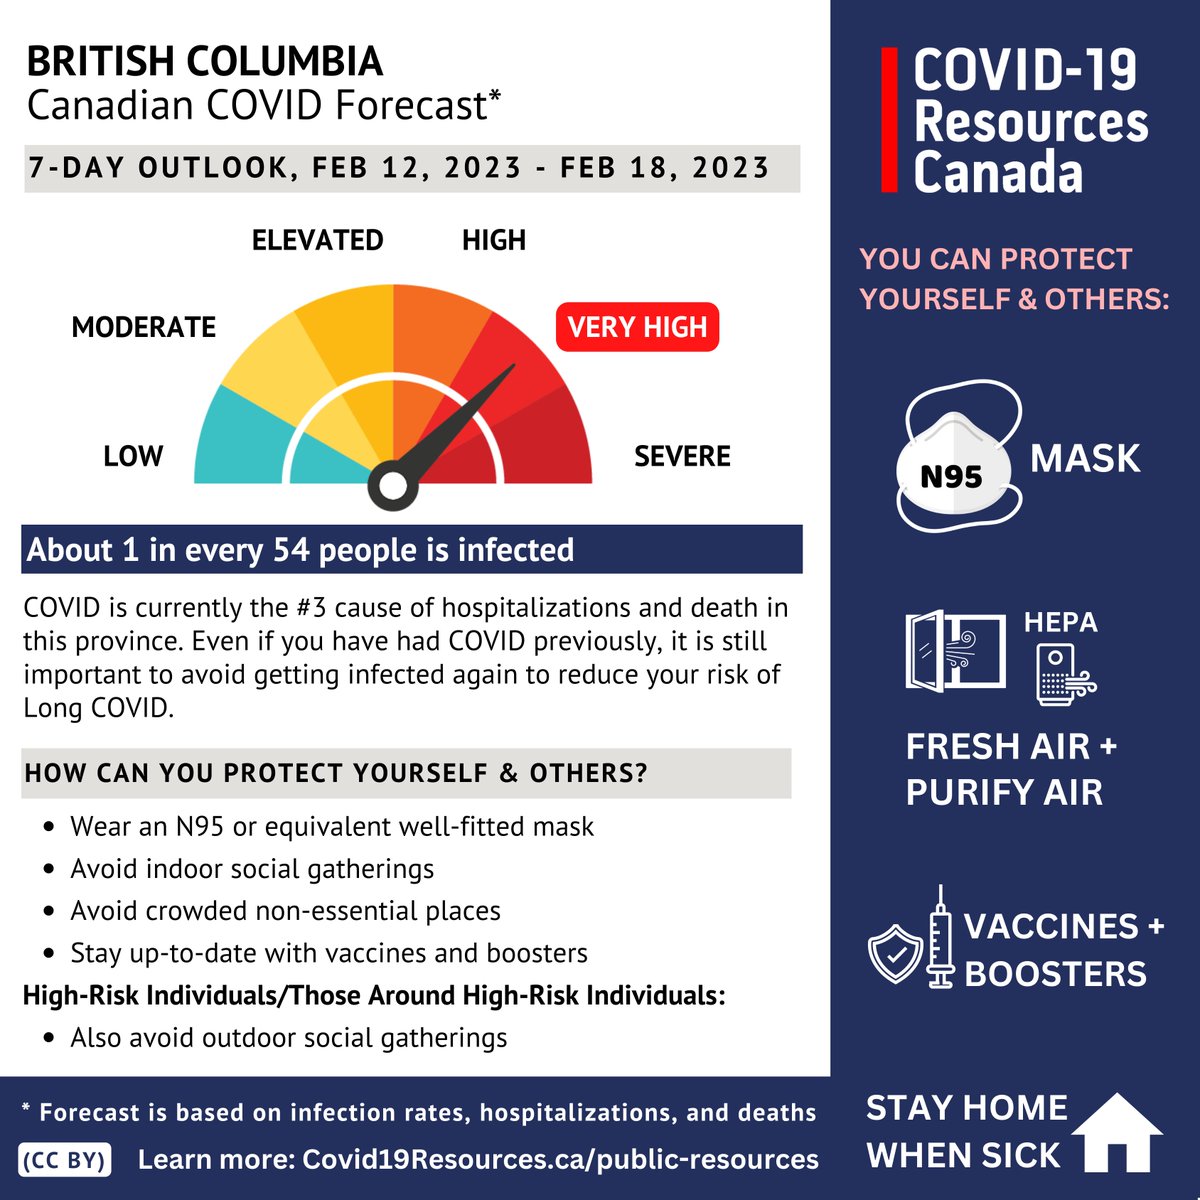
BRITISH COLUMBIA
VERY HIGH
About 1 in every 54 people is infected.
HOW TO HELP:
Mask, get your booster, avoid non-essential indoor public places, social gatherings.
Higher risk: also avoid outdoor social gatherings.
BRITISH COLUMBIA
VERY HIGH
About 1 in every 54 people is infected.
HOW TO HELP:
Mask, get your booster, avoid non-essential indoor public places, social gatherings.
Higher risk: also avoid outdoor social gatherings.
Canadian COVID Forecast Feb 12-18, 2023
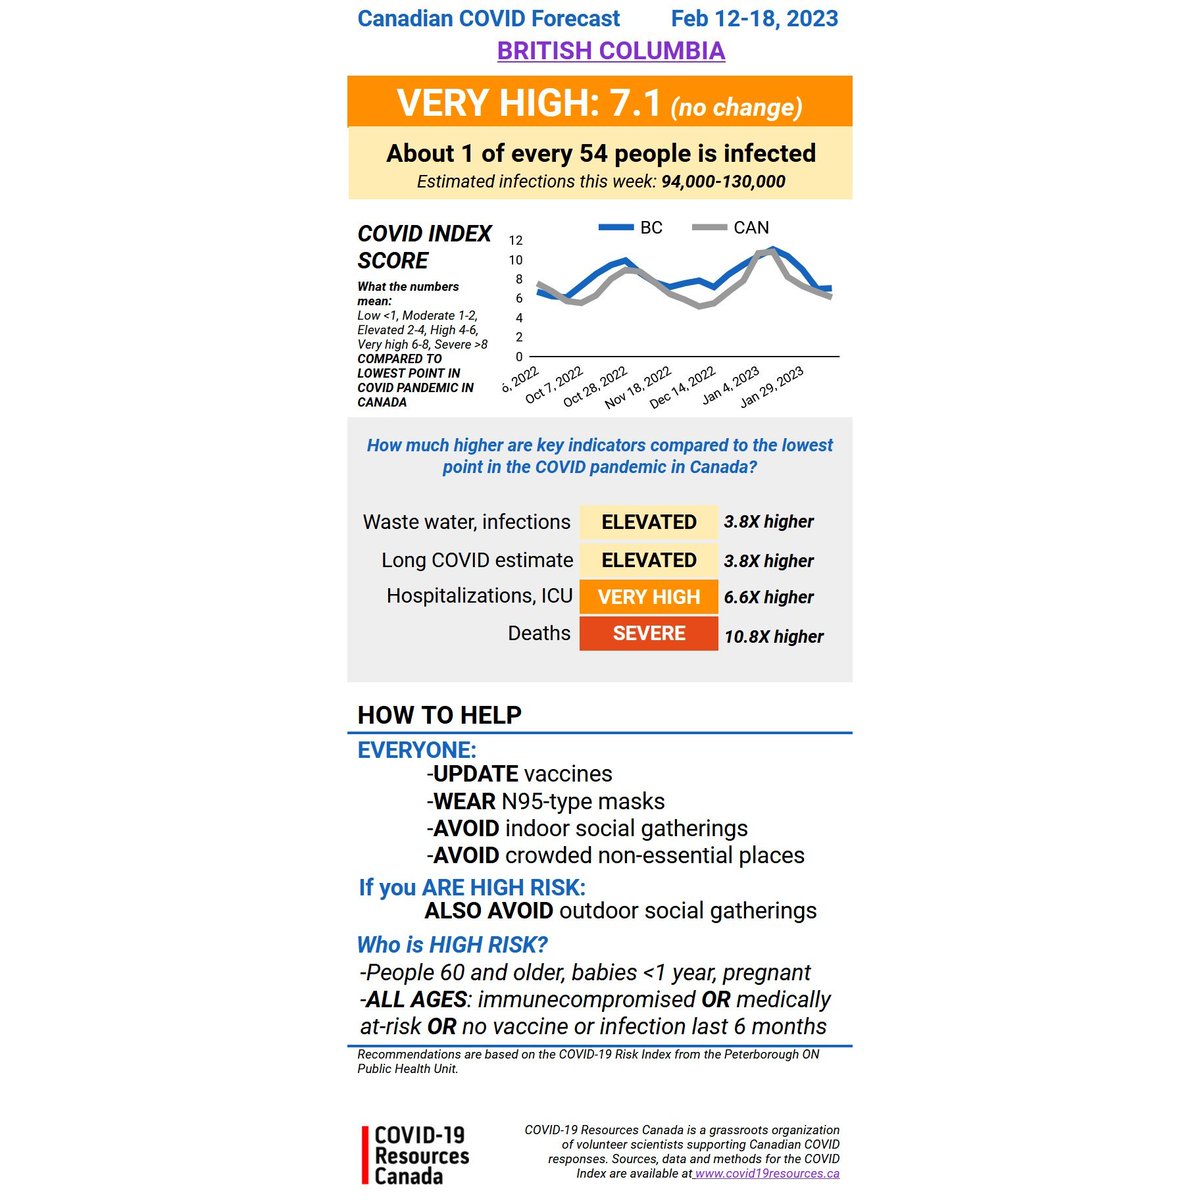
BRITISH COLUMBIA
VERY HIGH
About 1 in every 54 people infected
Compared to lowest point of pandemic in Canada:
🟡Waste water, infections, long COVID cases ~4X higher
🟡Hospitalizations: ~7X higher
🟡Deaths ~11X higher
BRITISH COLUMBIA
VERY HIGH
About 1 in every 54 people infected
Compared to lowest point of pandemic in Canada:
🟡Waste water, infections, long COVID cases ~4X higher
🟡Hospitalizations: ~7X higher
🟡Deaths ~11X higher
Canadian COVID Forecast Feb 12-18, 2023
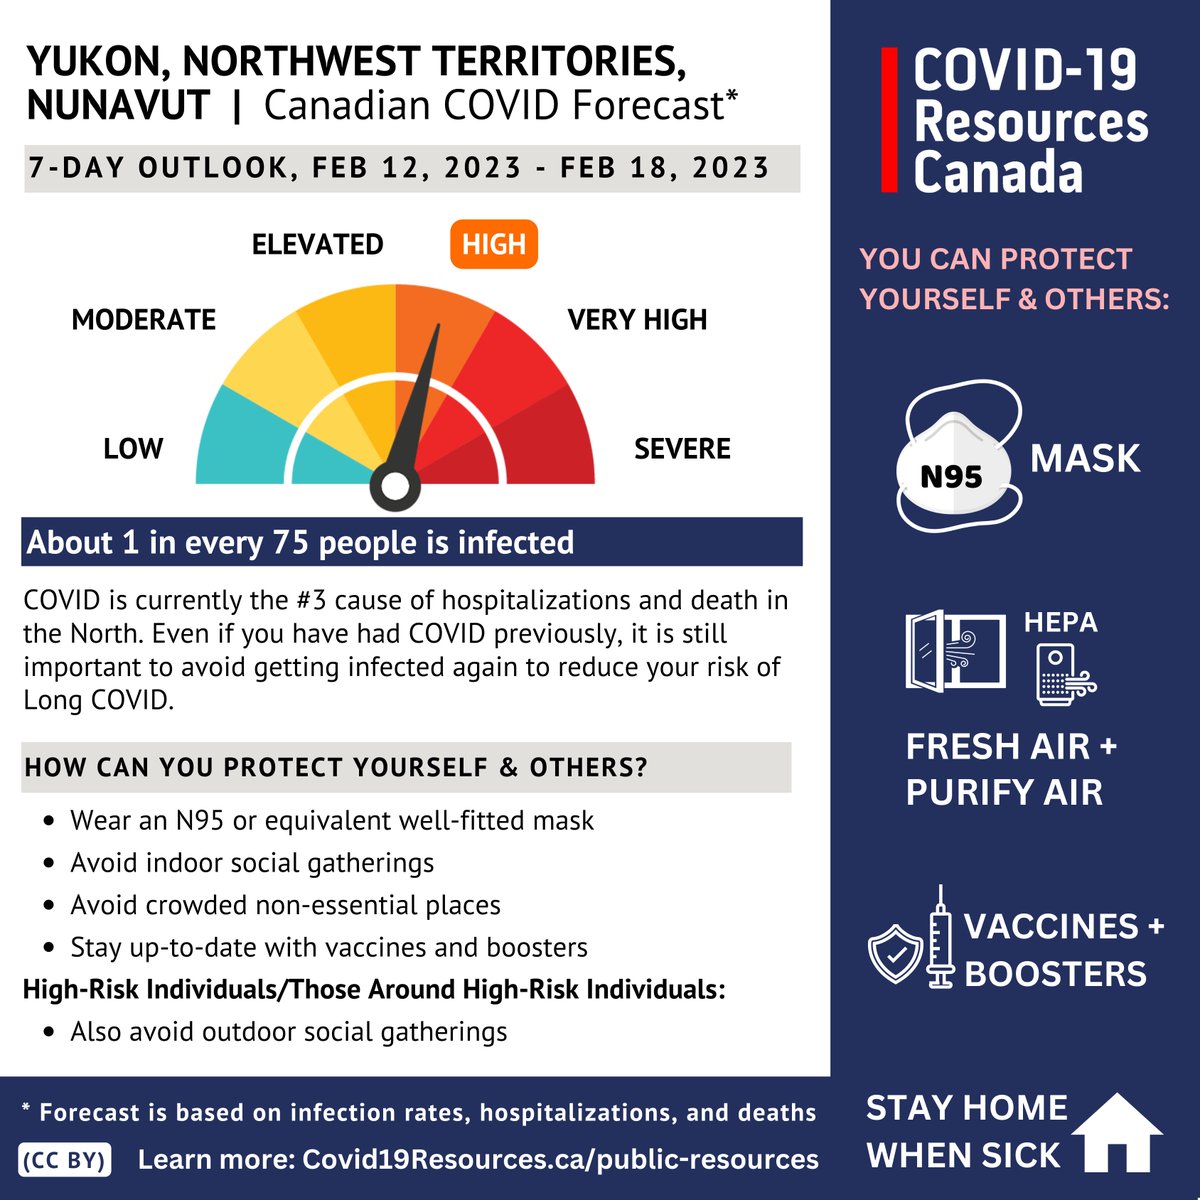
NUNAVUT, NORTHWEST TERRITORIES, YUKON
HIGH
About 1 in every 75 people is infected.
HOW TO HELP:
Mask, get your booster, avoid non-essential indoor public places, social gatherings.
Higher risk: also avoid outdoor social gatherings.
NUNAVUT, NORTHWEST TERRITORIES, YUKON
HIGH
About 1 in every 75 people is infected.
HOW TO HELP:
Mask, get your booster, avoid non-essential indoor public places, social gatherings.
Higher risk: also avoid outdoor social gatherings.
Canadian COVID Forecast Feb 12-18, 2023
NUNAVUT, NWT, YUKON
HIGH
About 1 in every 75 people infected
Compared to lowest point of pandemic in Canada:
🟡Waste water, infections, long COVID cases ~8X higher
🟡Hospitalizations: ~2X higher
🟡Deaths ~3X higher
NUNAVUT, NWT, YUKON
HIGH
About 1 in every 75 people infected
Compared to lowest point of pandemic in Canada:
🟡Waste water, infections, long COVID cases ~8X higher
🟡Hospitalizations: ~2X higher
🟡Deaths ~3X higher

That's all folks. Gotta go work on a paper, but will check in again later.
Oh and @threadreaderapp unroll please
Oh and @threadreaderapp unroll please
• • •
Missing some Tweet in this thread? You can try to
force a refresh