If you're not following this process, youโre entering the trading week blind
It is literally what I implement every week to get the high-probability trades that Iโm taking.
Finish this thread and youโll master the simple weekly trading process.
A thread๐งต
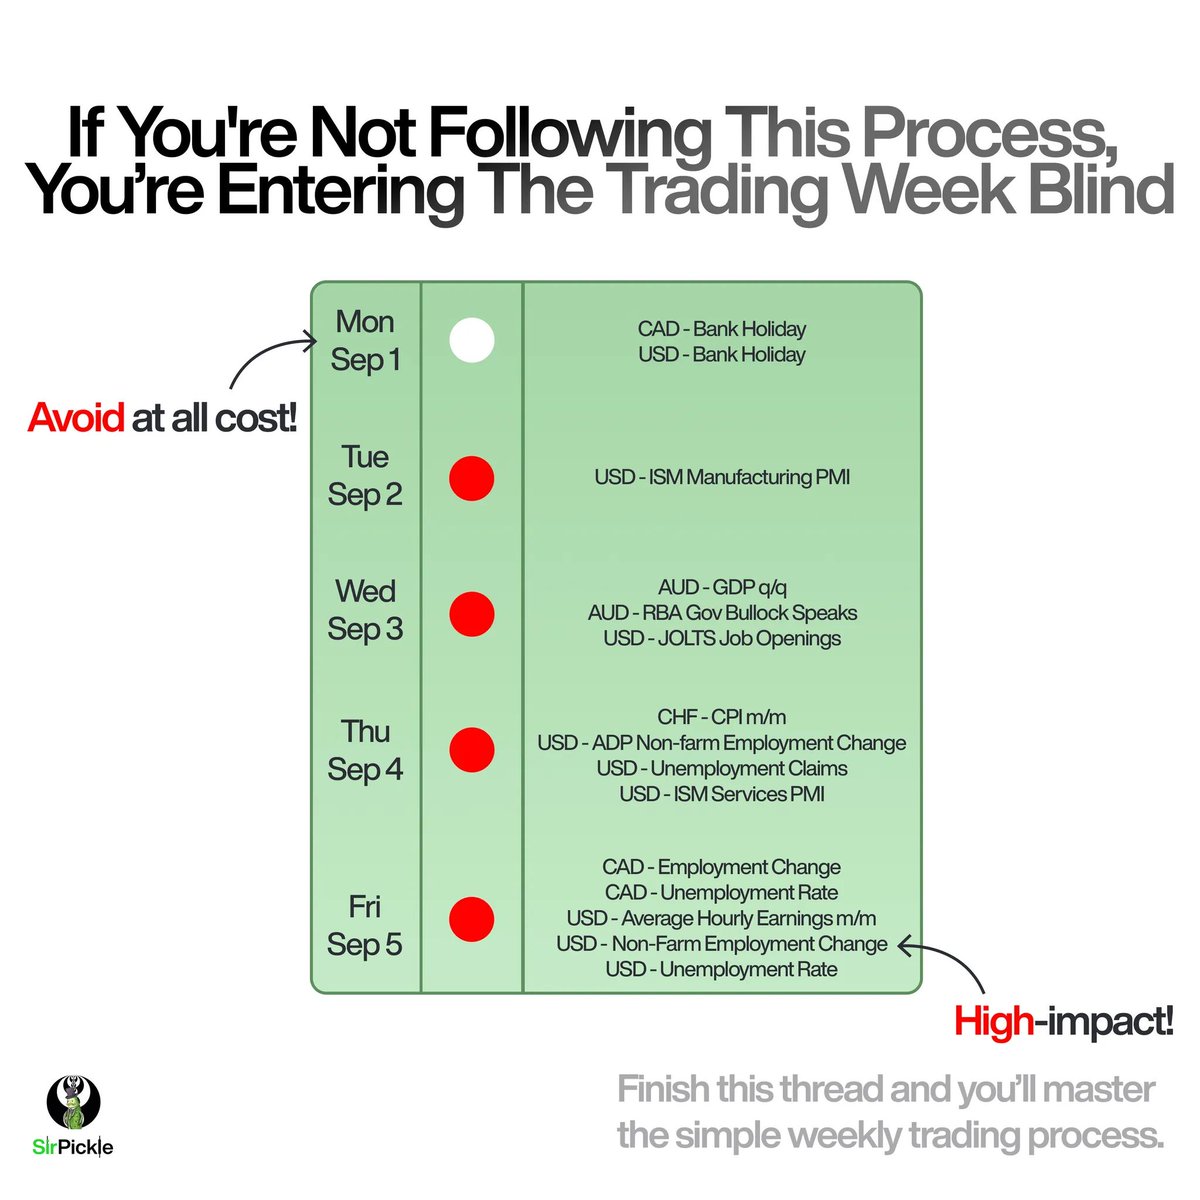
The economic news calendar is your roadmap.
It shows you what day during the week will likely provide volatility to trade with.
You see, news is what injects volatility into the market. Volatility = energy
Price is highest probability to trade when there is ENERGY in the markets.
This is when we see price in a hurry to get to its draws and not chop/consolidate.
We want to be EXTRA cautious on days without red folder news since assets have an increased chance of consolidating during those days.
We also wanna be cautious the day before NFP, CPI, and FOMC. Price typically likes to be held in a range as it awaits the main volatility injector for the week.
Lack of news = Lack of energy
We want to avoid trading bank holidays as the volatility simply isnโt there.
Below youโll see the effect of bank holidays to the price action. We had USD bank holiday on Monday and see what the effect of it in major pairs.
So, to be aware of this: Go to forexfactory.com/calendar and ask yourself: โWhere are the high impact news events laid out for this week? Which assets are they on? Is there Big 3 news events? Is there a bank holiday?โ
Give me 5 minutes and Iโll simplify your understanding of price actionโฆ
The only concepts you need to know in order to find bias are orderflow and candlestick logic.
At the end of this thread, youโll have everything you need to read and trade any asset effectively.
A thread๐งต
Orderflow and Candlestick Logic
These two concepts give you both the direction and the confirmation.
In a bullish orderflow leg, once bullish PD arrays are respected, then thereโs a higher chance of price going higher.
In a bearish orderflow leg, once bearish PD arrays are respected, then thereโs a higher chance of price going lower.
Itโs that simple.
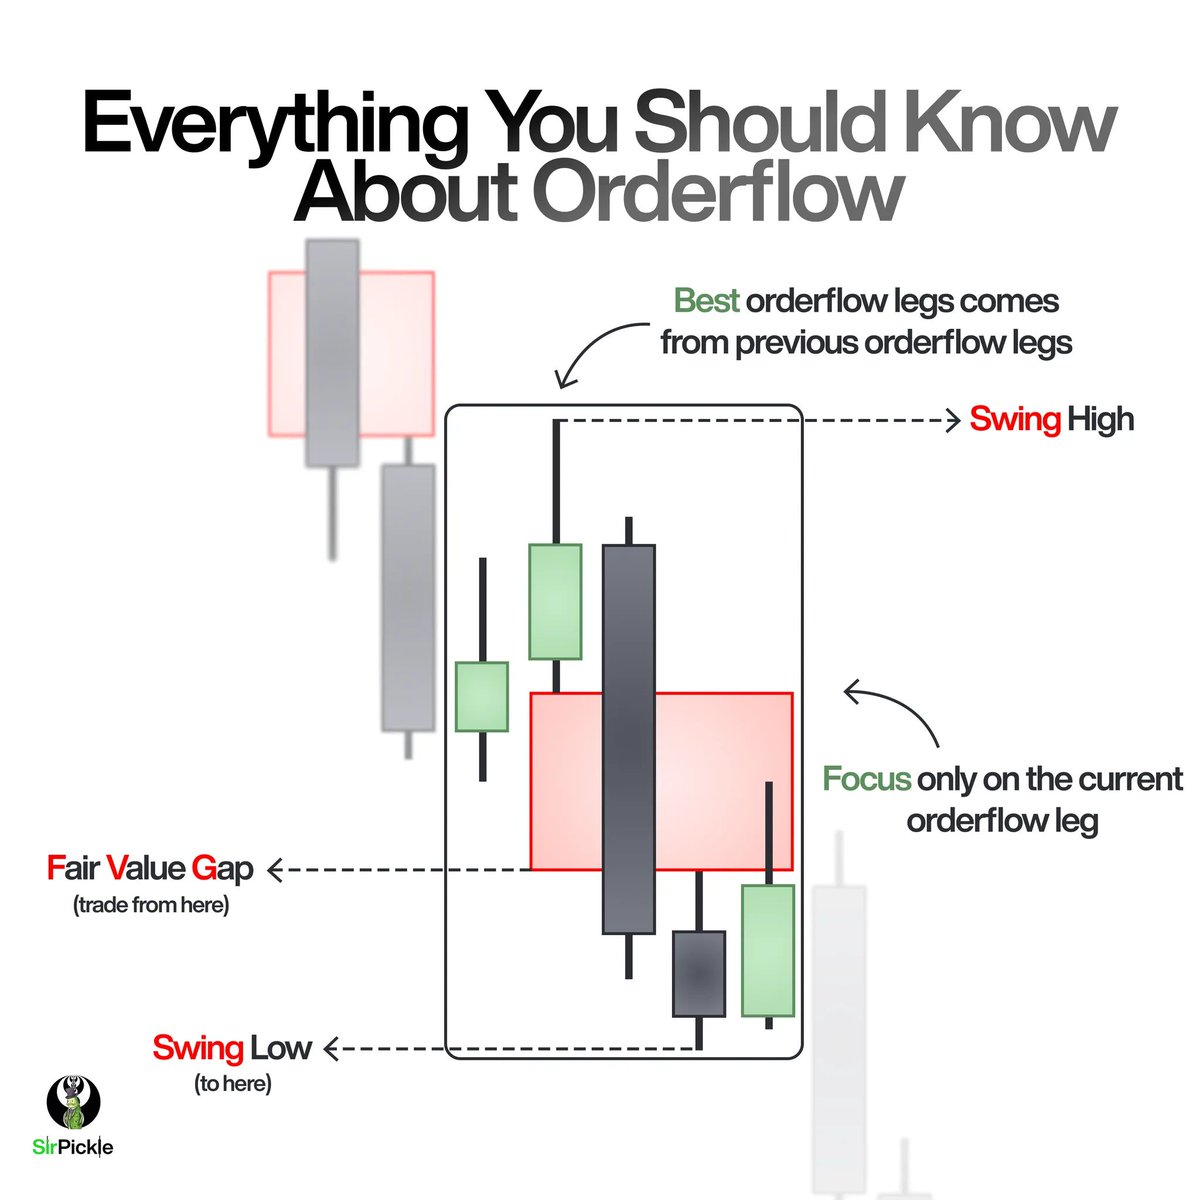
Everything you should know about Orderflow
Orderflow gives you the direction and targets through price legs.
Price legs are formed by swing highs/lows and fair value gaps.
Again, on a bullish orderflow, bullish PD arrays are respected and the opposite for bearish orderflow.
TIP: the best orderflow (price) legs comes from previous orderflow legs.
Lastly, I mainly trade once price retraces to the HTF FVG then we target the swing high/low based on the current orderflow. No orderflow (consolidation) = No trade.
The best case scenario for an impulse shift is when price does this:
1. FVG In: Price creates an FVG into the HTF level, luring traders into the "obvious" trend. 2. FVG Out: Price then displaces sharply away from the level, creating a new FVG and trapping those traders.
Price disrespects the orderflow by making an impulse opposite to the current orderflow. Hence the name, impulse shift.
This is the best way to trade a FVG which failed to expand higher
It's called the โPivot Contextโ, and it opens up an alternative way to frame trades
A thread ๐งต
Before we proceed, you need to know about swing points.
There are two types of swing points:
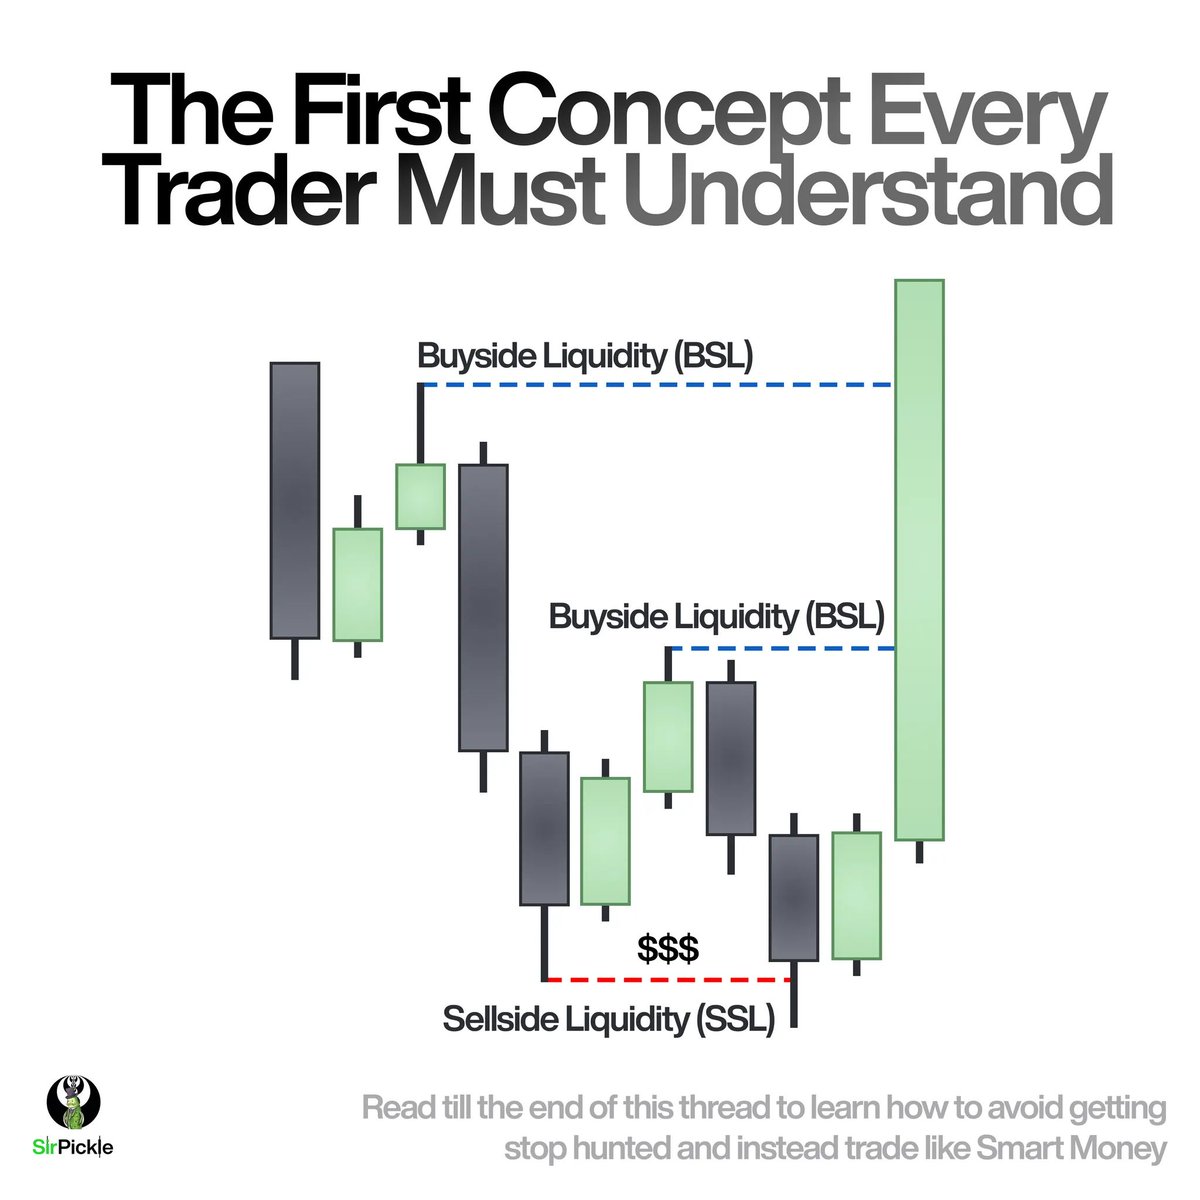
1. ๐ฆ๐๐ถ๐ป๐ด ๐๐ถ๐ด๐ต: A 3-candle pattern forming an inverted V. Buyside liquidity rests above it. 2. ๐ฆ๐๐ถ๐ป๐ด ๐๐ผ๐: A 3-candle pattern forming a V. Sellside liquidity rests below it.
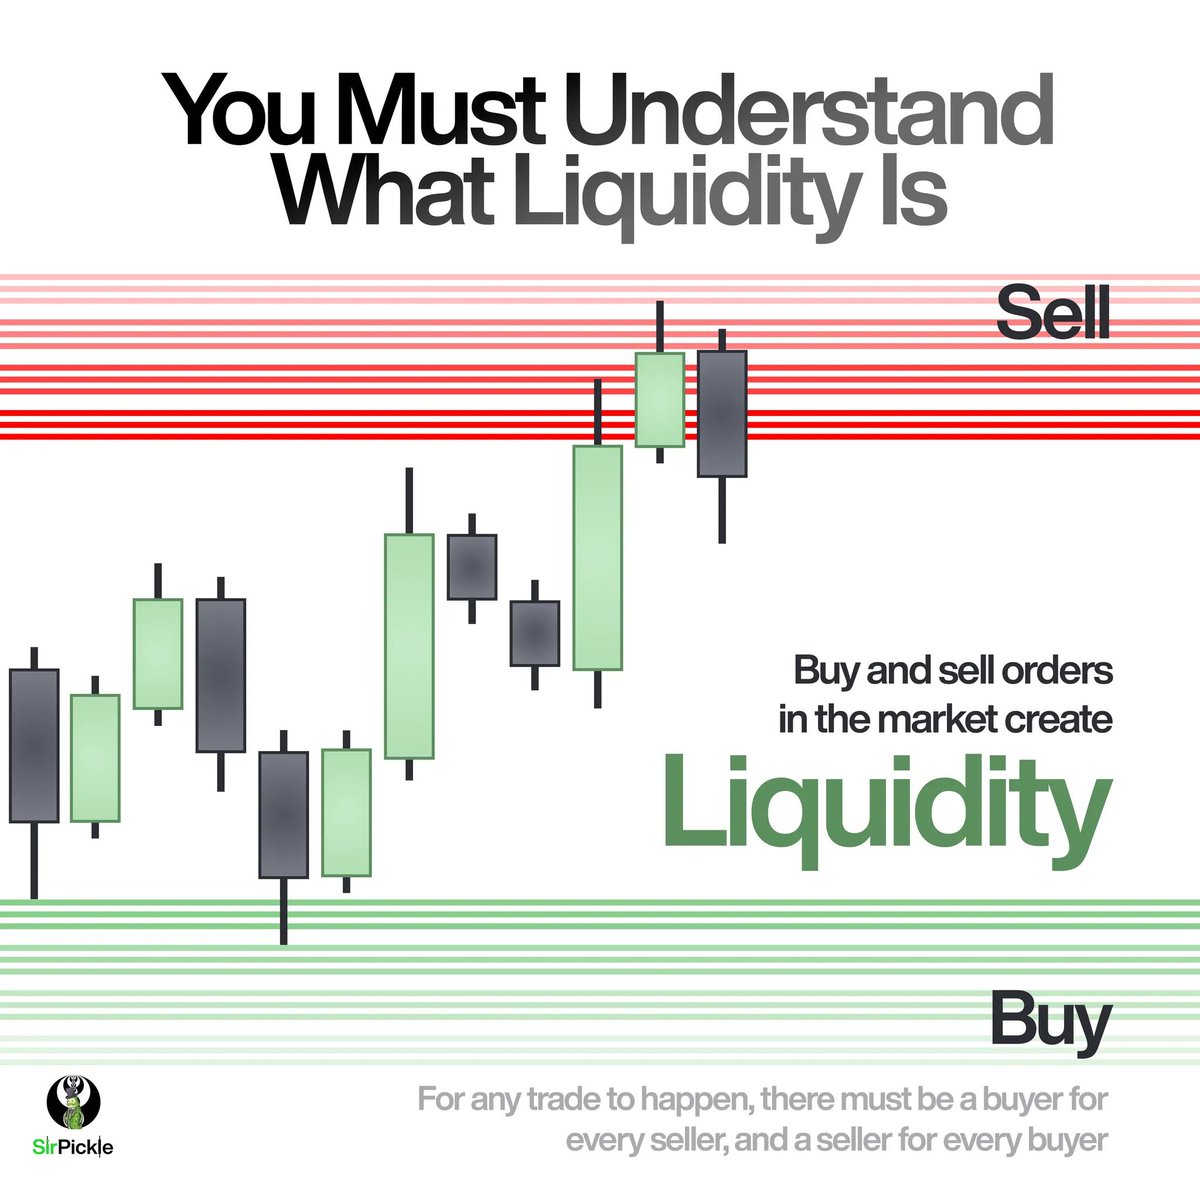
Swing points are important because these are where we find resting liquidities that acts as a magnet for price.
Pivot Context is the move fromย ๐ฆ๐๐ถ๐ป๐ด ๐ฃ๐ผ๐ถ๐ป๐ โ ๐ฆ๐๐ถ๐ป๐ด ๐ฃ๐ผ๐ถ๐ป๐.
It's a continuation pattern. Price takes liquidity at an external range (a swing high/low) and then aggressively seeks the opposing external range liquidity.
There are only two types of price legs: the ones that holdโฆ and the ones that retrace.
Let me oversimplify โHigh-probability Price Legsโ ๐งต๐
What's a Price Leg?
Simply, a swing high and a swing low.
But what makes a price leg ๐ต๐ถ๐ด๐ต-๐ฝ๐ฟ๐ผ๐ฏ๐ฎ๐ฏ๐ถ๐น๐ถ๐๐?
First, its the presence of a Fair Value Gap in that leg๐
Second, magnet theory.
Having a price leg in context of the timeframe above it makes it higher probability.
This means that above the timeframe youโre looking at, there are no FVGs to pull price higher or lower relative to the high-probability leg.
This is also why you should do a top-down analysis and start in the monthly first, looking at the most recent leg, going to the weekly, the daily, and the 4h.