Options models are wrong.
Implied volatility is not the same over the life of an option.
Prove it with volatility surfaces.
Here's how to do it in Python (step by step):
Implied volatility is not the same over the life of an option.
Prove it with volatility surfaces.
Here's how to do it in Python (step by step):
By reading this thread, you’ll be able to:
1. Get live options data
2. Analyze volatility skew
3. Analyze volatility structure
4. Build an implied volatility surface
But first, a primer on implied volatility…
1. Get live options data
2. Analyze volatility skew
3. Analyze volatility structure
4. Build an implied volatility surface
But first, a primer on implied volatility…
If you’re not familiar with implied volatility:
• Market’s expectation of volatility
• Varies across strikes and expirations
• Where most quants and traders spend their time
• The input that sets model and market price equal
Let's build a volatility surface.
• Market’s expectation of volatility
• Varies across strikes and expirations
• Where most quants and traders spend their time
• The input that sets model and market price equal
Let's build a volatility surface.
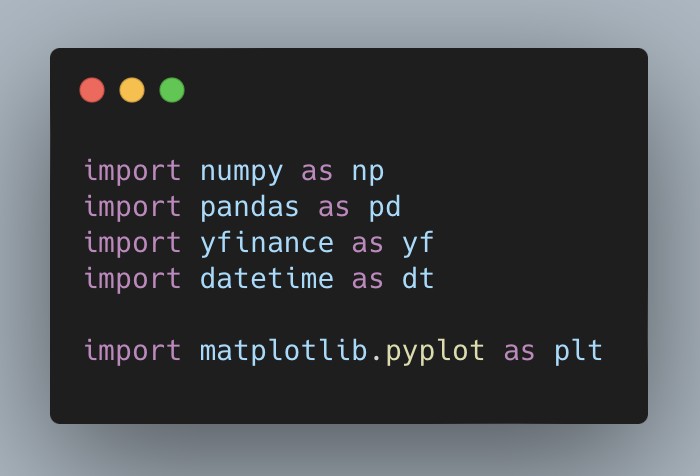
First, import the libraries you need.
yfinance gives you options data - including implied volatility.
Nothing fancy required.
yfinance gives you options data - including implied volatility.
Nothing fancy required.
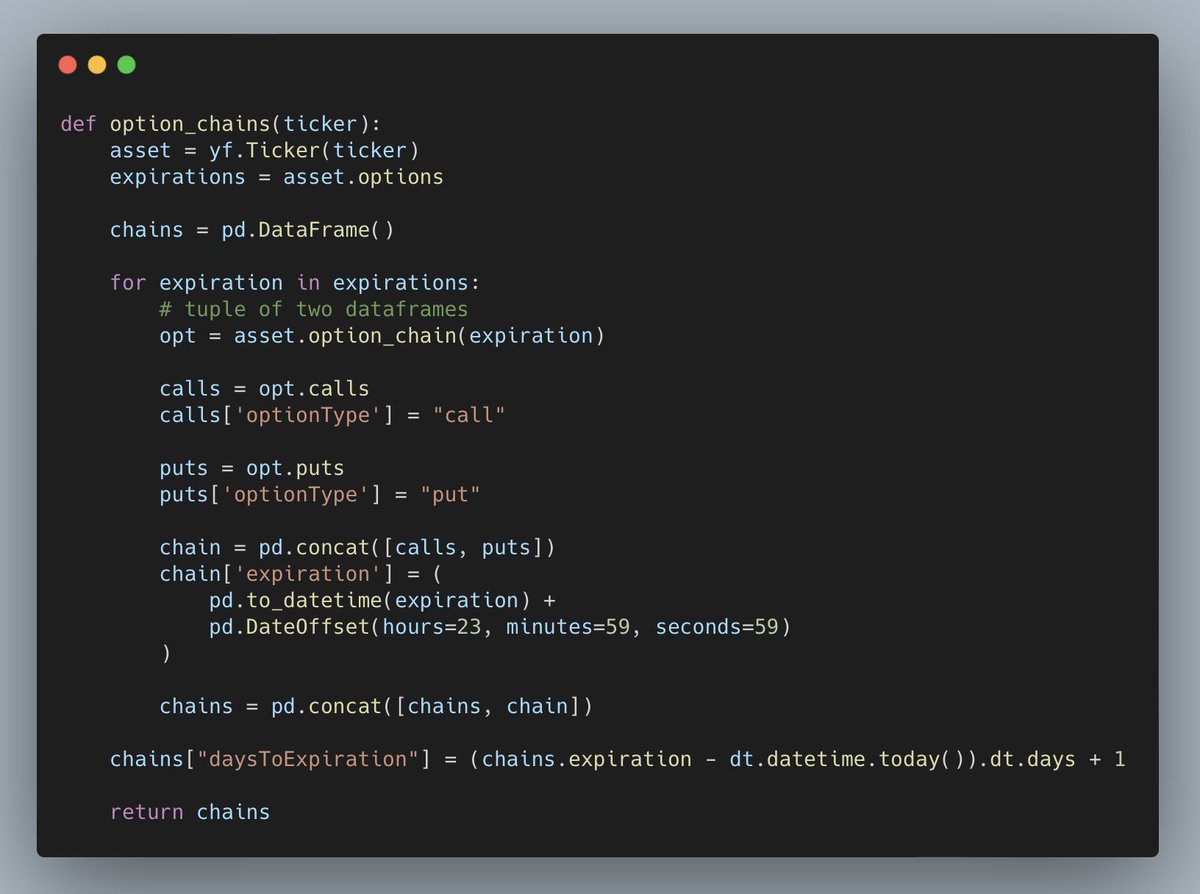
yfinance returns options data for all strikes for a single expiration at a time.
It’s easier to work with all strikes and expirations at the same time.
Write a function to combine the expirations.
It’s easier to work with all strikes and expirations at the same time.
Write a function to combine the expirations.
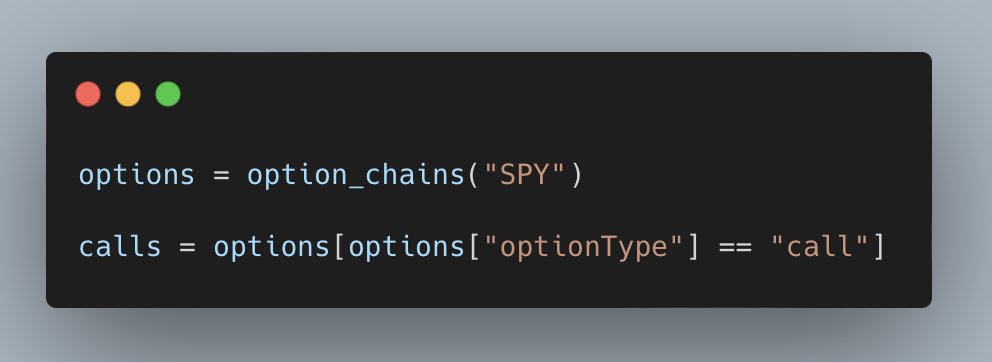
Since we only want to look at calls, filter them out of the DataFrame.
But first, call the function you just built to get the data.
Now you’re ready to look at the volatility skew.
But first, call the function you just built to get the data.
Now you’re ready to look at the volatility skew.
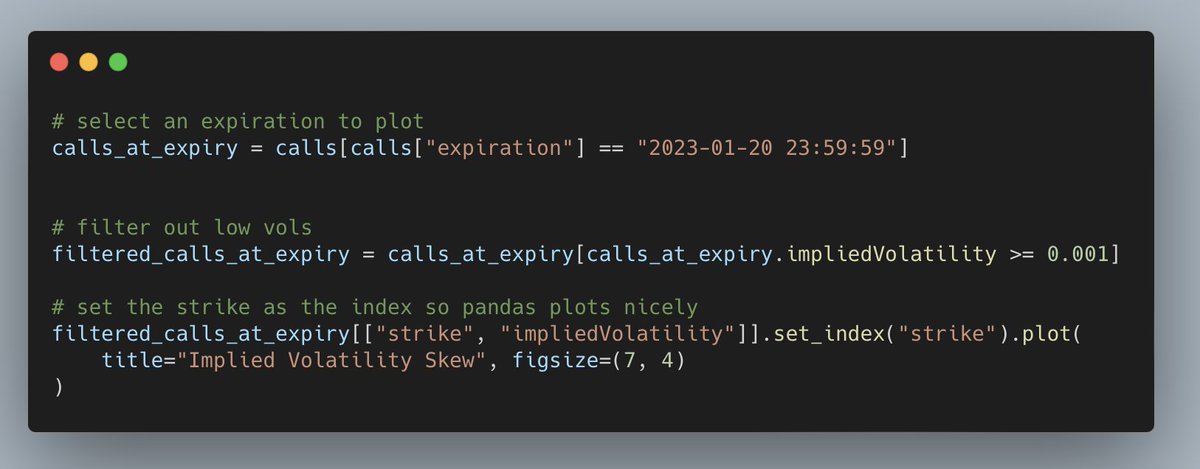
Since the options are in a DataFrame, plotting data is easy.
Next, you can see what the skew looks like.
Next, you can see what the skew looks like.
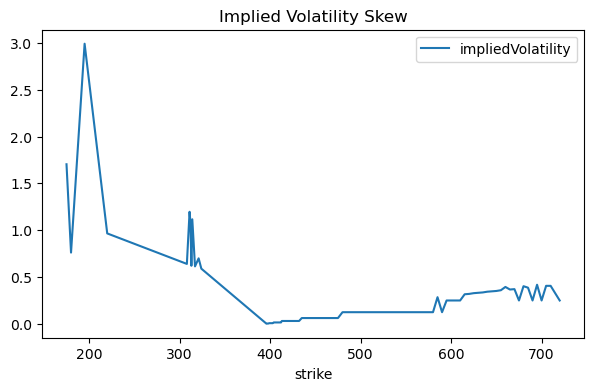
You’ll notice two things:
1. The data are messy
2. Implied volatility varies by strike
In particular it is lowest at the $400 strike, which is right around the stock price.
This is known as volatility smile.
1. The data are messy
2. Implied volatility varies by strike
In particular it is lowest at the $400 strike, which is right around the stock price.
This is known as volatility smile.
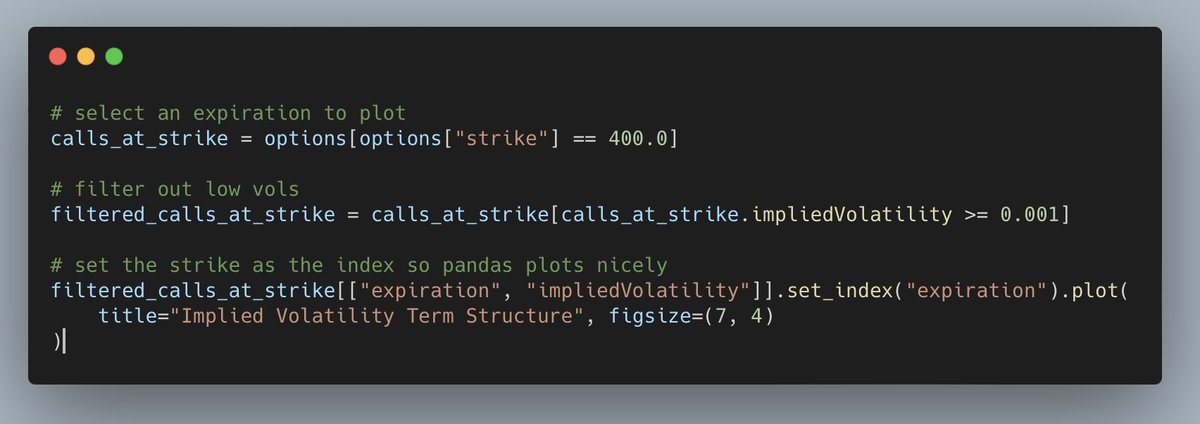
Create a chart of the term structure by selecting a strike.
Plotting is easy with pandas.
Plotting is easy with pandas.
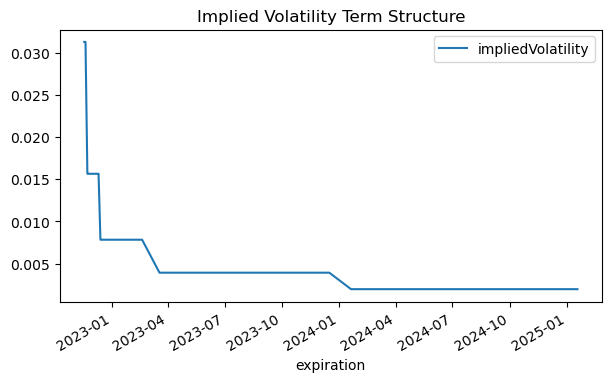
Implied volatility decreases as the expiration dates get further out.
The market expectation of volatility is lower in the future than it is today.
Big economic news causes spikes in the term structure.
Finally, let’s put the two charts together and look at the surface.
The market expectation of volatility is lower in the future than it is today.
Big economic news causes spikes in the term structure.
Finally, let’s put the two charts together and look at the surface.
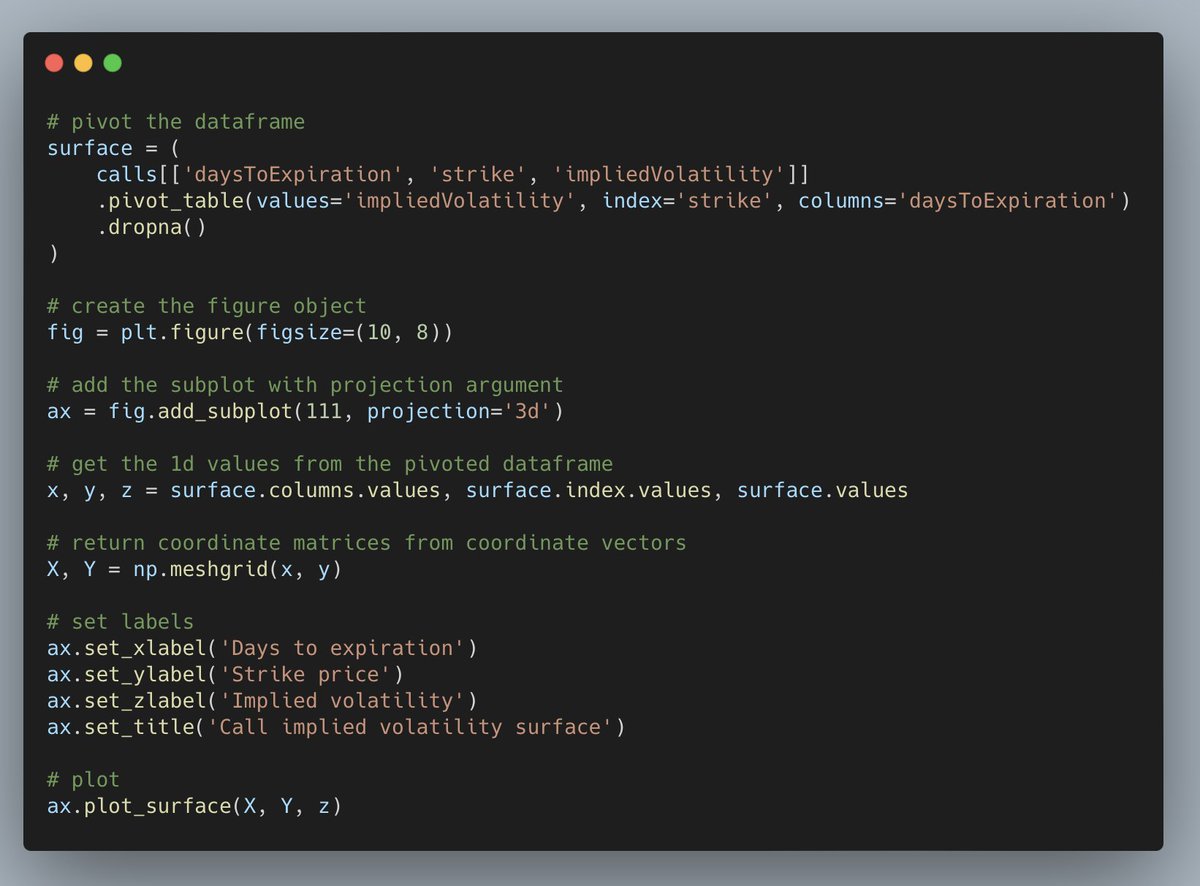
Pivot the DataFrame to arrange strikes on the rows and expirations on the columns. Implied volatility will be in each cell.
Use meshgrid to get the surface coordinates.
Finally, plot the surface with plot_surface.
What do you get?
Use meshgrid to get the surface coordinates.
Finally, plot the surface with plot_surface.
What do you get?
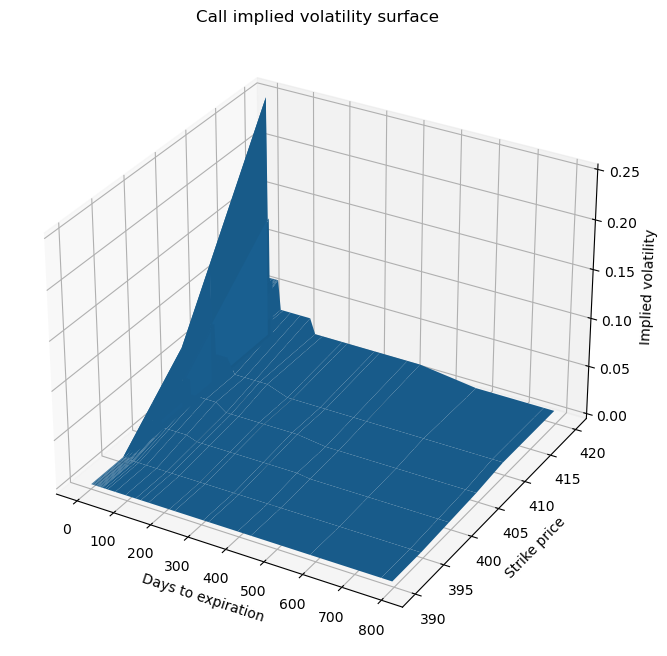
An implied volatility surface!
You can see that volatility is much higher at the close expirations and higher strikes.
Quants use this information to price exotic options and find market mispricings.
You can see that volatility is much higher at the close expirations and higher strikes.
Quants use this information to price exotic options and find market mispricings.
Quants use implied volatity surfaces to:
• Calibrate pricing models
• Find market mispricings
• Price exotic derivatives
You can build a volatility surface too:
1. Get live options data
2. Build skew and structure
3. Plot the implied volatility surface
All in Python.
• Calibrate pricing models
• Find market mispricings
• Price exotic derivatives
You can build a volatility surface too:
1. Get live options data
2. Build skew and structure
3. Plot the implied volatility surface
All in Python.
If you want to come back to this thread later, click the link below and retweet the top tweet.
If you enjoy reading about Python and quant finance, follow me @pyquantnews for more.
If you enjoy reading about Python and quant finance, follow me @pyquantnews for more.
https://twitter.com/3187132960/status/1626210347765096450
If you want to dive deep with options, check out the 46-Page Ultimate Guide to Pricing Options and Implied Volatility With Python.
Here's why:
• Black-Scholes, the greeks, and implied volatility
• Jupyter Notebooks with the code
• Live options data
pyquantnews.gumroad.com/l/46-page-ulti…
Here's why:
• Black-Scholes, the greeks, and implied volatility
• Jupyter Notebooks with the code
• Live options data
pyquantnews.gumroad.com/l/46-page-ulti…
• • •
Missing some Tweet in this thread? You can try to
force a refresh