
1/ While there is a lot of speculation about "what happened" as we moved into the late afternoon session, we think it's pretty clear.
There was a tremendous amount of ITM call delta in the #SPX that was vaporizing, either through monetization or through the expiry...
There was a tremendous amount of ITM call delta in the #SPX that was vaporizing, either through monetization or through the expiry...
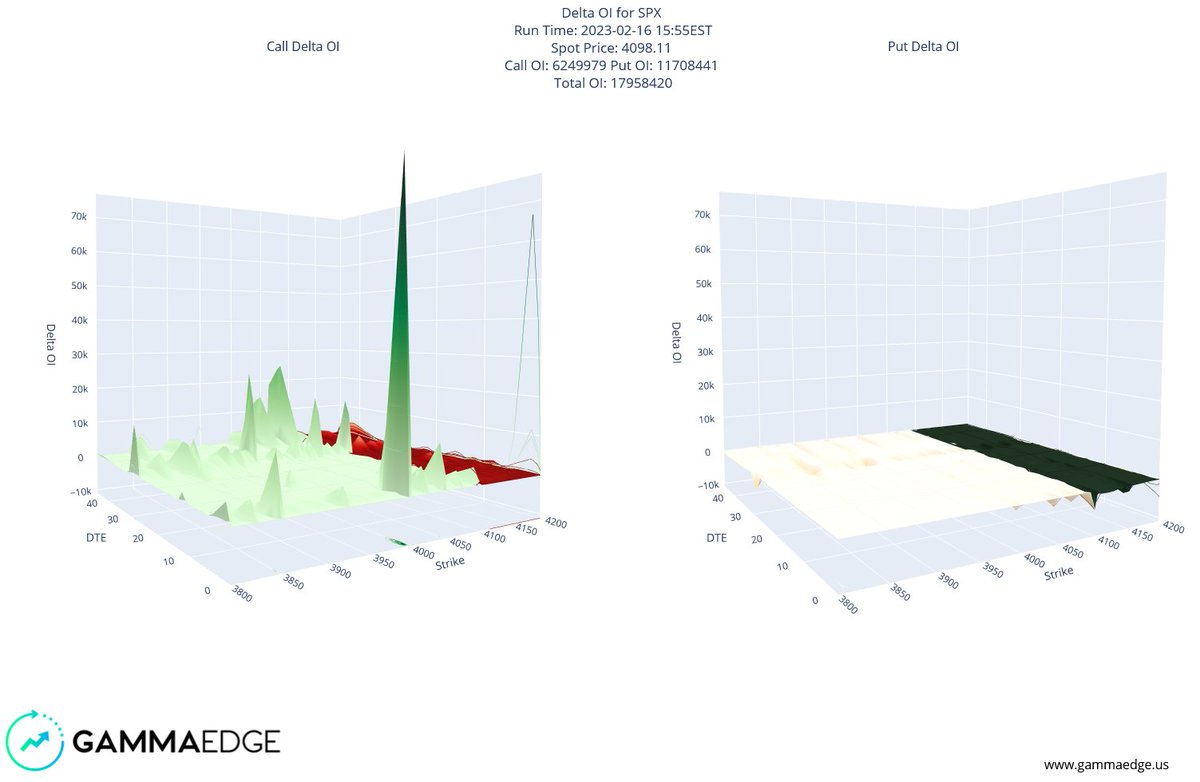
2/ Here is the #SPX delta structure at 2:20 pm ET, with a link for you to interact with:
charts.gammaedge.us/delta_oi_3d_SP…
charts.gammaedge.us/delta_oi_3d_SP…

3/ There is a significant amount of ITM call delta that is on the edge of that surface -- that's today's expiry.
Note the imbalance - little exists over on the put side of the graphic.
As many of you know, as we march through time, the ITM components grow...
Note the imbalance - little exists over on the put side of the graphic.
As many of you know, as we march through time, the ITM components grow...
4/ As we enter the end of the day, that delta, limiting towards +100 / contract, now goes away as dealers must prepare for the AM settlement.
Deltas will close, and this will force the dealers to have to sell to hedge to prior flat positions.
Deltas will close, and this will force the dealers to have to sell to hedge to prior flat positions.
5/ At 3:55 pm ET, with price hovering around 4100, which was a dominant level to begin with, we had an enormous delta level to content with:
6/ We believe that this was the final nail in the day... the adjustments from 3 pm on had been to absorb the EOD estimates of what was remaining, and hence, the downward pressure.
7/ All things considered, we were well within the estimated transition range for today (4080 - 4140), so there were no major surprises.
We discussed this before the open here:
We discussed this before the open here:
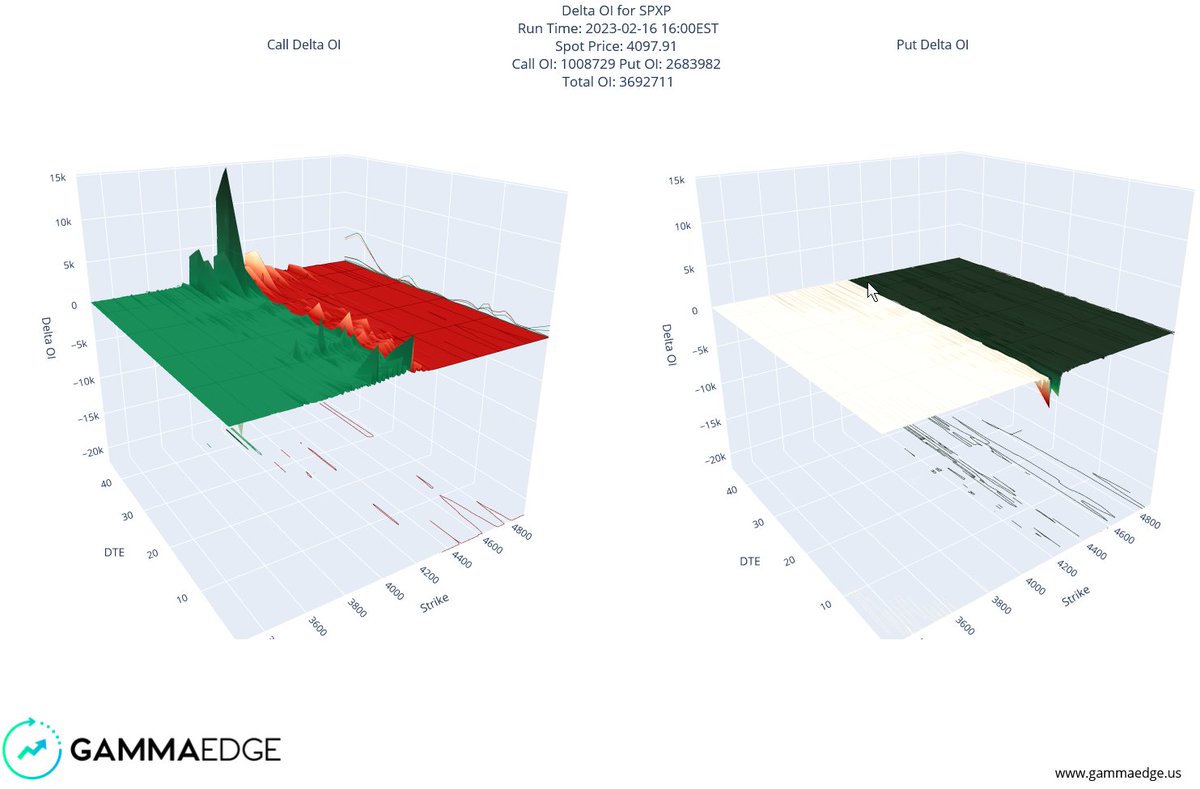
8/ Morning data will confirm our view that we didn't sustain structural damage to the #SPX, as we think there is plenty of call dominance up and down the chain.
Here's a preview for Friday, without the morning data, of the structure:
charts.gammaedge.us/delta_oi_3d_SP…
Here's a preview for Friday, without the morning data, of the structure:
charts.gammaedge.us/delta_oi_3d_SP…
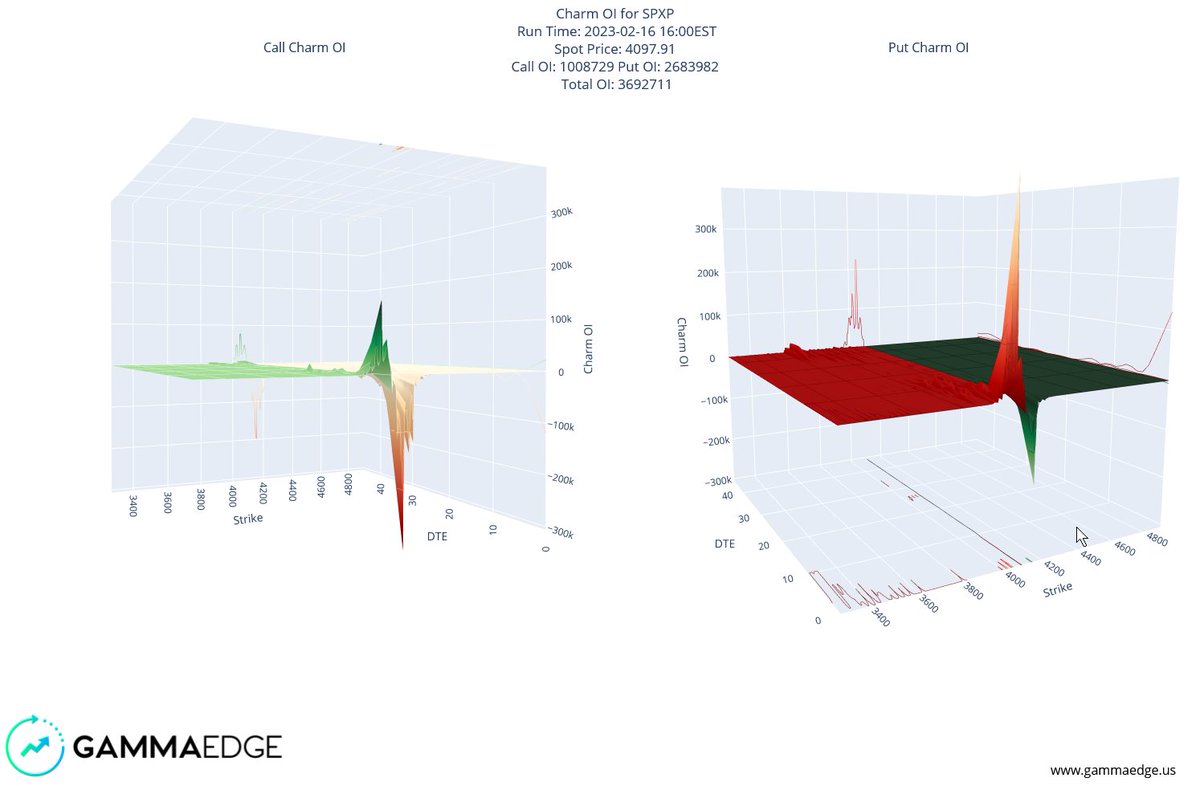
9/ ... and here is #SPX charm, within an interactive link so that you can see what is in play:
charts.gammaedge.us/charm_oi_3d_SP…
charts.gammaedge.us/charm_oi_3d_SP…
• • •
Missing some Tweet in this thread? You can try to
force a refresh


