
𝗛𝗼𝘄 𝘁𝗼 𝗰𝗿𝗲𝗮𝘁𝗲 𝘆𝗼𝘂𝗿 𝗼𝘄𝗻 𝗖𝗵𝗮𝗿𝘁𝗶𝗻𝗸 𝗦𝗰𝗿𝗲𝗲𝗻𝗲𝗿
🧵 Thread 🧵
[1/15]
🧵 Thread 🧵
[1/15]
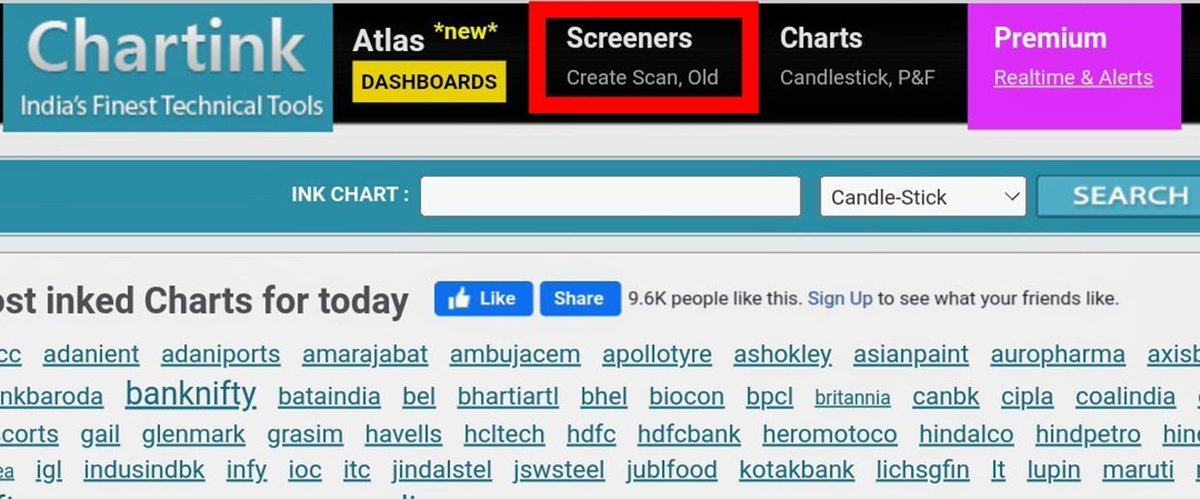
𝗖𝗵𝗮𝗿𝘁𝗶𝗻𝗸 𝗦𝗰𝗿𝗲𝗲𝗻𝗲𝗿 is a Stock screening tool that is useful to screen stocks based on Technical & Fundamentals.
🔸 It scans stocks by using technical indicators like RSI, MACD, divergences, etc.
🔸 It also uses fundamental tools like Book Value, EPS,PE etc
[2/15]
🔸 It scans stocks by using technical indicators like RSI, MACD, divergences, etc.
🔸 It also uses fundamental tools like Book Value, EPS,PE etc
[2/15]
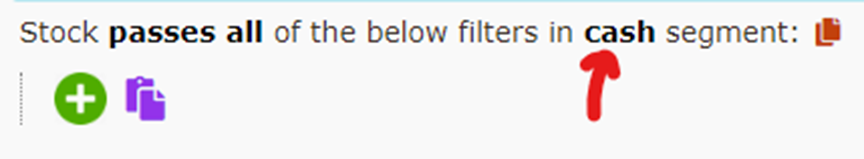
𝗙𝗶𝗿𝘀𝘁 𝗦𝘁𝗲𝗽 𝗧𝗼 𝗙𝗶𝗹𝘁𝗲𝗿 𝗦𝘁𝗼𝗰𝗸𝘀
We can select segments of stocks of our choice, e.g. cash or futures stocks, Nifty 100 etc.
Click on green ‘+’ icon to add conditions.
[4/15]
We can select segments of stocks of our choice, e.g. cash or futures stocks, Nifty 100 etc.
Click on green ‘+’ icon to add conditions.
[4/15]

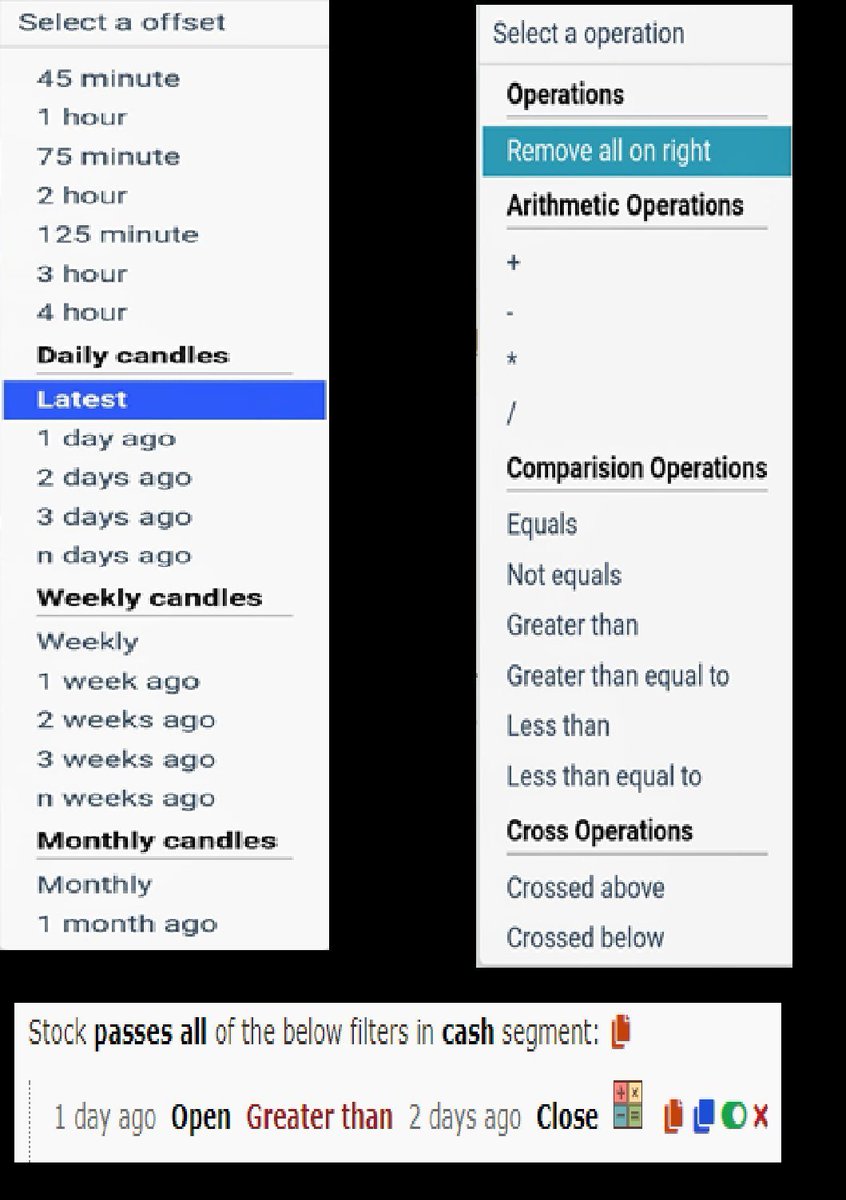
𝗖𝗮𝗻𝗱𝗹𝗲 𝗧𝗶𝗺𝗲𝗳𝗿𝗮𝗺𝗲𝘀 & 𝗖𝗼𝗺𝗽𝗮𝗿𝗶𝘀𝗼𝗻 𝗢𝗽𝗲𝗿𝗮𝘁𝗼𝗿𝘀
🔸 We can select any timeframe of candles in Chartink, from minutes to years.
🔸 And compare two candles using comparison operators like 𝘌𝘲𝘶𝘢𝘭 𝘵𝘰 or 𝘎𝘳𝘦𝘢𝘵𝘦𝘳 𝘛𝘩𝘢𝘯 , crossovers etc
[5/15]
🔸 We can select any timeframe of candles in Chartink, from minutes to years.
🔸 And compare two candles using comparison operators like 𝘌𝘲𝘶𝘢𝘭 𝘵𝘰 or 𝘎𝘳𝘦𝘢𝘵𝘦𝘳 𝘛𝘩𝘢𝘯 , crossovers etc
[5/15]
Example: 𝗥𝗦𝗜 , 𝗘𝗠𝗔 𝗮𝗻𝗱 𝗠𝗔𝗖𝗗
🔸 Daily RSI greater than 70 & close above EMA 50
🔸 Latest means Daily timeframe 1 day ago means Yesterday and so on
🔸 MACD Bearish or Bullish Cross
[6/15]
🔸 Daily RSI greater than 70 & close above EMA 50
🔸 Latest means Daily timeframe 1 day ago means Yesterday and so on
🔸 MACD Bearish or Bullish Cross
[6/15]


𝗜𝗻𝘀𝗶𝗱𝗲 𝗕𝗮𝗿 𝗖𝗮𝗻𝗱𝗹𝗲
🔸 An Inside Bar is a candle that’s “covered” by the prior candle.
🔸 Scan to filter stocks from Nifty 500 where the latest 15 minutes candle is an inside bar.
🔸 [0] means latest candle & [-1] means previous candle
[7/15]
🔸 An Inside Bar is a candle that’s “covered” by the prior candle.
🔸 Scan to filter stocks from Nifty 500 where the latest 15 minutes candle is an inside bar.
🔸 [0] means latest candle & [-1] means previous candle
[7/15]

𝗠𝗼𝘃𝗶𝗻𝗴 𝗔𝘃𝗲𝗿𝗮𝗴𝗲 𝗖𝗿𝗼𝘀𝘀𝗼𝘃𝗲𝗿,𝗩𝗼𝗹𝘂𝗺𝗲 𝗖𝗼𝗻𝗱𝗶𝘁𝗶𝗼𝗻 & %𝗖𝗵𝗮𝗻𝗴𝗲
🔸 20 EMA crossing above 50 EMA
🔸 Latest Volume greater than 1.5 times of 20 days average volume.
🔸 % Change more than 2%
[8/15]
🔸 20 EMA crossing above 50 EMA
🔸 Latest Volume greater than 1.5 times of 20 days average volume.
🔸 % Change more than 2%
[8/15]

𝗕𝘂𝗹𝗹𝗶𝘀𝗵 𝗗𝗶𝘃𝗲𝗿𝗴𝗲𝗻𝗰𝗲 𝗦𝗰𝗮𝗻
🔸 Divergence means that the indicator is moving in the opposite direction compared to the price.
🔸 If RSI is making higher highs-higher lows while the price is making lower highs-lower lows, it is termed as Bullish Divergence.
[9/15
🔸 Divergence means that the indicator is moving in the opposite direction compared to the price.
🔸 If RSI is making higher highs-higher lows while the price is making lower highs-lower lows, it is termed as Bullish Divergence.
[9/15


𝟱𝟮 𝗪𝗲𝗲𝗸𝘀 𝗛𝗶𝗴𝗵 𝗕𝗿𝗲𝗮𝗸𝗼𝘂𝘁 & 𝗡𝗲𝗮𝗿 𝟱𝟮 𝗪𝗲𝗲𝗸𝘀 𝗟𝗼𝘄
🔸 Future stocks closing above 52 weeks high or 252 days high.
🔸 Stocks near 52 weeks low zone, maximum 10% above 52 weeks low.
[10/15]
🔸 Future stocks closing above 52 weeks high or 252 days high.
🔸 Stocks near 52 weeks low zone, maximum 10% above 52 weeks low.
[10/15]


𝗙𝘂𝗻𝗱𝗮𝗺𝗲𝗻𝘁𝗮𝗹 𝗦𝗰𝗮𝗻𝘀
🔸 Stocks with 200% yearly profit jump.
🔸 Stocks with market cap more than 3000 Cr & paying more than 100% dividend.
[11/15]
🔸 Stocks with 200% yearly profit jump.
🔸 Stocks with market cap more than 3000 Cr & paying more than 100% dividend.
[11/15]


Youtube Video Part 1 : Basics of Chartink Screener
Part 2: Indicator :
[12/15]
Part 2: Indicator :
[12/15]
9 Imp Chartink Screener :
[13/15]
https://twitter.com/JayneshKasliwal/status/1507325237880561668?s=20
[13/15]
Download the Techno Charts Android App :
bit.ly/TechnoChartsApp and get Free Access to Course
iOS - apps.apple.com/in/app/myinsti…
Org Code - CDGWMO
[14/15]
bit.ly/TechnoChartsApp and get Free Access to Course
iOS - apps.apple.com/in/app/myinsti…
Org Code - CDGWMO
[14/15]
• • •
Missing some Tweet in this thread? You can try to
force a refresh


