
𝟱 𝗖𝗼𝗼𝗹 𝗧𝗿𝗮𝗱𝗶𝗻𝗴𝘃𝗶𝗲𝘄 𝗜𝗻𝗱𝗶𝗰𝗮𝘁𝗼𝗿𝘀 𝗔𝗹𝗹 𝗧𝗿𝗮𝗱𝗲𝗿𝘀 𝘀𝗵𝗼𝘂𝗹𝗱 𝗸𝗻𝗼𝘄
🧵 𝗧𝗵𝗿𝗲𝗮𝗱 🧵
🧵 𝗧𝗵𝗿𝗲𝗮𝗱 🧵
🔸 𝗦𝘂𝗽𝗽𝗼𝗿𝘁 𝗥𝗲𝘀𝗶𝘀𝘁𝗮𝗻𝗰𝗲 𝗗𝘆𝗻𝗮𝗺𝗶𝗰
1️⃣ Tired of drawing S/R on different time frames , this indicator automatically plot S/R on charts on different time frames
2️⃣ Works on all time frames
𝘐𝘯𝘥𝘪𝘤𝘢𝘵𝘰𝘳 𝘓𝘪𝘯𝘬 : tradingview.com/v/va09eWAp/
[2/9]
1️⃣ Tired of drawing S/R on different time frames , this indicator automatically plot S/R on charts on different time frames
2️⃣ Works on all time frames
𝘐𝘯𝘥𝘪𝘤𝘢𝘵𝘰𝘳 𝘓𝘪𝘯𝘬 : tradingview.com/v/va09eWAp/
[2/9]


🔸 𝗧𝗿𝗮𝗱𝗲𝗿 𝗟𝗶𝗼𝗻'𝘀 𝗘𝗻𝗵𝗮𝗻𝗰𝗲𝗱 𝗩𝗼𝗹𝘂𝗺𝗲
1️⃣ Gives Advance Volume Analytics about Highest volume , lowest volumes in certain period.
2️⃣ Helps to understand Accumultion and Disctrbution characteristics
𝘐𝘯𝘥𝘪𝘤𝘢𝘵𝘰𝘳 𝘓𝘪𝘯𝘬 :tradingview.com/v/yzjhAo0E/ [3/9]
1️⃣ Gives Advance Volume Analytics about Highest volume , lowest volumes in certain period.
2️⃣ Helps to understand Accumultion and Disctrbution characteristics
𝘐𝘯𝘥𝘪𝘤𝘢𝘵𝘰𝘳 𝘓𝘪𝘯𝘬 :tradingview.com/v/yzjhAo0E/ [3/9]

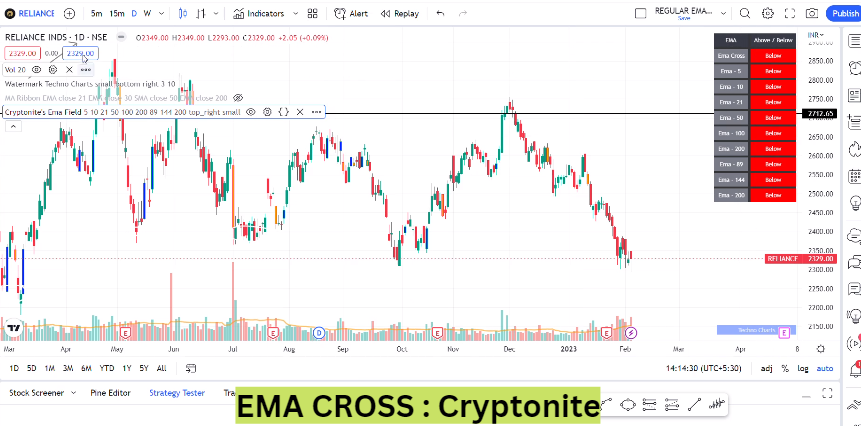
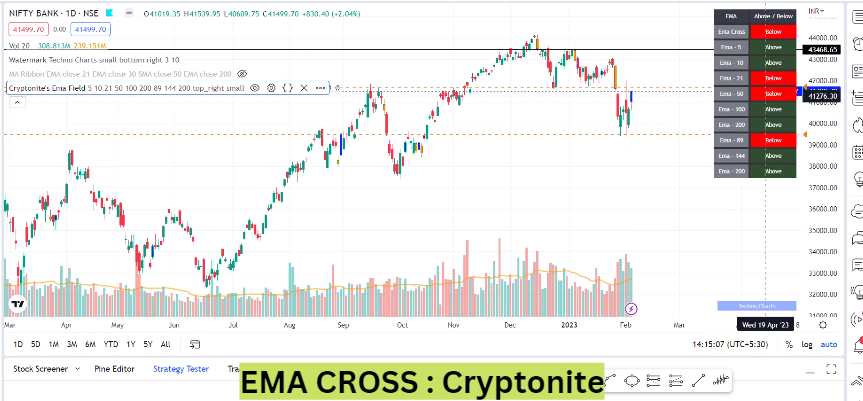
🔸 𝗖𝗿𝘆𝗽𝘁𝗼𝗻𝗶𝘁𝗲𝘀 𝗘𝗠𝗔 𝗳𝗲𝗶𝗹𝗱
1️⃣ Helps to understand the status of multiple moving averages whether a stock is above or below a certain moving average
𝘐𝘯𝘥𝘪𝘤𝘢𝘵𝘰𝘳 𝘓𝘪𝘯𝘬 :tradingview.com/v/ped6mtTd/
[4/9]
1️⃣ Helps to understand the status of multiple moving averages whether a stock is above or below a certain moving average
𝘐𝘯𝘥𝘪𝘤𝘢𝘵𝘰𝘳 𝘓𝘪𝘯𝘬 :tradingview.com/v/ped6mtTd/
[4/9]
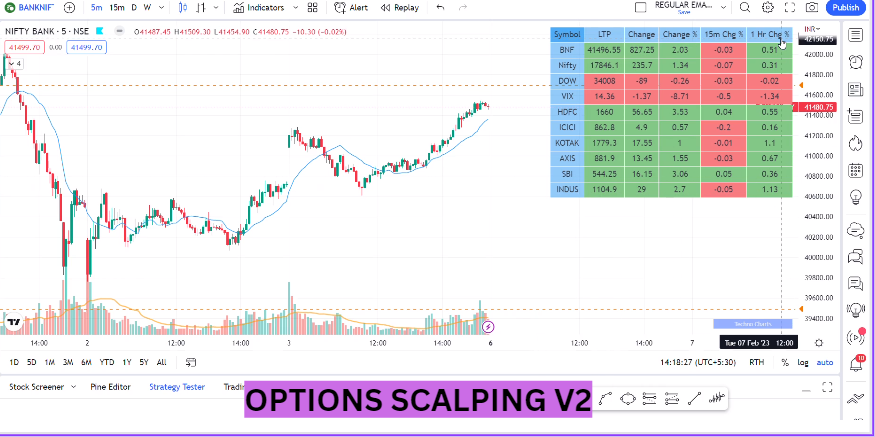
🔸 𝗢𝗽𝘁𝗶𝗼𝗻𝘀 𝗦𝗰𝗮𝗹𝗽𝗶𝗻𝗴 𝗩𝟮:
1️⃣ Good for options trader to understand the trend of banknifty stocks
2️⃣ Can Add Supertrend , VWAP , PSAR and MAs in one single Indicator
𝘐𝘯𝘥𝘪𝘤𝘢𝘵𝘰𝘳 Link :tradingview.com/v/Bkk3ZdiR/
[5/9]
1️⃣ Good for options trader to understand the trend of banknifty stocks
2️⃣ Can Add Supertrend , VWAP , PSAR and MAs in one single Indicator
𝘐𝘯𝘥𝘪𝘤𝘢𝘵𝘰𝘳 Link :tradingview.com/v/Bkk3ZdiR/
[5/9]
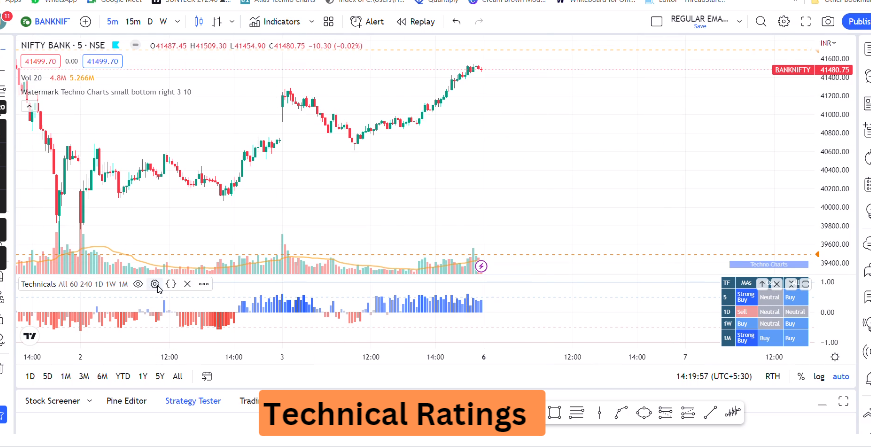
🔸 𝗧𝗲𝗰𝗵𝗻𝗶𝗰𝗮𝗹 𝗥𝗮𝘁𝗶𝗻𝗴𝘀
1️⃣ Helps You to understand the trend of Moving Averages and Oscilators and based on different time frame analysis You can take a decision
2️⃣ 𝘐𝘯𝘥𝘪𝘤𝘢𝘵𝘰𝘳 𝘓𝘪𝘯𝘬 : tradingview.com/chart/oBJxaX1x/
[6/9]
1️⃣ Helps You to understand the trend of Moving Averages and Oscilators and based on different time frame analysis You can take a decision
2️⃣ 𝘐𝘯𝘥𝘪𝘤𝘢𝘵𝘰𝘳 𝘓𝘪𝘯𝘬 : tradingview.com/chart/oBJxaX1x/
[6/9]
Watch this Video on how to Use these Indicators:
[8/9]
[8/9]
𝗗𝗼𝘄𝗻𝗹𝗼𝗮𝗱 𝗢𝘂𝗿 𝗔𝗽𝗽 𝗮𝗻𝗱 𝗴𝗲𝘁 𝗙𝗿𝗲𝗲 𝗔𝗹𝗴𝗼 𝗧𝗿𝗮𝗱𝗶𝗻𝗴 𝗖𝗼𝘂𝗿𝘀𝗲
Android - play.google.com/store/apps/det…
iOS - apps.apple.com/in/app/myinsti…
Org Code - CDGWMO
[9/9]
Android - play.google.com/store/apps/det…
iOS - apps.apple.com/in/app/myinsti…
Org Code - CDGWMO
[9/9]
If you like this thread please retweet the first tweet and follow me for more!
https://twitter.com/JayneshKasliwal/status/1627323245719433216
• • •
Missing some Tweet in this thread? You can try to
force a refresh


