JayneshKasliwal Profile picture
Feb 19 โ€ข 10 tweets โ€ข 5 min read
๐Ÿฑ ๐—–๐—ผ๐—ผ๐—น ๐—ง๐—ฟ๐—ฎ๐—ฑ๐—ถ๐—ป๐—ด๐˜ƒ๐—ถ๐—ฒ๐˜„ ๐—œ๐—ป๐—ฑ๐—ถ๐—ฐ๐—ฎ๐˜๐—ผ๐—ฟ๐˜€ ๐—”๐—น๐—น ๐—ง๐—ฟ๐—ฎ๐—ฑ๐—ฒ๐—ฟ๐˜€ ๐˜€๐—ต๐—ผ๐˜‚๐—น๐—ฑ ๐—ธ๐—ป๐—ผ๐˜„
๐Ÿงต ๐—ง๐—ต๐—ฟ๐—ฒ๐—ฎ๐—ฑ ๐Ÿงต
๐Ÿ”ธ ๐—ฆ๐˜‚๐—ฝ๐—ฝ๐—ผ๐—ฟ๐˜ ๐—ฅ๐—ฒ๐˜€๐—ถ๐˜€๐˜๐—ฎ๐—ป๐—ฐ๐—ฒ ๐——๐˜†๐—ป๐—ฎ๐—บ๐—ถ๐—ฐ
1๏ธโƒฃ Tired of drawing S/R on different time frames , this indicator automatically plot S/R on charts on different time frames
2๏ธโƒฃ Works on all time frames
๐˜๐˜ฏ๐˜ฅ๐˜ช๐˜ค๐˜ข๐˜ต๐˜ฐ๐˜ณ ๐˜“๐˜ช๐˜ฏ๐˜ฌ : tradingview.com/v/va09eWAp/
[2/9]
๐Ÿ”ธ ๐—ง๐—ฟ๐—ฎ๐—ฑ๐—ฒ๐—ฟ ๐—Ÿ๐—ถ๐—ผ๐—ป'๐˜€ ๐—˜๐—ป๐—ต๐—ฎ๐—ป๐—ฐ๐—ฒ๐—ฑ ๐—ฉ๐—ผ๐—น๐˜‚๐—บ๐—ฒ
1๏ธโƒฃ Gives Advance Volume Analytics about Highest volume , lowest volumes in certain period.
2๏ธโƒฃ Helps to understand Accumultion and Disctrbution characteristics

๐˜๐˜ฏ๐˜ฅ๐˜ช๐˜ค๐˜ข๐˜ต๐˜ฐ๐˜ณ ๐˜“๐˜ช๐˜ฏ๐˜ฌ :tradingview.com/v/yzjhAo0E/ [3/9]
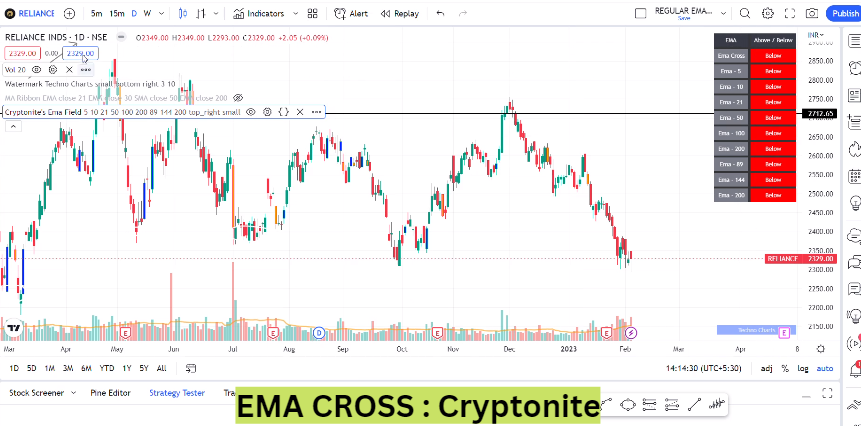
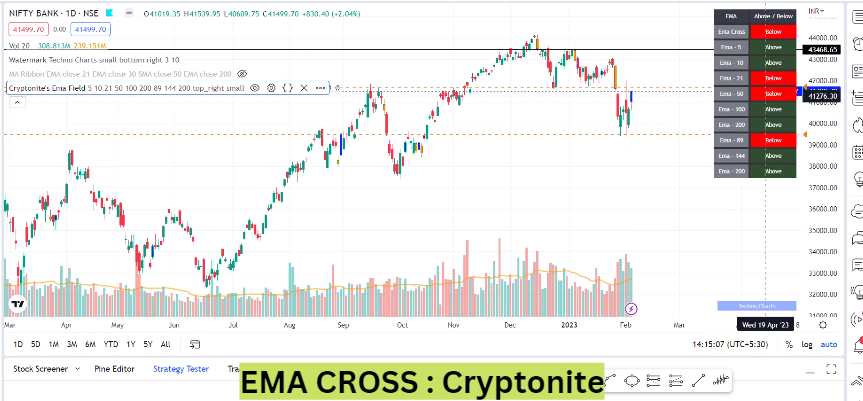
๐Ÿ”ธ ๐—–๐—ฟ๐˜†๐—ฝ๐˜๐—ผ๐—ป๐—ถ๐˜๐—ฒ๐˜€ ๐—˜๐— ๐—” ๐—ณ๐—ฒ๐—ถ๐—น๐—ฑ
1๏ธโƒฃ Helps to understand the status of multiple moving averages whether a stock is above or below a certain moving average
๐˜๐˜ฏ๐˜ฅ๐˜ช๐˜ค๐˜ข๐˜ต๐˜ฐ๐˜ณ ๐˜“๐˜ช๐˜ฏ๐˜ฌ :tradingview.com/v/ped6mtTd/

[4/9]
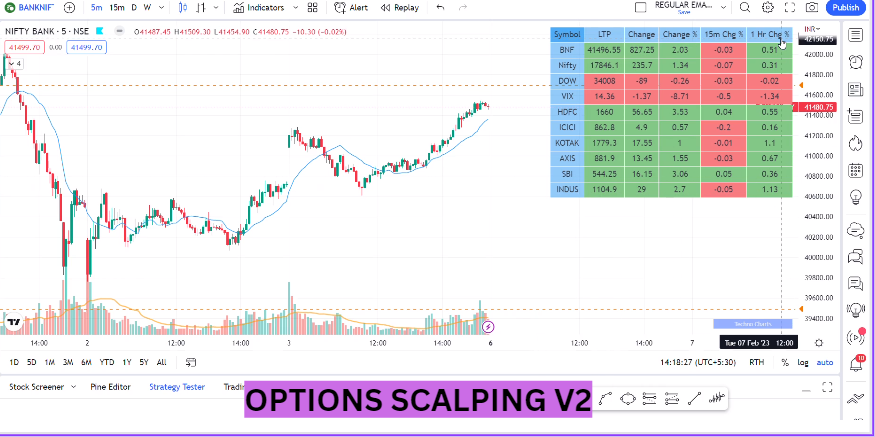
๐Ÿ”ธ ๐—ข๐—ฝ๐˜๐—ถ๐—ผ๐—ป๐˜€ ๐—ฆ๐—ฐ๐—ฎ๐—น๐—ฝ๐—ถ๐—ป๐—ด ๐—ฉ๐Ÿฎ:
1๏ธโƒฃ Good for options trader to understand the trend of banknifty stocks
2๏ธโƒฃ Can Add Supertrend , VWAP , PSAR and MAs in one single Indicator
๐˜๐˜ฏ๐˜ฅ๐˜ช๐˜ค๐˜ข๐˜ต๐˜ฐ๐˜ณ Link :tradingview.com/v/Bkk3ZdiR/
[5/9]
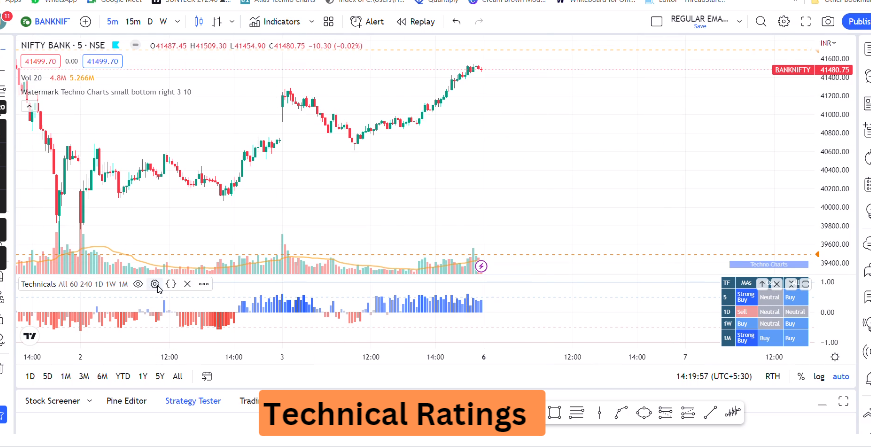
๐Ÿ”ธ ๐—ง๐—ฒ๐—ฐ๐—ต๐—ป๐—ถ๐—ฐ๐—ฎ๐—น ๐—ฅ๐—ฎ๐˜๐—ถ๐—ป๐—ด๐˜€
1๏ธโƒฃ Helps You to understand the trend of Moving Averages and Oscilators and based on different time frame analysis You can take a decision
2๏ธโƒฃ ๐˜๐˜ฏ๐˜ฅ๐˜ช๐˜ค๐˜ข๐˜ต๐˜ฐ๐˜ณ ๐˜“๐˜ช๐˜ฏ๐˜ฌ : tradingview.com/chart/oBJxaX1x/

[6/9]
๐—๐—ผ๐—ถ๐—ป ๐—ง๐—ฒ๐—น๐—ฒ๐—ด๐—ฟ๐—ฎ๐—บ ๐—–๐—ต๐—ฎ๐—ป๐—ป๐—ฒ๐—น ๐—ณ๐—ผ๐—ฟ ๐—ฐ๐—ผ๐—ผ๐—น ๐—ง๐—ฟ๐—ฎ๐—ฑ๐—ถ๐—ป๐—ด ๐—ฆ๐˜๐˜‚๐—ณ๐—ณ :
t.me/Techno_charts
[7/9]
Watch this Video on how to Use these Indicators:
[8/9]
๐——๐—ผ๐˜„๐—ป๐—น๐—ผ๐—ฎ๐—ฑ ๐—ข๐˜‚๐—ฟ ๐—”๐—ฝ๐—ฝ ๐—ฎ๐—ป๐—ฑ ๐—ด๐—ฒ๐˜ ๐—™๐—ฟ๐—ฒ๐—ฒ ๐—”๐—น๐—ด๐—ผ ๐—ง๐—ฟ๐—ฎ๐—ฑ๐—ถ๐—ป๐—ด ๐—–๐—ผ๐˜‚๐—ฟ๐˜€๐—ฒ

Android - play.google.com/store/apps/detโ€ฆ

iOS - apps.apple.com/in/app/myinstiโ€ฆ
Org Code - CDGWMO
[9/9]
If you like this thread please retweet the first tweet and follow me for more!

โ€ข โ€ข โ€ข

Missing some Tweet in this thread? You can try to force a refresh
ใ€€

Keep Current with JayneshKasliwal

JayneshKasliwal Profile picture

Stay in touch and get notified when new unrolls are available from this author!

Read all threads

This Thread may be Removed Anytime!

PDF

Twitter may remove this content at anytime! Save it as PDF for later use!

Try unrolling a thread yourself!

how to unroll video
  1. Follow @ThreadReaderApp to mention us!

  2. From a Twitter thread mention us with a keyword "unroll"
@threadreaderapp unroll

Practice here first or read more on our help page!

More from @JayneshKasliwal

Feb 17
๐—›๐—ผ๐˜„ ๐˜๐—ผ ๐—ฐ๐—ฟ๐—ฒ๐—ฎ๐˜๐—ฒ ๐˜†๐—ผ๐˜‚๐—ฟ ๐—ผ๐˜„๐—ป ๐—–๐—ต๐—ฎ๐—ฟ๐˜๐—ถ๐—ป๐—ธ ๐—ฆ๐—ฐ๐—ฟ๐—ฒ๐—ฒ๐—ป๐—ฒ๐—ฟ

๐Ÿงต Thread ๐Ÿงต
[1/15]
๐—–๐—ต๐—ฎ๐—ฟ๐˜๐—ถ๐—ป๐—ธ ๐—ฆ๐—ฐ๐—ฟ๐—ฒ๐—ฒ๐—ป๐—ฒ๐—ฟ is a Stock screening tool that is useful to screen stocks based on Technical & Fundamentals.
๐Ÿ”ธ It scans stocks by using technical indicators like RSI, MACD, divergences, etc.
๐Ÿ”ธ It also uses fundamental tools like Book Value, EPS,PE etc
[2/15]
How To Create A Scan ?
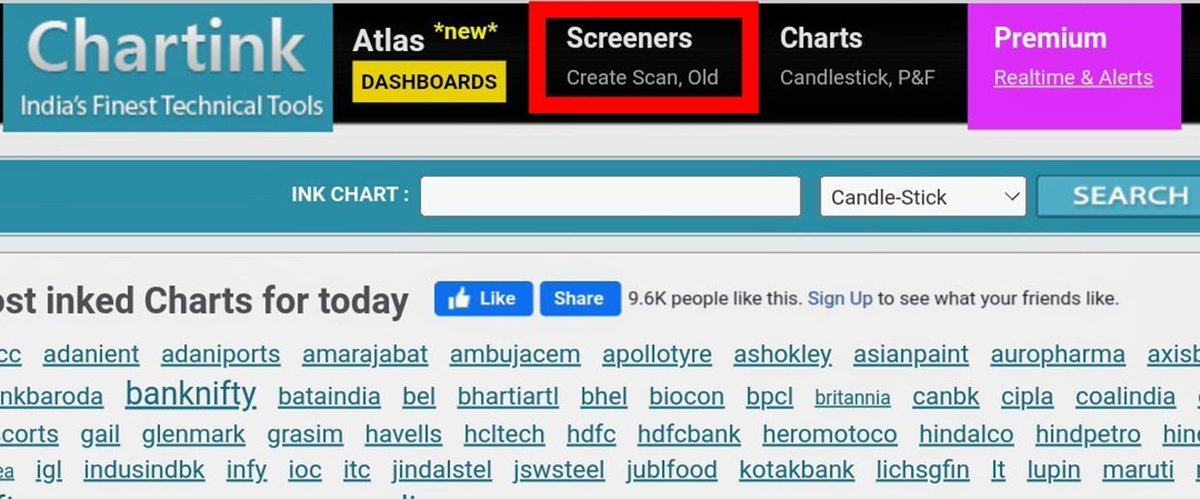
Go to chartink.com & click on ๐˜Š๐˜ณ๐˜ฆ๐˜ข๐˜ต๐˜ฆ ๐˜š๐˜ค๐˜ข๐˜ฏ under ๐˜š๐˜ค๐˜ณ๐˜ฆ๐˜ฆ๐˜ฏ๐˜ฆ๐˜ณ๐˜ด.

[3/15] Image
Read 15 tweets
Feb 15
Auto Adjustment Short Straddle
Expiry Stratgey with 160% in 4 Years

Retweet and Share !
A Thread๐Ÿงต
Strategy Setting
We Are booking Straddle on either 40% Stoploss or 70% Target and Reexecuting one more ATM Strike
This makes money in Trending Markets or reversal days like M, N , W Pattern
Strategy Link : stockmock.in/#!/share/2f8g7โ€ฆ
Strategy with 0.5% Slippage has Given 160% in 4 Years
Best Suited for Finvasia as no Brokerage or with higher lots in other Brokerages
Read 7 tweets
Feb 14
๐Ÿฑ ๐—ง๐—ฟ๐—ฎ๐—ฑ๐—ถ๐—ป๐—ด ๐—ช๐—ฒ๐—ฏ๐˜€๐—ถ๐˜๐—ฒ๐˜€ ๐˜๐—ต๐—ฎ๐˜ ๐—ฐ๐—ผ๐˜‚๐—น๐—ฑ ๐˜๐—ฒ๐—ฎ๐—ฐ๐—ต ๐˜†๐—ผ๐˜‚ ๐—บ๐—ผ๐—ฟ๐—ฒ ๐˜๐—ต๐—ฎ๐—ป ๐Ÿฑ๐Ÿฌ,๐Ÿฌ๐Ÿฌ๐Ÿฌ ๐—ฐ๐—ผ๐˜‚๐—ฟ๐˜€๐—ฒ
๐Ÿงต Thread ๐Ÿงต
๐Ÿ”ธ @ZerodhaVarsity
Varsity is an extensive and in-depth collection of stock market and financial lessons created by Karthik Rangappa at @Zerodha

It one of the largest financial education resources on the web.
Personally Started with this website
zerodha.com/varsity/
[2/8]
๐Ÿ”ธ @investopedia
A comprehensive finance and investing dictionary that offers articles, tutorials, and courses on a wide range of trading topics
investopedia.com
[3/8]
Read 9 tweets
Feb 9
๐—ง๐—ฟ๐—ฎ๐—ฑ๐—ถ๐—ป๐—ด ๐—ณ๐—ผ๐—ฟ ๐—ฎ ๐—Ÿ๐—ถ๐˜ƒ๐—ถ๐—ป๐—ด
A Book BY DR ALEXANDER ELDER

๐Ÿงต Must Read Thread ๐Ÿงต
๐—ฃ๐—ถ๐—น๐—น๐—ฎ๐—ฟ๐˜€ ๐—ผ๐—ณ ๐—ฎ ๐—ง๐—ฟ๐—ฎ๐—ฑ๐—ถ๐—ป๐—ด

๐Ÿ”ธ ๐˜—๐˜ด๐˜บ๐˜ค๐˜ฉ๐˜ฐ๐˜ญ๐˜ฐ๐˜จ๐˜บ
๐Ÿ”ธ ๐˜”๐˜ข๐˜ณ๐˜ฌ๐˜ฆ๐˜ต ๐˜ˆ๐˜ฏ๐˜ข๐˜ญ๐˜บ๐˜ด๐˜ช๐˜ด ๐˜ข๐˜ฏ๐˜ฅ ๐˜›๐˜ณ๐˜ข๐˜ฅ๐˜ช๐˜ฏ๐˜จ ๐˜š๐˜บ๐˜ด๐˜ต๐˜ฆ๐˜ฎ๐˜ด
๐Ÿ”ธ ๐˜”๐˜ฐ๐˜ฏ๐˜ฆ๐˜บ ๐˜”๐˜ข๐˜ฏ๐˜ข๐˜จ๐˜ฆ๐˜ฎ๐˜ฆ๐˜ฏ๐˜ต
[2/18]
How to keep Emotions in check ?
๐Ÿ”ธ ๐—•๐—ฒ ๐—ฅ๐—ฒ๐—ฎ๐—น๐—ถ๐˜€๐˜๐—ถ๐—ฐ : Donโ€™t Expect 10% in a month or doubling your account every 6 months , Anywhere between 2 to 5% per month is a great return

๐Ÿ”ธ Keep a Trading Journal : helps you identify your weakness , strengths.

[3/18]
Read 17 tweets
Feb 4
๐—ง๐—ต๐—ฒ ๐—จ๐—น๐˜๐—ถ๐—บ๐—ฎ๐˜๐—ฒ ๐Ÿฎ๐Ÿฌ๐Ÿฌ ๐—˜๐— ๐—” ๐—ฆ๐˜๐—ฟ๐—ฎ๐˜๐—ฒ๐—ด๐˜† ๐—ณ๐—ผ๐—ฟ ๐—ฃ๐—ผ๐˜€๐—ถ๐˜๐—ถ๐—ผ๐—ป๐—ฎ๐—น ๐—ง๐—ฟ๐—ฎ๐—ฑ๐—ถ๐—ป๐—ด
๐Ÿงต ๐—” ๐—ง๐—ต๐—ฟ๐—ฒ๐—ฎ๐—ฑ ๐Ÿงต
200 EMA : THE LONG TERM TREND
๐Ÿ”ธ When a stock price crosses its 200-day moving average, it is a
technical signal that a reversal has occurred.
๐Ÿ”ธ A stock above 200 ema is considered bullish in its long term trend and if its below 200 ema its considered bearish
[2/18]
๐Ÿ”ธ A simple rule of not buying stocks below 200 ema for short term trading could save a lot of money
๐Ÿ”ธ Some may not agree with this and its ok!
[3/18]
Read 19 tweets
Feb 1
6 Continuation Chart Patterns All Traders should know about !
A Thread๐Ÿงต
What are Chart Patterns ?
A chart pattern suggests what prices might do next, based on what they have done in the past

They are patterns that repeat again and again as they are basically representing human emotions.
These patterns have been into existence since 100s of years!
1. Bullish Triangle

Triangles are similar to wedges and pennants and can be either a continuation pattern, if validated, or a powerful reversal pattern, in the event of failure.
Read 10 tweets

Did Thread Reader help you today?

Support us! We are indie developers!


This site is made by just two indie developers on a laptop doing marketing, support and development! Read more about the story.

Become a Premium Member ($3/month or $30/year) and get exclusive features!

Become Premium

Don't want to be a Premium member but still want to support us?

Make a small donation by buying us coffee ($5) or help with server cost ($10)

Donate via Paypal

Or Donate anonymously using crypto!

Ethereum

0xfe58350B80634f60Fa6Dc149a72b4DFbc17D341E copy

Bitcoin

3ATGMxNzCUFzxpMCHL5sWSt4DVtS8UqXpi copy

Thank you for your support!

Follow Us on Twitter!

:(