Here's a Step-by-Step guide on how I trade High Probability CHoCH 💯
Once you master it, your trading will improve by 67% (guaranteed)
A short thread 🧵 🪡
🖤 & RT for others
Once you master it, your trading will improve by 67% (guaranteed)
A short thread 🧵 🪡
🖤 & RT for others

In the next 3 minutes (or more),
I'll show you how exactly to trade the highest probability CHoCH with high R:R
But before we begin, do me a favour:
Kindly Retweet the first tweet for other to see.
Done? You're my comrade 👊
Now let's dive 👇
I'll show you how exactly to trade the highest probability CHoCH with high R:R
But before we begin, do me a favour:
Kindly Retweet the first tweet for other to see.
Done? You're my comrade 👊
Now let's dive 👇
First things first, it's important I establish this two basic points:
1. Trends does not last forever.
A Bullish Trend will at some point switch to Bearish, and vise versa.
Example 👇
1. Trends does not last forever.
A Bullish Trend will at some point switch to Bearish, and vise versa.
Example 👇

The second point is that,
All unmitigated supply and demand zones are very likely to cause a reaction whenever price hits them.
Meaning that if price is trending upward and there's an unmitigated supply above,
It will very likely cause the pullback of that bullish structure.
All unmitigated supply and demand zones are very likely to cause a reaction whenever price hits them.
Meaning that if price is trending upward and there's an unmitigated supply above,
It will very likely cause the pullback of that bullish structure.
With that being established, now what is CHoCH ?
CHoCH stands for Change of Character.
It can also be represented as CH, and it is essentially the first sign of a trend change.
The very first time a trend switch from bullish to bearish (or vise versa), that is a CHoCH
E.g 👇
CHoCH stands for Change of Character.
It can also be represented as CH, and it is essentially the first sign of a trend change.
The very first time a trend switch from bullish to bearish (or vise versa), that is a CHoCH
E.g 👇

In simplest definition, Change of Character is the first sign of strength, and the first sign of weakness.
If a trend is changing from bullish to bearish, it means that Bulls are getting weaker and Bears are getting stronger.
So a CHoCH is that first sign of a trend change.
If a trend is changing from bullish to bearish, it means that Bulls are getting weaker and Bears are getting stronger.
So a CHoCH is that first sign of a trend change.
Now play close attention 👂
Change of Character (CHoCH) is not the same as Break of Structure (BOS)
BOS is when you have a confimed break in market structure (can be bullish or bearish)
But CHoCH is the first sign that a BOS might occur.
Let me explain better 👇
Change of Character (CHoCH) is not the same as Break of Structure (BOS)
BOS is when you have a confimed break in market structure (can be bullish or bearish)
But CHoCH is the first sign that a BOS might occur.
Let me explain better 👇
The major difference between a BOS and a CHoCH is that it must be a swing structure break for it to be called a BOS,
But CHoCH doesn't have to be a swing structure, it can be internal or minor structure.
Example 👇
But CHoCH doesn't have to be a swing structure, it can be internal or minor structure.
Example 👇

In the image above, that very first time that the internal structure switched from bullish to bearish is what we call a CHoCH,
Although sometimes if the market moves rapidly with high volume (without minor pullbacks), the CHoCH line can be the same as the BOS line.
Although sometimes if the market moves rapidly with high volume (without minor pullbacks), the CHoCH line can be the same as the BOS line.
Now what is the job of a CHoCH ?
The job of a CHoCH is very simple, it signals when a pullback is 'potentially' starting, and when a pullback has 'potentially' ended.
Potentially because it is not guaranteed, you can have internal CHoCH and the swing will still not pullback.
The job of a CHoCH is very simple, it signals when a pullback is 'potentially' starting, and when a pullback has 'potentially' ended.
Potentially because it is not guaranteed, you can have internal CHoCH and the swing will still not pullback.
In the image below,
The bearish CHoCH is the first signal that the swing is about to pullback,
And when you see a bullish CHoCH again, it is a signal that the pullback may now be over, and the next swing run is starting.
👇👇
The bearish CHoCH is the first signal that the swing is about to pullback,
And when you see a bullish CHoCH again, it is a signal that the pullback may now be over, and the next swing run is starting.
👇👇

That's the only job of a CHoCH - to signal when a potential pullback is starting, and when it might be over.
Now like in the image below, of course the trend can reverse all the way and cause a BOS,
But the job of the CHoCH here is to only signal when that pullback is starting.
Now like in the image below, of course the trend can reverse all the way and cause a BOS,
But the job of the CHoCH here is to only signal when that pullback is starting.

So basically if you are expecting a BOS, then a CHoCH can be a potential signal that the BOS might occur, but that's just it.
You cannot because you saw a CHoCH and know for a guarantee the the BOS will happen, because a CHoCH has nothing to do with a BOS.
Hope you grab?
You cannot because you saw a CHoCH and know for a guarantee the the BOS will happen, because a CHoCH has nothing to do with a BOS.
Hope you grab?
Moving on...
So now that we know what a CHoCH is and what it signifies,
• How do we actually trade it?
• Or how do we use it to build a trade idea?
It is very simple, pay close attention 👇
So now that we know what a CHoCH is and what it signifies,
• How do we actually trade it?
• Or how do we use it to build a trade idea?
It is very simple, pay close attention 👇
Now we know that all unmitigated zones will potentially cause a pullback whenever price hits them,
Meaning that prior unmitigated supply zones are what cause the swing pullback in a bullish market,
And prior unmitigated demand will cause a pullback in a bearish market...
Meaning that prior unmitigated supply zones are what cause the swing pullback in a bullish market,
And prior unmitigated demand will cause a pullback in a bearish market...
We can now start to put the peices of the puzzle together, and build a trade idea.
Example:
Say in a bullish market, we have a BOS and we expect a pullback after every BOS...
Price is approaching an unmitigated old area of supply zone and we expect it to cause that pullback.
Example:
Say in a bullish market, we have a BOS and we expect a pullback after every BOS...
Price is approaching an unmitigated old area of supply zone and we expect it to cause that pullback.

Now we can start paying attention the monent that price reaches that zone.
When we now see a CHoCH, what does it signify?
It signals that the potential pullback we're expecting finally is starting.
Now the monent we see that bearish CHoCH, we now have a new zone to trade from.
When we now see a CHoCH, what does it signify?
It signals that the potential pullback we're expecting finally is starting.
Now the monent we see that bearish CHoCH, we now have a new zone to trade from.


And boom....
A trade setup has appeared 💯
Now you can set a SELL LIMIT ORDER on the newly created supply zone, with your stoploss just above it.
And you can look to target the EQ of that current swing range, or potentially any demand below the EQ.
See example 👇
A trade setup has appeared 💯
Now you can set a SELL LIMIT ORDER on the newly created supply zone, with your stoploss just above it.
And you can look to target the EQ of that current swing range, or potentially any demand below the EQ.
See example 👇

So now you've banked some profits, what next?
• The structure is bullish, and we expect it to continue bullish.
• We're not expecting a trend change (Bearish BOS) and even if we are, it is not confimed until we see it.
So it's logical to continue longs from the demand right?
• The structure is bullish, and we expect it to continue bullish.
• We're not expecting a trend change (Bearish BOS) and even if we are, it is not confimed until we see it.
So it's logical to continue longs from the demand right?
Now as price is approaching your Point Of Interest (POI), you can outrightly set a BUY LIMIT ORDER on that demand, but you don't have to.
Because what if the zone does not hold?
You need a little more confirmation to know if the demand will hold, or not.
Because what if the zone does not hold?
You need a little more confirmation to know if the demand will hold, or not.
And that's where CHoCH comes into play again.
So you start to pay close attention the moment that price starts approaching your POI,
And when you see a bullish CHoCH, it's now a higher probability that the pullback might be over.
And you now have a new zone to trade from 👇
So you start to pay close attention the moment that price starts approaching your POI,
And when you see a bullish CHoCH, it's now a higher probability that the pullback might be over.
And you now have a new zone to trade from 👇

You can now set your Buy Limit Order, with your Stoploss always behind the zone.
Now where are you going to target?
It's Pro Trend, so it's logical to target the weak high above and take your profit there.
See example 👇
Now where are you going to target?
It's Pro Trend, so it's logical to target the weak high above and take your profit there.
See example 👇

Why is it a weak high?
Because it did bot break the swing low.
The trend is bullish and you expect to have another BOS after the pullback,
So you can just set your TP on the BOS line.
And that's simply how to use CHoCH.
Because it did bot break the swing low.
The trend is bullish and you expect to have another BOS after the pullback,
So you can just set your TP on the BOS line.
And that's simply how to use CHoCH.
Now I know you must have learn a new thing yeah?
but don't go yet because there's more 😉
And you need to once more pay very close attention here...
I'll be using a chart example this time, and not lines
👇👇👇
but don't go yet because there's more 😉
And you need to once more pay very close attention here...
I'll be using a chart example this time, and not lines
👇👇👇
Now one thing you need to know is that,
Change of Character can happen on any timeframe, and you don't always have to wait for it on one timeframe.
To explain it better, look at the image below 👇
This is EURUSD 15 minutes tineframe, and that was yesterday 20th of February 👇
Change of Character can happen on any timeframe, and you don't always have to wait for it on one timeframe.
To explain it better, look at the image below 👇
This is EURUSD 15 minutes tineframe, and that was yesterday 20th of February 👇

Based on my strategy, I identified that zone (the blue zone) as a high probability supply zone to sell from.
It swept liquidity, supply chain and has inducement just before it.
Now I need you to observe that image very well, again..
It swept liquidity, supply chain and has inducement just before it.
Now I need you to observe that image very well, again..
If I'm to wait for a CHoCH before taking a trade, it will be on the dotted line 👇
But there's zero guarantee that price will pullback after the CHoCH, so I might miss out.
Also, I could get in on the LTF with 3 pips SL and target 15 pips, that's already 5R
Smart move innit?
But there's zero guarantee that price will pullback after the CHoCH, so I might miss out.
Also, I could get in on the LTF with 3 pips SL and target 15 pips, that's already 5R
Smart move innit?


So what do I do now?
That's where Multi-Timeframe-Analysis comes in.
Like I said you don't have to wait for CHoCH on one timeframe, you can jump lower for it.
See what I did 👇
That's where Multi-Timeframe-Analysis comes in.
Like I said you don't have to wait for CHoCH on one timeframe, you can jump lower for it.
See what I did 👇
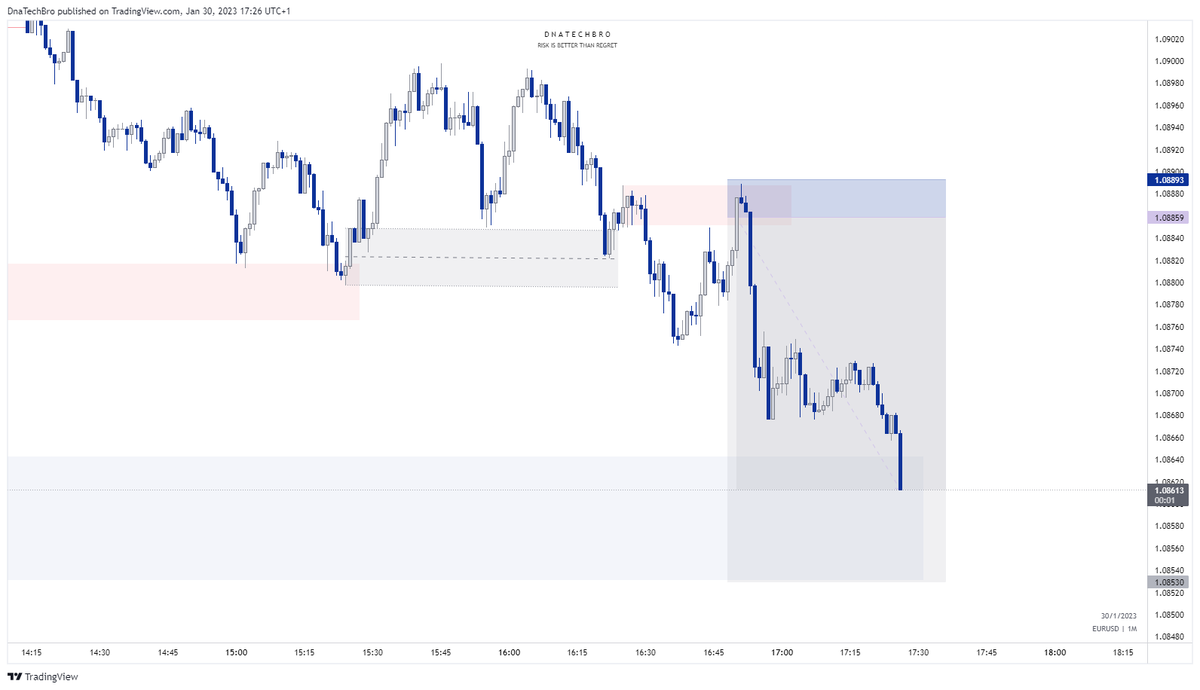
I went down to the M1 timeframe and saw price give a CHoCH after sweeping liquidity.
(red line for CHoCH, dotted black line above for sweep)
When I saw this, I set my order with zero doubt nor hesitation, the rest is history 😁
(red line for CHoCH, dotted black line above for sweep)
When I saw this, I set my order with zero doubt nor hesitation, the rest is history 😁


Now to prove that this actually works,
I didn't take the trade alone yesterday.
I dropped it in my signal group and one member used it to pass his $10,000 MFF Phase 1 challenge
Easy stuff right?
My VIP members are enjoying lol 😉
I didn't take the trade alone yesterday.
I dropped it in my signal group and one member used it to pass his $10,000 MFF Phase 1 challenge
Easy stuff right?
My VIP members are enjoying lol 😉


Oooops!!
That's over 10 minutes already.
Anyways I'll be stopping here, hope you found this helpful?
Follow me @dnatechbro for more educational content like this one.
And don't forget to Retweet and Tag a trader who might need this.
That's over 10 minutes already.
Anyways I'll be stopping here, hope you found this helpful?
Follow me @dnatechbro for more educational content like this one.
And don't forget to Retweet and Tag a trader who might need this.
PS: I post educational contents like this plus Daily #EURUSD Outlook in my FREE Telegram channel everyday.
You can join w/ link below 👇
t.me/kiroxtrading
You can join w/ link below 👇
t.me/kiroxtrading
• • •
Missing some Tweet in this thread? You can try to
force a refresh