THIS THREAD WILL MARK THE START OF YOUR NEW TRADING JOURNEY AND KNOWING HOW THE MARKET ACTUALLY MOVES!
You all have probably heard of ICT on twitter and no, it’s not another “hype strategy.” These are the most legit concepts you will ever learn, I promise.
Here are the basics👇
You all have probably heard of ICT on twitter and no, it’s not another “hype strategy.” These are the most legit concepts you will ever learn, I promise.
Here are the basics👇
When I first started learning ICT, I thought the most important part was a fair value gap (will show you what that is next tweet), but the most important part of ICT is…
LIQUIDITY.
Liquidity is the most important so when you are done reading this thread, please remember that.
LIQUIDITY.
Liquidity is the most important so when you are done reading this thread, please remember that.
The second most important part is the time you enter your trades. You should only be trading during the…
London Killzone 3:00-5:00am
NY Killzone 8:30-12:00
PM Session 1:30-4:00
These times will present the most high probability trade setups.
London Killzone 3:00-5:00am
NY Killzone 8:30-12:00
PM Session 1:30-4:00
These times will present the most high probability trade setups.
Before you really get started with this thread. You should know basic market structure.
If you are COMPLETELY new, watch this video real quick
If you are COMPLETELY new, watch this video real quick
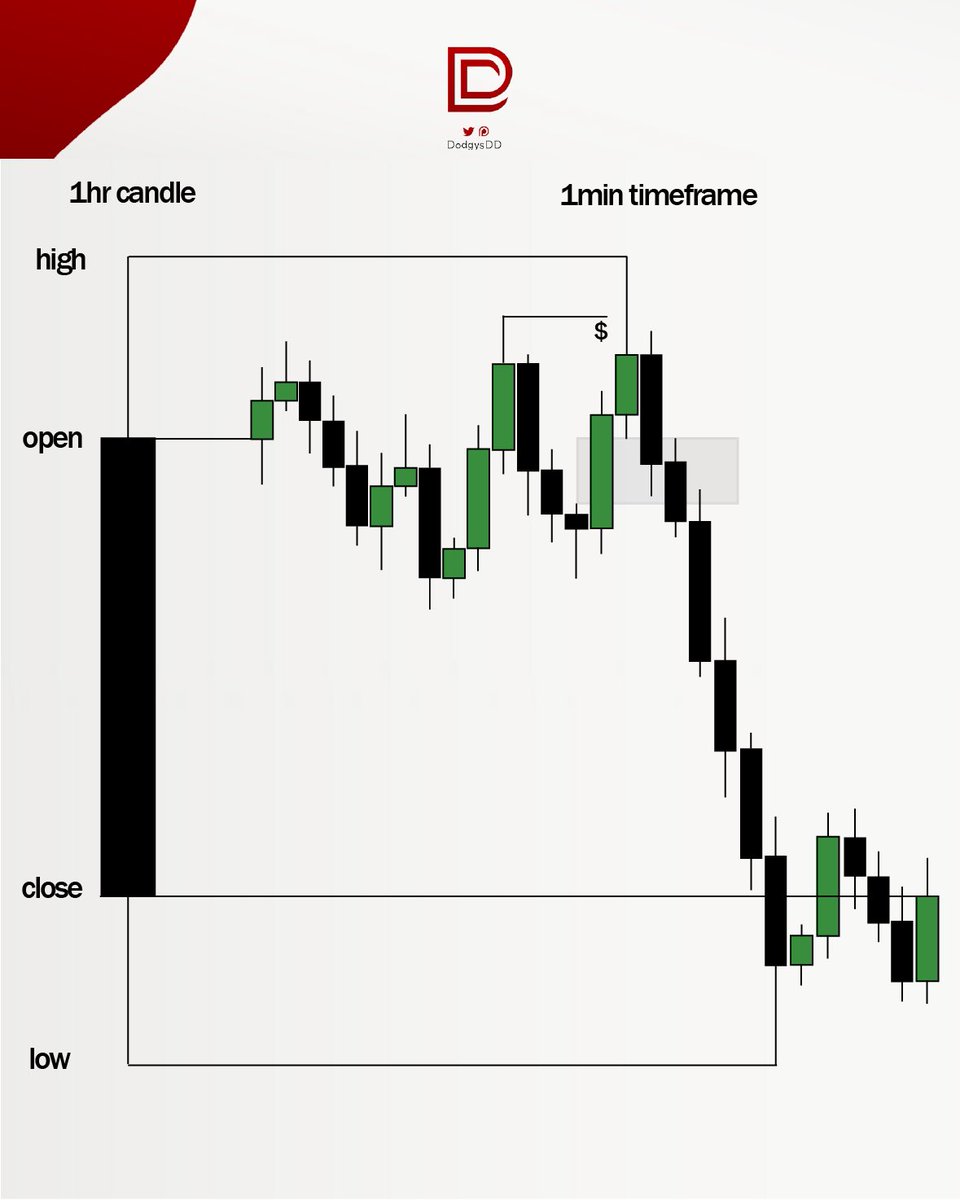
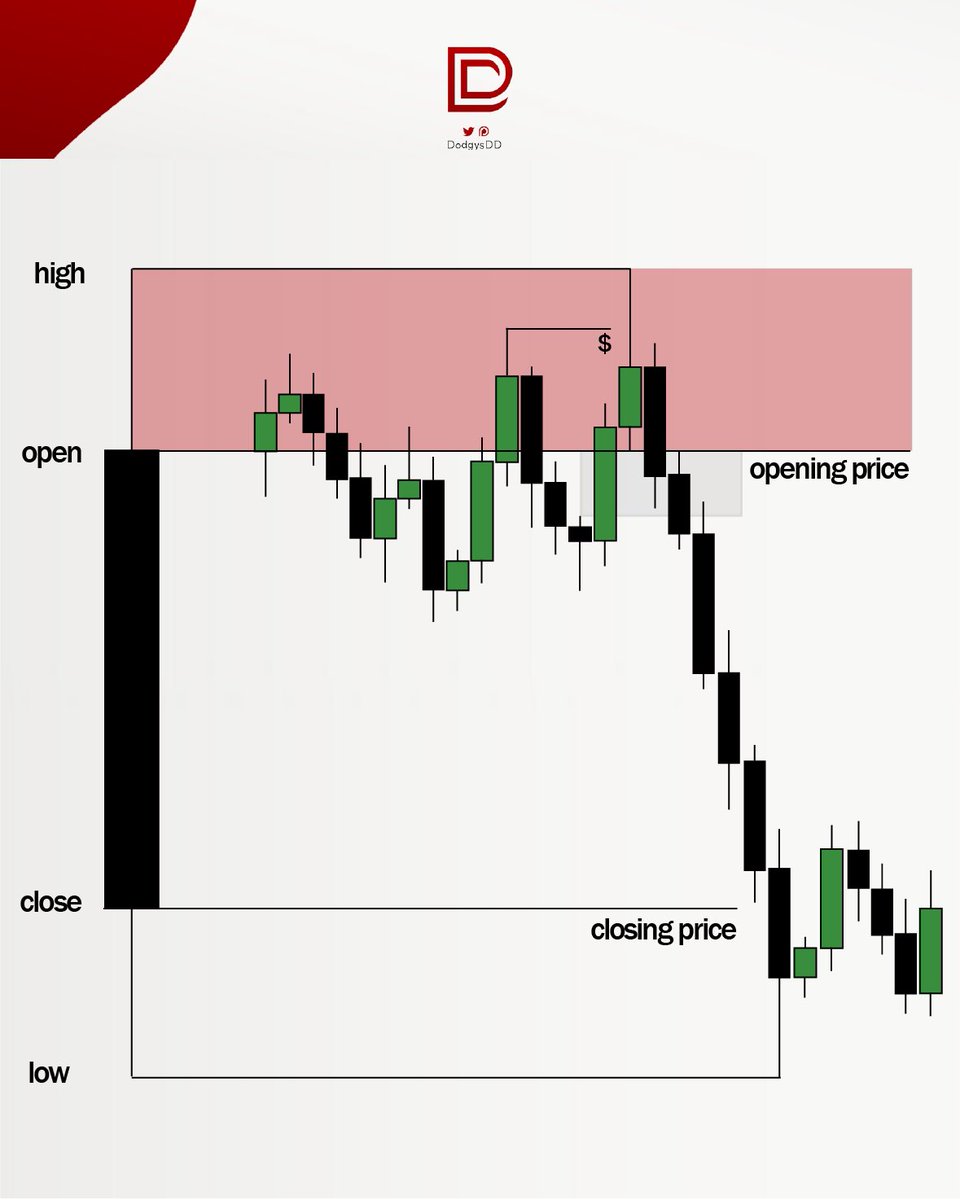
Well, let’s get started. Here is a picture of a fair value gap. The green candle is a BULLISH fair value gap. The red candle is a BEARISH fair value gap. 

A fair value gap does not have to be this 3 candle formation. All a fair value gap is - is when the first candles high, does NOT overlap the third candles low. (Vice versa with bearish gap). Here’s an example with every single fair value gap I found in this frame:

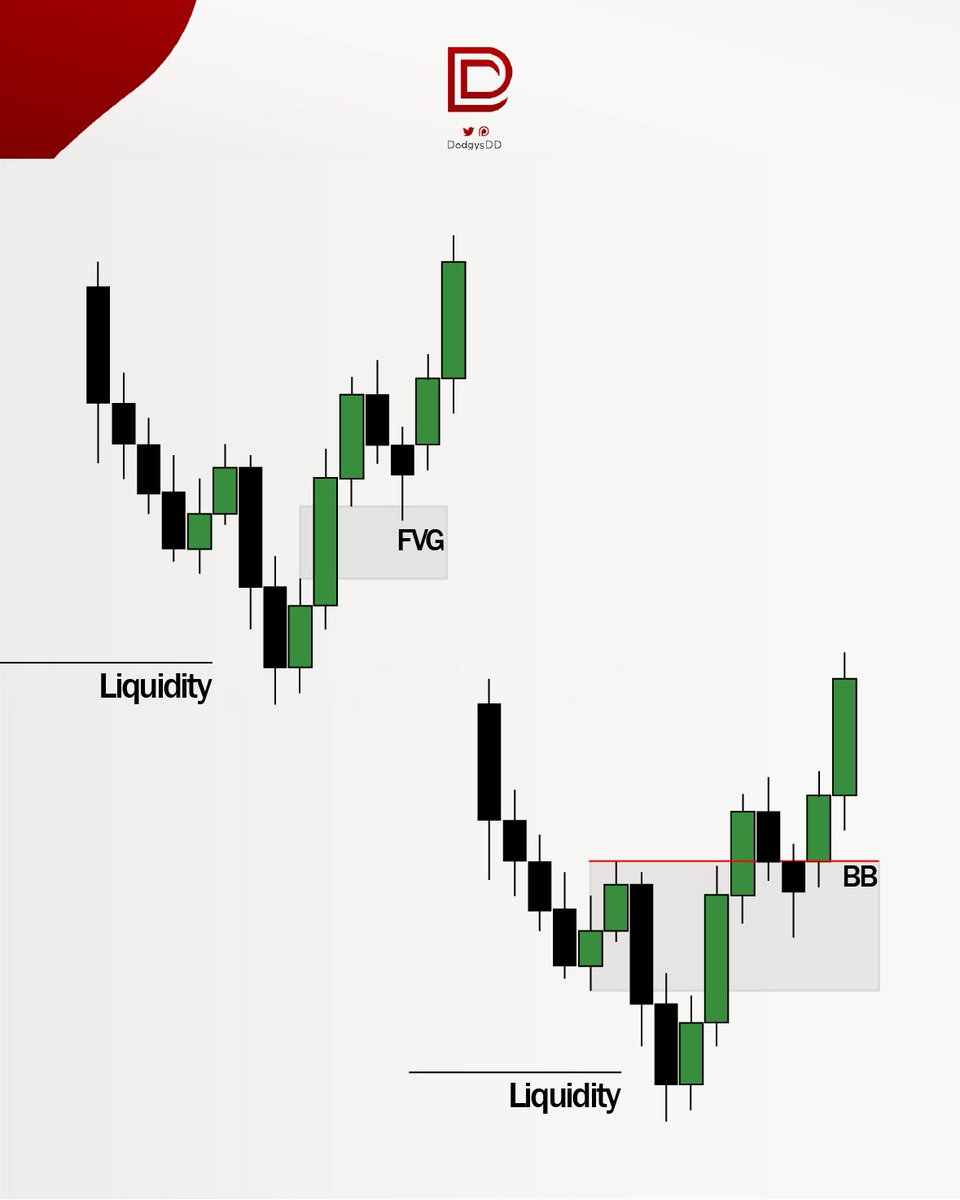
How do you know which one to take? Well that’s where liquidity comes in
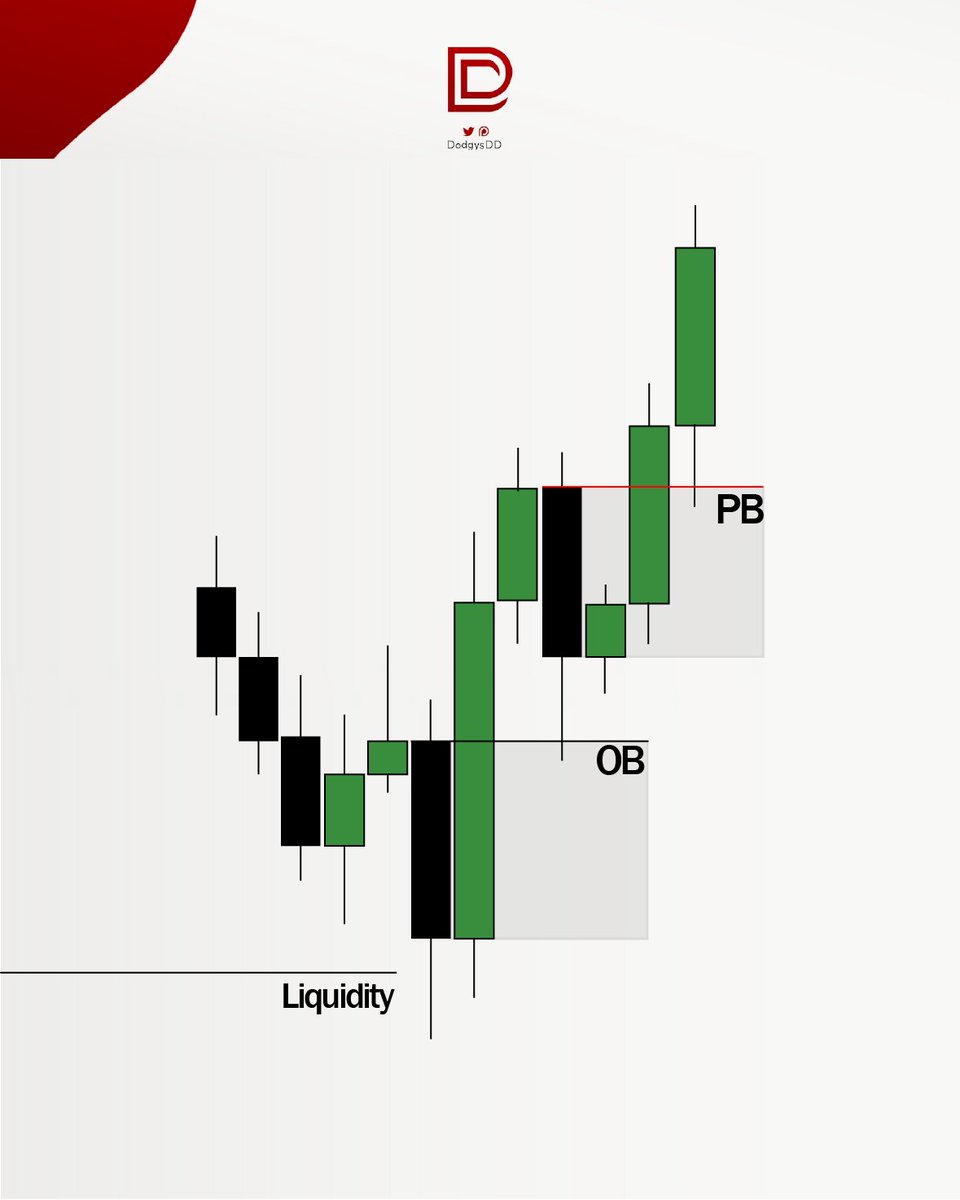
Liquidity is any high or low we make, but it’s more complicated.
When you started reading books, where did they all tell you to place a stop loss?
Below support for longs and above resistance for shorts.
Liquidity is any high or low we make, but it’s more complicated.
When you started reading books, where did they all tell you to place a stop loss?
Below support for longs and above resistance for shorts.


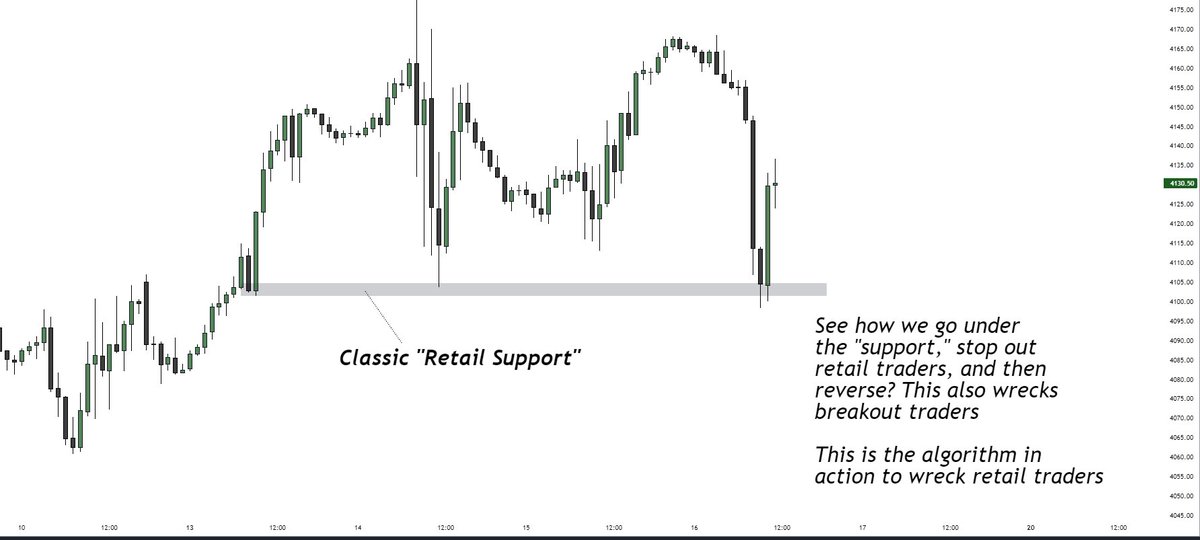

One of the main reasons retail traders fail is because they do exactly this, and the market algorithm needs to stop out retail traders by going under support (AKA sellside liquidity) so it can rise again.
Here are the two types of liquidity. This is NOT support and resistance.
Here are the two types of liquidity. This is NOT support and resistance.

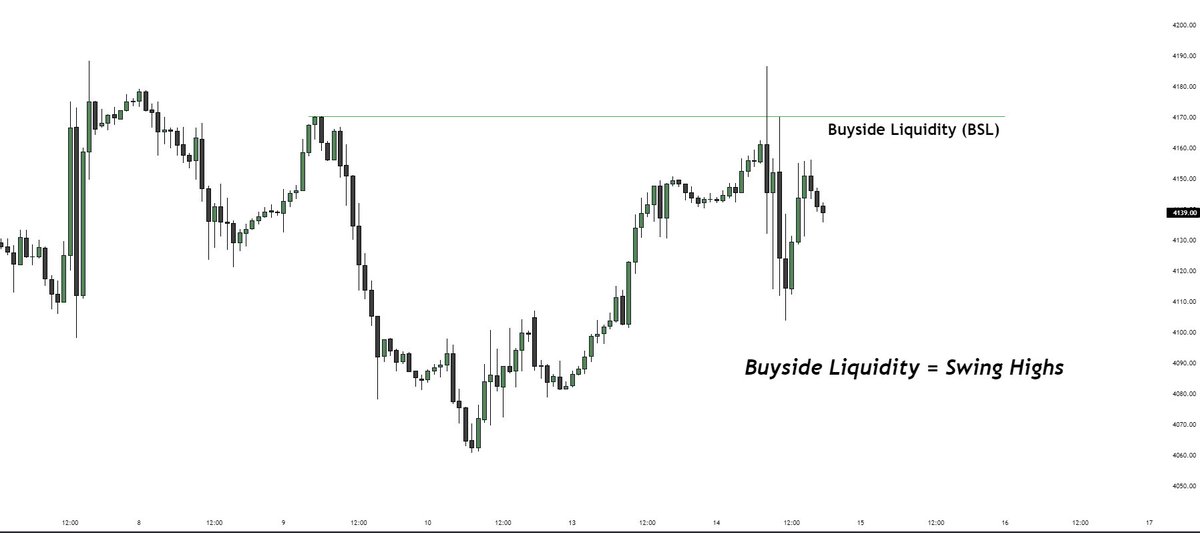
The market will always magnet towards either BSL or SSL, and the main goal of ICT is to figure out which one by watching structure and models, and then getting an entry from a PD array
A PD array is a type of entry ICT teaches, there’s over 10 different kinds of entries
A PD array is a type of entry ICT teaches, there’s over 10 different kinds of entries
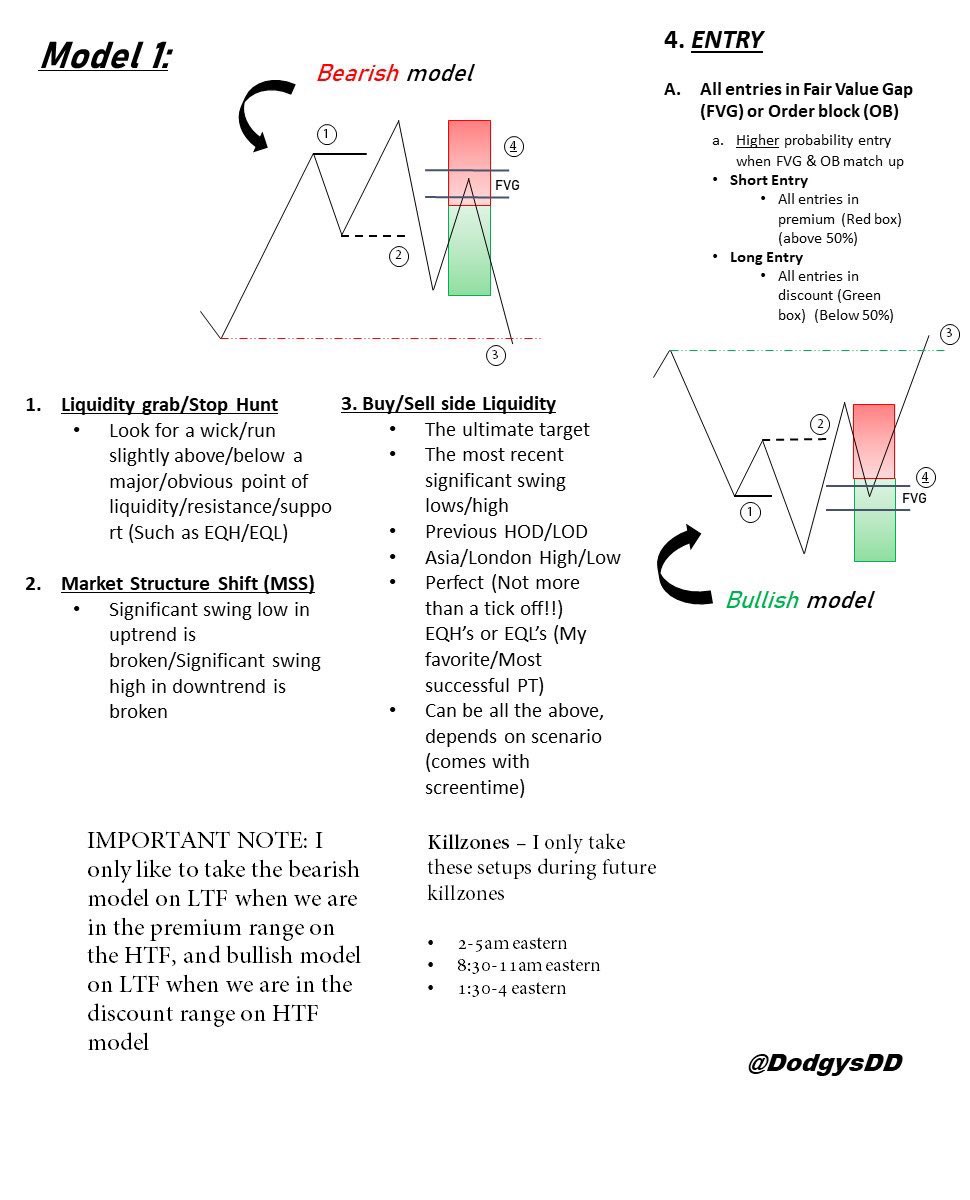
The whole point of ICT is this:
Look for a liquidity sweep (buy stops or sell stops taken out), then look for a reversal after the liquidity sweep using a PD array (type of entry) and basic market structure
Here is the basic model:
Look for a liquidity sweep (buy stops or sell stops taken out), then look for a reversal after the liquidity sweep using a PD array (type of entry) and basic market structure
Here is the basic model:

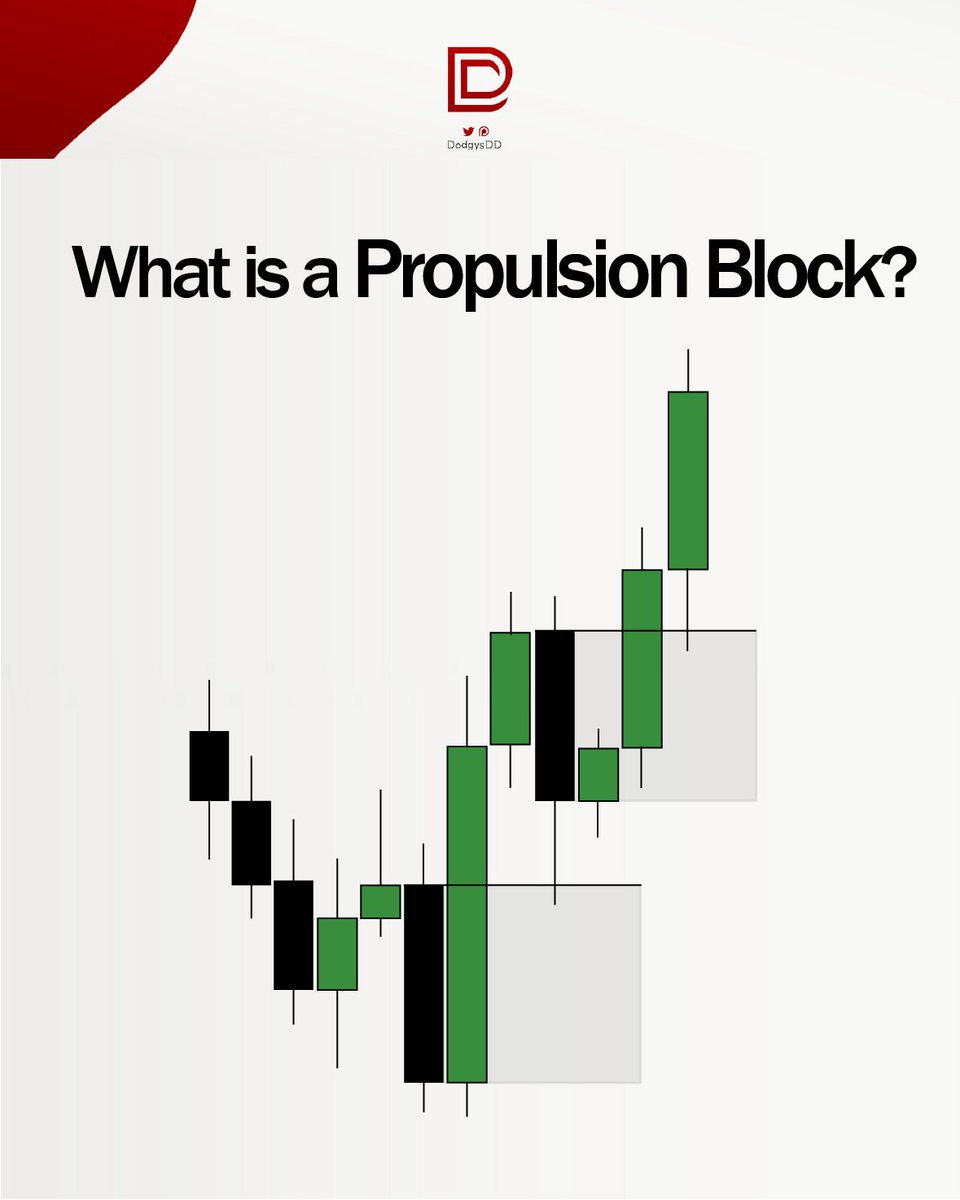
Here are the most basic and important PD arrays to learn (ICT entries)
1. Fair Value Gap (FVG)
2. Orderblock (OB)
3. Breaker Block
There are 10+ more (some ICT has not taught) so I will do a thread on the other advanced PD arrays if this post helps
1. Fair Value Gap (FVG)
2. Orderblock (OB)
3. Breaker Block
There are 10+ more (some ICT has not taught) so I will do a thread on the other advanced PD arrays if this post helps
In ICT, you don’t just enter any fair value gap, you have to know what array you are in
There are two types of arrays- Discount and Premium
When you make a higher high you draw the fib from low to high
When you make a lower low you draw fib from high to low
Only use the 0.5
There are two types of arrays- Discount and Premium
When you make a higher high you draw the fib from low to high
When you make a lower low you draw fib from high to low
Only use the 0.5
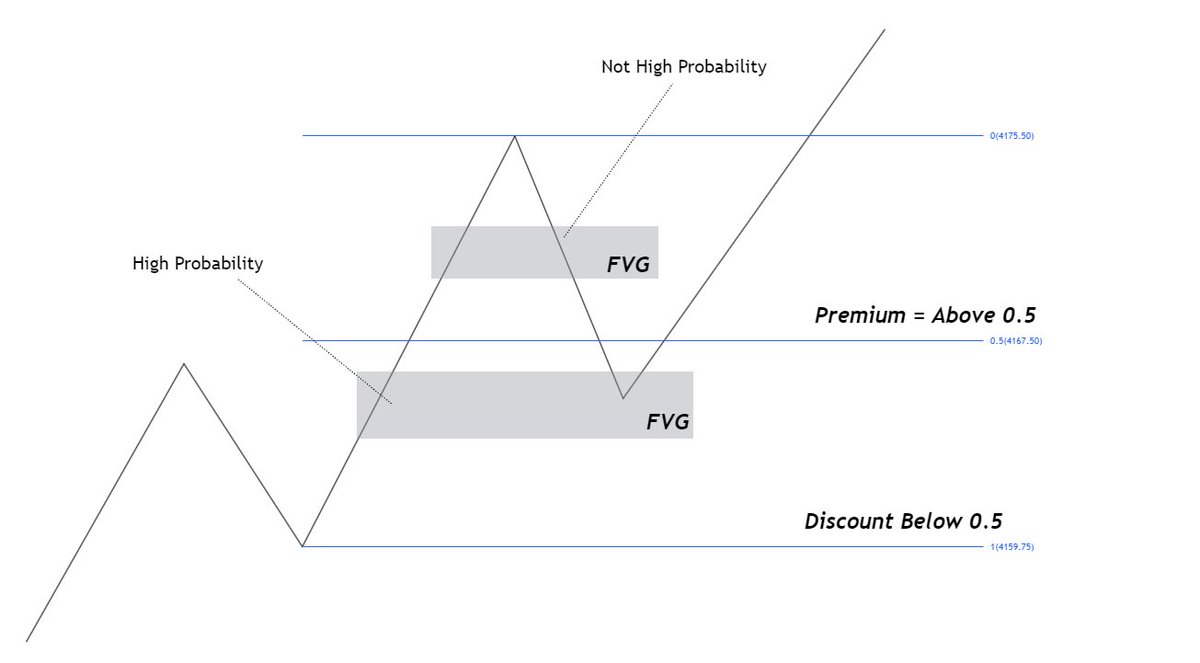

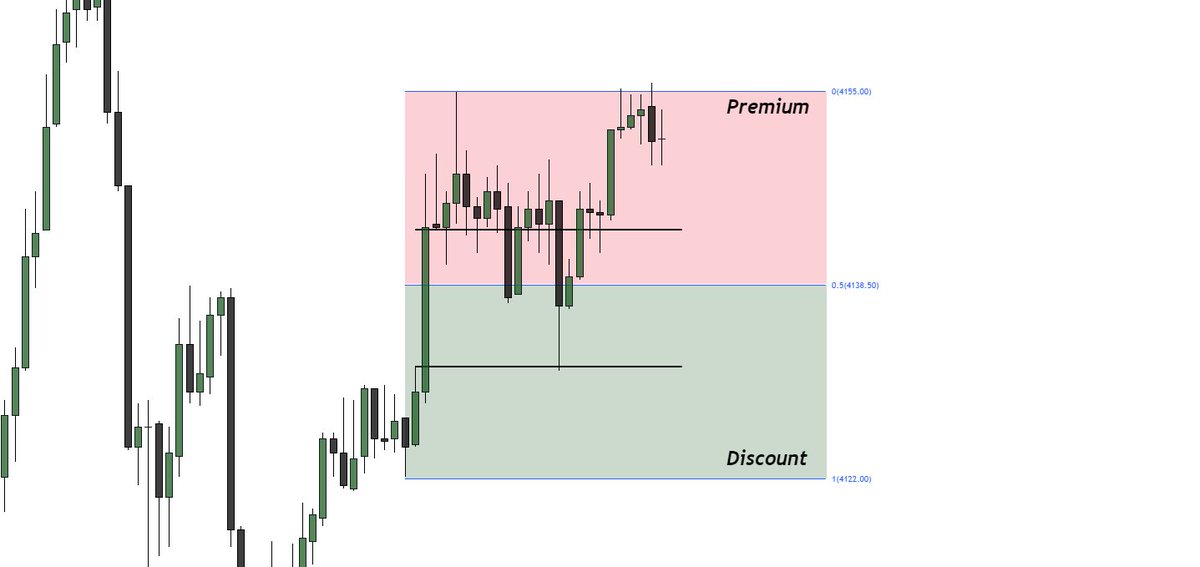
Another thing to point out. Always be aware of where premium versus discount is on the higher time frame. Why would you want to short if we are in discount on the HTF? Why would you want to long if we are in premium on the HTF.
It might work, but low probability
It might work, but low probability

MSS stands for “Market Structure Shift” because you go from making higher highs and lows to making a lower high and low, so that would be a trend change.
When entering a fair value gap, for a reversal, that’s what you look for
I like this model. Here are some examples
When entering a fair value gap, for a reversal, that’s what you look for
I like this model. Here are some examples
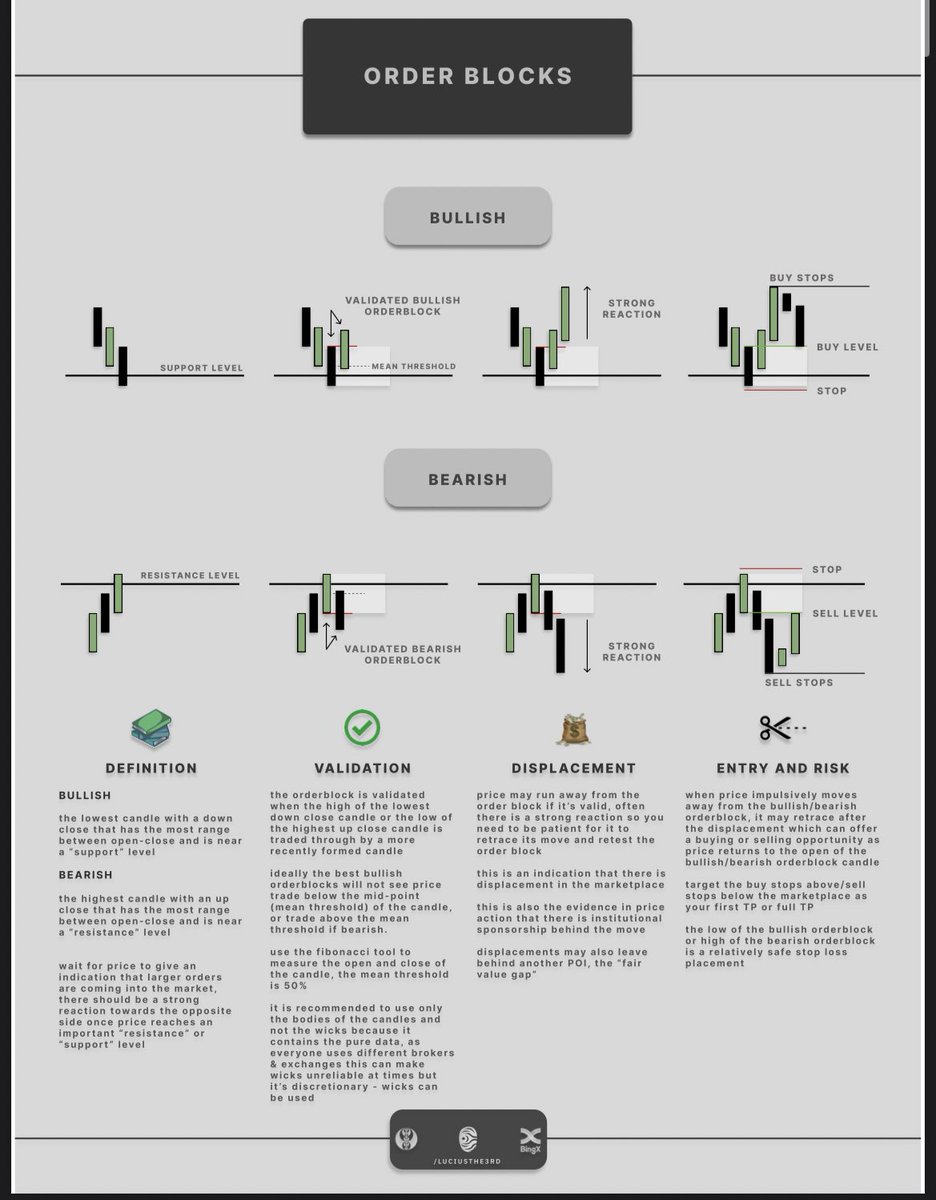
Orderblocks (OB) are defined as “a change in the state of delivery”
Green candle before down move in a DOWNTREND = Bearish OB
Red candle before up move in a UPTREND = Bullish OB
(credit to lucius for these pictures)
Green candle before down move in a DOWNTREND = Bearish OB
Red candle before up move in a UPTREND = Bullish OB
(credit to lucius for these pictures)

Breaker Blocks (BB)
A Bullish BB is a green candle before a down move that is traded back up through after purging liquidity. It is now support.
A bearish BB is a red candle before an up move that is traded back down through after purging liquidity. It is now resistance.
A Bullish BB is a green candle before a down move that is traded back up through after purging liquidity. It is now support.
A bearish BB is a red candle before an up move that is traded back down through after purging liquidity. It is now resistance.

Here are some more examples. Remember, there should always be a purge of liquidity then good displacement to make it high probability.


Something to write in your notes:
When looking for higher prices, you want to see us sweep lows before getting a move higher
When looking for lower prices, you want to see us sweep highs before getting a move lower
After this criteria is met, you look for the setup
When looking for higher prices, you want to see us sweep lows before getting a move higher
When looking for lower prices, you want to see us sweep highs before getting a move lower
After this criteria is met, you look for the setup
Last topic we will review in this thread. The market moves in a specific model called the buy model and sell model. Here are the pictures
This takes screen time to see live time. But compare the models to my real time analysis.
This takes screen time to see live time. But compare the models to my real time analysis.


All buy and sell models have 1 thing in common. We reject/bounce off of some HTF PD array, and get a “curve like” shape.
The best buy models will bounce off a HTF PD array (like a FVG) after sweeping liquidity and you want to look for a break above the last lower FVG like so:
The best buy models will bounce off a HTF PD array (like a FVG) after sweeping liquidity and you want to look for a break above the last lower FVG like so:

Here’s a few examples. I was not able to spot these in live time until I annotated them in hindsight a ton!
Reading these and annotating them yourself in hindsight as much as possible will help for live time, I promise.
Reading these and annotating them yourself in hindsight as much as possible will help for live time, I promise.


So now, let me walk you through this live example. Read what I annotate in the picture in order to see this model formed real time.
The pictures go in order
The pictures go in order


Second part
Also, once we hit that high, the buy model is complete for that timeframe.
We could still be in a overall bigger one on HTF, so if it looks like we are, I would hold a runner and look for possible re entries. This gets more advanced though.
Also, once we hit that high, the buy model is complete for that timeframe.
We could still be in a overall bigger one on HTF, so if it looks like we are, I would hold a runner and look for possible re entries. This gets more advanced though.


Well, that’s it for now. These are the basics. 500 likes on this thread I’ll make an in depth ICT thread going over EVERYTHING
It will contain 5 levels, getting more advanced as it keeps going up a level.
There’s so much I couldn’t fit in here, but this is an introduction
It will contain 5 levels, getting more advanced as it keeps going up a level.
There’s so much I couldn’t fit in here, but this is an introduction
I live trade every day in discord and point all this stuff out live from voice as it’s happening and teach you what FVGs to take/not take etc. ($15 for live)
All hindsight education will be for free‼️
My discord - discord.gg/ydyHbFNs
Patreon - patreon.com/dodgysdd?utm_c…
GL !
All hindsight education will be for free‼️
My discord - discord.gg/ydyHbFNs
Patreon - patreon.com/dodgysdd?utm_c…
GL !
Thank you @I_Am_The_ICT
• • •
Missing some Tweet in this thread? You can try to
force a refresh