
5 Technical + Fundamental Courses for FREE By FinGrad Academy
A Thread🧵
Courses Worth : ₹20k - ₹50k
🔥Courses for everyone :
1️⃣Short Term Swing Trader
2️⃣Long Term Investor
3️⃣FNO Trader
4️⃣Value Investor
Do Retweet for such FREE content
A Thread🧵
Courses Worth : ₹20k - ₹50k
🔥Courses for everyone :
1️⃣Short Term Swing Trader
2️⃣Long Term Investor
3️⃣FNO Trader
4️⃣Value Investor
Do Retweet for such FREE content
@FinGrad academy is offering stock market courses for 𝗙𝗥𝗘𝗘.
Here are 5 courses that you don't want to miss👇
Here are 5 courses that you don't want to miss👇
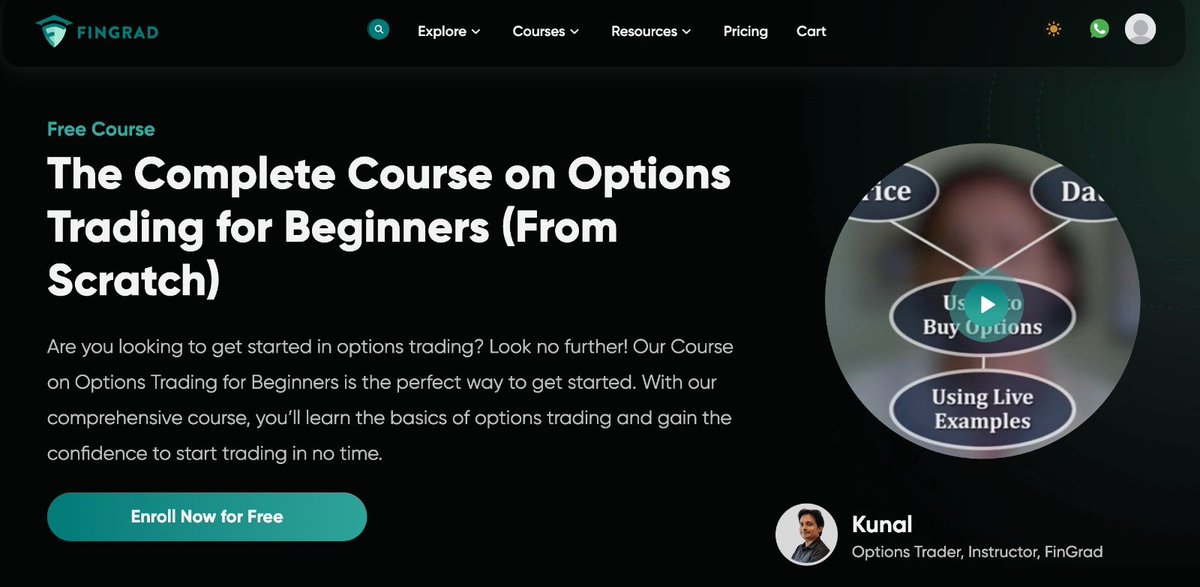
1️⃣ The Complete Course on Options Trading for Beginners
🔸 Learn the basics of Options Trading using technicals.
🔸 It is designed for newcomers to intermediate traders who want to learn the practical approach to Options Trading in the Indian Markets
joinfingrad.com/courses-detail…
🔸 Learn the basics of Options Trading using technicals.
🔸 It is designed for newcomers to intermediate traders who want to learn the practical approach to Options Trading in the Indian Markets
joinfingrad.com/courses-detail…
️2️⃣ Stock Market Investing for Beginners
🔸 Learn the basics to invest successfully in the Indian stock market through a comprehensive, yet simple course for beginners.
🔸 A Smarter Stock investing foundation course to get you started.
joinfingrad.com/courses-detail…
🔸 Learn the basics to invest successfully in the Indian stock market through a comprehensive, yet simple course for beginners.
🔸 A Smarter Stock investing foundation course to get you started.
joinfingrad.com/courses-detail…

3️⃣ 𝗩𝗮𝗹𝘂𝗲 𝗜𝗻𝘃𝗲𝘀𝘁𝗶𝗻𝗴 𝗳𝗼𝗿 𝗕𝗲𝗴𝗶𝗻𝗻𝗲𝗿𝘀
🔸 Learn the basics of time-tested Value Investing principles.
🔸 The strategies taught in this value investing course will help you pick value stocks in the Indian stock market.
joinfingrad.com/courses-detail…
🔸 Learn the basics of time-tested Value Investing principles.
🔸 The strategies taught in this value investing course will help you pick value stocks in the Indian stock market.
joinfingrad.com/courses-detail…

4️⃣ 𝗖𝗮𝗻𝗱𝗹𝗲𝘀𝘁𝗶𝗰𝗸𝘀 𝗧𝗿𝗮𝗱𝗶𝗻𝗴 𝗳𝗼𝗿 𝗕𝗲𝗴𝗶𝗻𝗻𝗲𝗿𝘀
🔸 Master the basics of trading using candlestick patterns through this exclusive candlestick trading course for beginners.
🔸 A must-course for day traders.
joinfingrad.com/courses-detail…
🔸 Master the basics of trading using candlestick patterns through this exclusive candlestick trading course for beginners.
🔸 A must-course for day traders.
joinfingrad.com/courses-detail…

5️⃣ 𝗙𝘂𝘁𝘂𝗿𝗲𝘀 𝗧𝗿𝗮𝗱𝗶𝗻𝗴: 𝗟𝗲𝗮𝗿𝗻 𝘁𝗼 𝗧𝗿𝗮𝗱𝗲 𝗙𝘂𝘁𝘂𝗿𝗲𝘀 𝗶𝗻 𝗜𝗻𝗱𝗶𝗮
🔸 Learn the Basics of Futures to Level Up Your Trading with this step-by-step tutorial for beginners.
joinfingrad.com/courses-detail…
🔸 Learn the Basics of Futures to Level Up Your Trading with this step-by-step tutorial for beginners.
joinfingrad.com/courses-detail…

Signup to 𝗙𝗶𝗻𝗚𝗿𝗮𝗱 today to start your stock market trading journey.
Click here: joinfingrad.com/register/?refe…
Also, use coupon code “𝗝𝗔𝗬𝗡𝗘𝗦𝗛𝟯𝟬” to get 𝟯𝟬% 𝗼𝗳𝗳 on the premium subscription.
Coupon valid for a 𝘭𝘪𝘮𝘪𝘵𝘦𝘥 𝘵𝘪𝘮𝘦 𝘰𝘯𝘭𝘺
#Collab
(9/9)
Click here: joinfingrad.com/register/?refe…
Also, use coupon code “𝗝𝗔𝗬𝗡𝗘𝗦𝗛𝟯𝟬” to get 𝟯𝟬% 𝗼𝗳𝗳 on the premium subscription.
Coupon valid for a 𝘭𝘪𝘮𝘪𝘵𝘦𝘥 𝘵𝘪𝘮𝘦 𝘰𝘯𝘭𝘺
#Collab
(9/9)
If you like this thread please retweet the first tweet and follow me for more!
https://twitter.com/JayneshKasliwal/status/1628388266356482049
• • •
Missing some Tweet in this thread? You can try to
force a refresh


