Mortgage Applications to buy a house just collapsed to an index level of 147.📉
That's the lowest level of buyer demand in 28 YEARS.
Lower than anything we saw in the 2008 Crash.
Down 41% from last year.
(Source: Mortgage Bankers Association)
That's the lowest level of buyer demand in 28 YEARS.
Lower than anything we saw in the 2008 Crash.
Down 41% from last year.
(Source: Mortgage Bankers Association)

1) Collapsing Mortgage Demand is a huge problem for the US Housing Market.
Because despite all the reports of "cash offers", they still only represent 29% of home sales.
The other 71% still require a Mortgage to complete the transaction.
(Source: NAR)
cdn.nar.realtor/sites/default/…
Because despite all the reports of "cash offers", they still only represent 29% of home sales.
The other 71% still require a Mortgage to complete the transaction.
(Source: NAR)
cdn.nar.realtor/sites/default/…

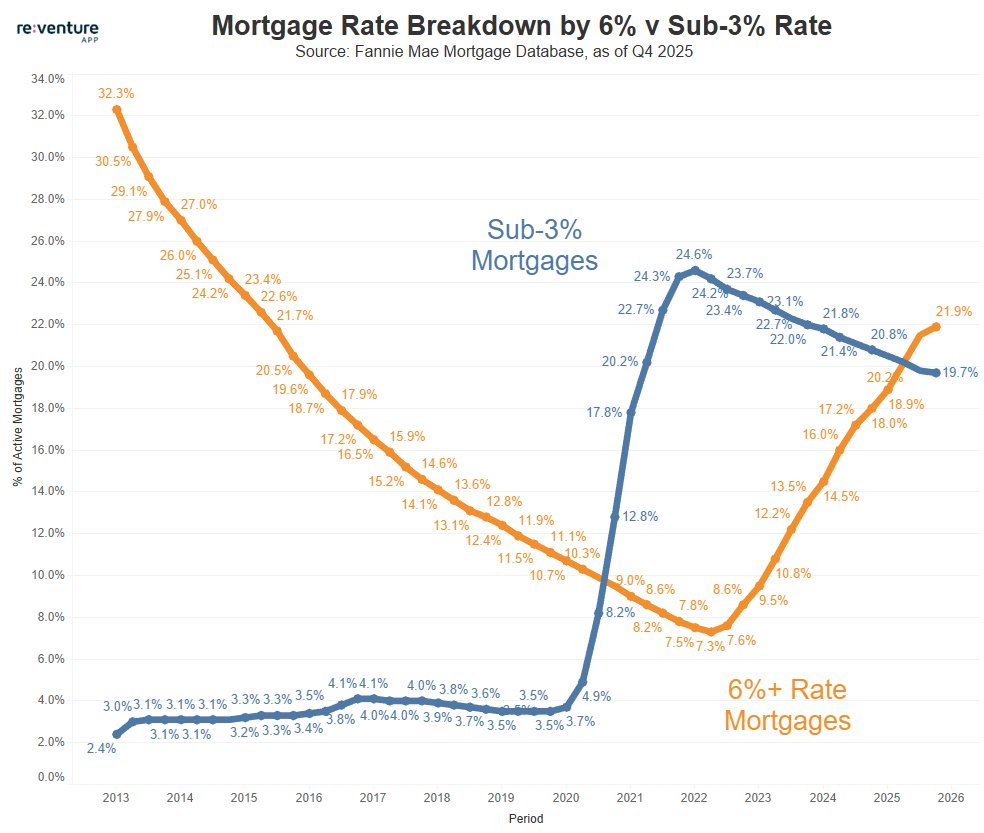
2) Why is Mortgage Demand collapsing so much?
Because both Home Prices AND Mortgage Rates are way too high.
Creating a situation where the monthly payment for a homebuyer (Mtg+Tax+Insurance) is now over $2,500/month.📈
In the 2006-07 Bubble it peaked at $1,400/month.
Because both Home Prices AND Mortgage Rates are way too high.
Creating a situation where the monthly payment for a homebuyer (Mtg+Tax+Insurance) is now over $2,500/month.📈
In the 2006-07 Bubble it peaked at $1,400/month.

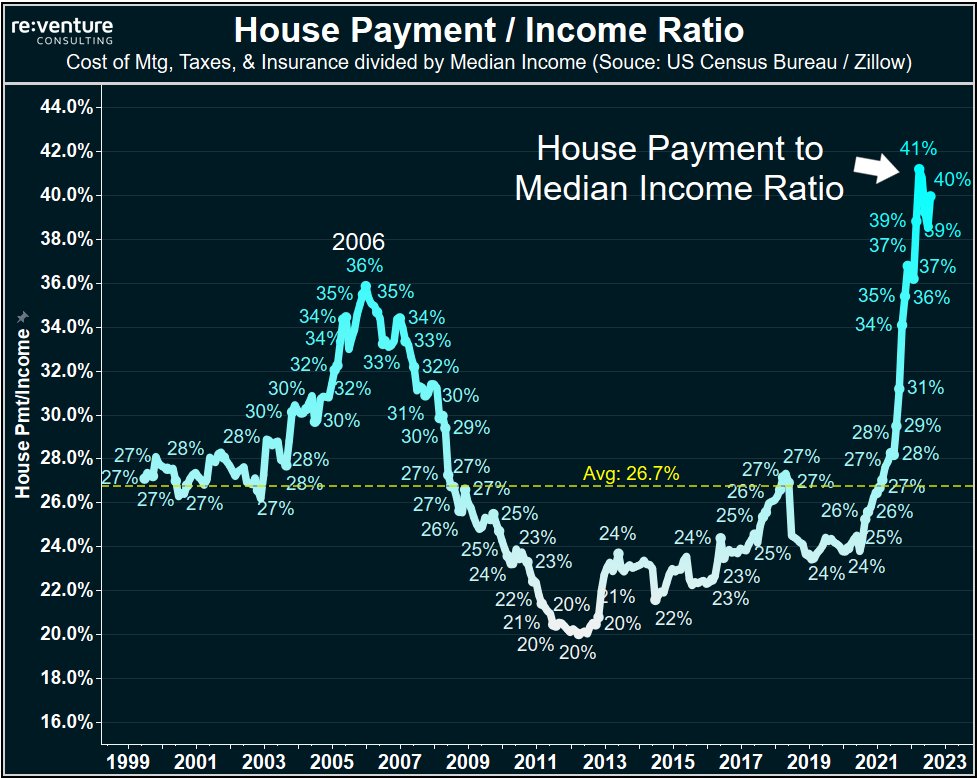
3) And Income Growth has NOT kept up with these increase in the cost to buy house.
Right now the House Payment / Median Income Ratio is 40%.
Meaning the typical American family CANNOT AFFORD to buy a house. ❌
This isn't a "choice". It's simple math.
Right now the House Payment / Median Income Ratio is 40%.
Meaning the typical American family CANNOT AFFORD to buy a house. ❌
This isn't a "choice". It's simple math.
4) Which makes the propaganda being spewed about a "recovery" in the Housing Market absolutely laughable.
Nothing in the fundamental data supports a recovery.
In fact, quite the opposite when you consider a Recession and increased foreclosures are likely on the horizon.
Nothing in the fundamental data supports a recovery.
In fact, quite the opposite when you consider a Recession and increased foreclosures are likely on the horizon.
5) The default rate on FHA loans is going up fast right now.
Currently it's visible in the 30-day default rate.
But soon it could spread to 60 and 90-day defaults, which would be what triggers foreclosure filings.
Currently it's visible in the 30-day default rate.
But soon it could spread to 60 and 90-day defaults, which would be what triggers foreclosure filings.

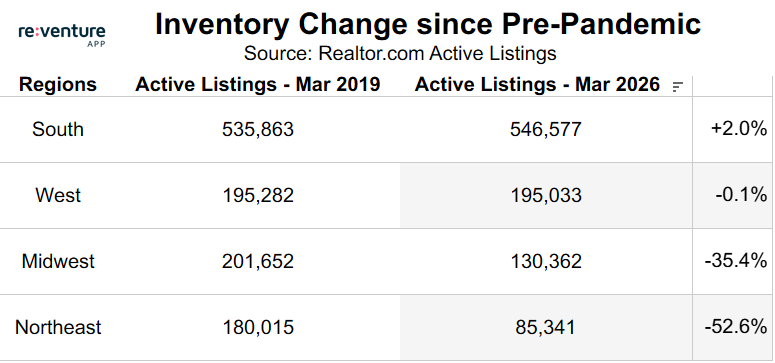
6) Higher foreclosures is one thing which would trigger an inventory spike and lower prices.
Another is if the 14 Million Americans who own vacant homes decide to sell.
If only 5% of the owners of vacant homes sell and cash out, that would DOUBLE Homes for Sale.
Another is if the 14 Million Americans who own vacant homes decide to sell.
If only 5% of the owners of vacant homes sell and cash out, that would DOUBLE Homes for Sale.

7) As the old adage goes - "Something has to break".
The current state of the US Housing Market with:
1) Near record high prices.
2) 7% Mortgage Rates.
3) Sellers refusing to cut the price.
Will not last. Something will break.
The current state of the US Housing Market with:
1) Near record high prices.
2) 7% Mortgage Rates.
3) Sellers refusing to cut the price.
Will not last. Something will break.
8) The easiest thing to "break" is Home Prices. We're already seeing this among Home Builders.
When Builders cut the prices by 20%, the buyers come back.
Sellers of existing homes will start to catch on as 2023 progresses.
When Builders cut the prices by 20%, the buyers come back.
Sellers of existing homes will start to catch on as 2023 progresses.
• • •
Missing some Tweet in this thread? You can try to
force a refresh