the stories and narratives around the impact of #odte are pretty contorted. one of them is that the volume of these began increasing in June'22 and because there are net sellers (really?) it goes to explain a decline in vol since then. here's an alternative explanation -->
simply put, equity vol follows realized vol (carry matters most) and realized vol has been driven by the market's ability to see where the Fed is going. that path became clearer as the hiking cycle matured and inflation cooperated...the $MOVE fell and the $VIX followed. -->
first chart is 1w ATM implied the $SPX since June'22 along with 1m realized. Interestingly, by June, 1m realized was 30...what might the implied vol be? pretty darn close to 30 as well. hard to argue that the decline in implied isn't a function of the decline in realized.
Dec'22 saw realized vol below 20. VIX closed '22 at 22. So, what caused the decline in realized? A much stronger argument can be made that the initial pop in realized was due to unwelcome inflation prints, a Fed playing catch-up as it ditched "transitory" and a surge in rate vol.
below, MOVE (top panel), 2 year nominal and 2 year b/e from 2021 ("we are not even thinking about thinking about raising...") to mid 2022. these all moved from the outrageously low levels that persisted in 2021, quickly readjusting...they took equity vol higher in the process
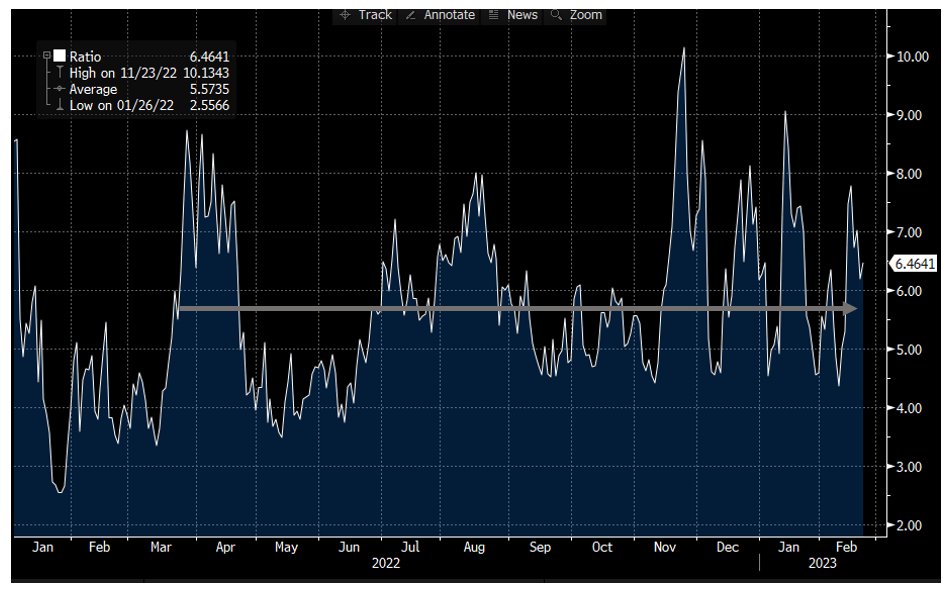
MOVE reverted over the summer, but again reached 160 in October and, again, VIX surpassed 30. the MOVE / VIX ratio (not to be thought of as having mathematical importance but to simply make a point) has been stable between 5 and 7ish. call it the 120/20 regime.
the argument here is that macro developments vastly explain the increase (from 2021 transitory), the episodic bursts, and the ultimate decrease of vol. the idea that sellers are flooding the market with these very high gamma ODTEs doesn't jibe with pricing.
we are told that outright sellers of options are engaging in risk premium generation programs. why? the short rate is nearly 5% and the excess carry doesn't look all that appealing. the premium of the VIX to realized in 2022 was below the 30th %ile in 2022 over last 20 years.
the massive equity vol blowup in 2020 (AIMCO, Allianz, Malachite) left the short vol trade politically untenable at many institutions. 2021 was a great year for the strategy for anyone left to pick up the pieces, but to re-engage in a program of options that expire SAME day?
you'd be selling the risk police internally on a back-test that included in recent history 3 successive days when the SPX had a move of greater than 9%. March 13, 16 and 17th of 2020... -9.5%, +9.3% and down 12%, respectively. "ummm, we excluded those for special circumstances"
and if these outright investors "sell the straddle and go to lunch" (as the saying goes), the buyers would seem to be having an awful time, tripping over themselves hedging and eating time decay. Not obvious at all that this is happening. 2022 had 45 daily SPX moves > +/-2%!
note that just 2 of these moves occurred past November 10th, the day of the giant 5.5% up move in the SPX on the Oct CPI print. That print took a lot of the uncertainty out of the market and bought Powell some time...the market settled in.
in 2017, the dynamic of dangerous short vol exposure was a real thing. the product sizes in the VIX ETP complex were huge and there was something for everyone: vol was both remarkably cheap AND remarkably expensive at the same time. the carry was fantastic...
the VIX averaged 11 and change, roughly 60%(!) higher than realized vol did. the Sharpe of vol selling in 2017 was between 3 and 5 depending on how you might measure it. BUT...all the selling sowed the seeds of its own demise. pushing implied so low and generating so much profit
along the way that got stuffed back into the same trade at eroding margins of safety, the powder keg was properly set for Volmaggedon. this is not that, not even close. no one has effectively made the case that this market is sufficiently lopsided
now as it was then. and re-hedging in SPX is quite different than re-hedging in VIX futures. in conclusion, on the sell-side and in financial press, it's "publish or perish"...our need to connect cause and effect is mostly on display here. Volmaggedon 2.0? Maybe another time.
• • •
Missing some Tweet in this thread? You can try to
force a refresh
One of the most difficult questions to answer is “is it in the price?”. One might present a glowing story for a company with all the stars aligned - effective management, a break-through technology with promising rate of adoption, etc. All good. —->
But, if we subscribe to some reasonable version of market efficiency, we must ask “isn’t all that in the price”? It’s an impossible question to answer but the more accessible this info and the easier it is to access the investment, the more that question should matter.
This is not to suggest that truly rigorous research isn’t worthwhile. On the single stock front, the best in the business appear to have a command of industry dynamics that helps them see the chess board from many angles - competition, corporate synergies, regulation, etc.
In October 2012, fresh off the 2011 debt ceiling crisis and approaching the 2013 "fiscal cliff", I hosted an investor dinner in NYC featuring Senator Alan Simpson. Turns out it was the night that Superstorm Sandy wrecked havoc. We regrouped and had the dinner a month later.
An imposing figure at 6'7 with a distinctive (Wyoming?) dialect, the Senator talked about debt and the "Simpson Bowles Plan". His speech was lively, direct and peppered with salty language. The best line of his talk was "the problem is, no one knows just how much a trillion is."
When he and (Democrat) Erskine Bowles developed their plan (in 2010), the US national debt was 10T. Under this not outlandishly austere deficit reduction plan, the debt was projected to climb to 15T in 2022. It's currently more than 31T.
when thinking about the price of insurance, it's often useful to look at paying premium as reducing the risk of being very wrong. if I am really bullish on a stock, but also recognize that in markets, "sht happens" and I could be very wrong,
best to look at the premium for a call option as a function of how wrong I might be. There is less risk of being very wrong for Colgate or Campbell's Soup than for TSLA. Same process applies to VIX options. if I buy a VIX call, while I may be betting that vol rises, I may also
be motivated by a fear that I might be very wrong and the VIX collapses. here, the call option reduces my exposure to loss versus just owning a VIX future. currently, while the VIX is in the 75th %ile over the past 10 years, the VVIX is in 7th %ile.
a short series on hedging by way of a trade that did occur and one that didn't but would have worked well. Comparing Mark Cuban in YHOO to Elon Musk in TSLA and then broadening to current market pricing setup. ===>
In 1999, Mark Cuban famously hedged the YHOO stock he received from selling Broadcast.com. He used a zero cost collar (long put financed by selling a call). The trade saved him a fortune. The pricing of the trade was gorgeous.
with YHOO at 95, Cuban bought a 3 yr 85 strike put (11% OTM) and sold a 205 call (216% OTM). This compelling set of prices was a function of 3 variables. 1. the level of interest rates 2. the level of implied volatility 3. the shape of the volatility "skew"
interesting to compare 2022 to other years with similar SPX realized vol. 2011 has same overall realized vol, but starkly different in other ways. here's 2011 and 2022, both around 23.5 realized vol, but giant diff in realized correlation.
stock to stock correlation was much higher back then. a second notable difference is stock to bond correlation. in 2011, "risk on/risk off" was in full swing and 10y yields fell by about 150bps. This year, they have risen by roughly the same.
last difference between 2011 and 2022, despite these years having same overall realized SPX vol is the responsiveness of the VIX. then, considerably more responsive to SPX moves than now, as shown in the betas of the 2 regressions.
no doubt a lot of discussion coming on the quarterly SPX put spread collar roll. 3835 call strike is basically ATM and the collar gamma is now 1.7bln per 1% move in SPX. it's easy to isolate, but pretty difficult to disentangle the impact of hedging this position on the market.
an interesting, forward looking question is on trade structure itself. while the "strategy" calls for a put spread collar, it's worth contemplating if this is optimal for 2023. so let's review. below, the quarterly puts and their value from inception to expiry. all finished OTM.
so, these have all successfully reduced the cost of the overall hedge. the average price of the 80 put has been 55bps with the most recent trade, the Dec'22 expiry, having the highest premium of ~94bps. if the trade were rolled Friday, we can see what the 80% put looks like.