A Friday AM thread on randomization inference (RI):
For a randomized experiment, a key difference between RI and standard statistical methods is that RI treats the sample as fixed and the treatment assignment as random, while standard statistics treats the sample as random
For a randomized experiment, a key difference between RI and standard statistical methods is that RI treats the sample as fixed and the treatment assignment as random, while standard statistics treats the sample as random
In a simple t-test to compare a treatment to control, a p-value is obtained using the null distribution of the t-statistic. This null distribution comes from hypothetical repeats of this experiment (under H0), each with a different random sample from the population of interest.
In RI, we think about potential outcomes: What would we have observed for this sample if we had obtained a different treatment assignment (by chance)? This becomes a missing data problem, which we can think about using Fisher's "science table"
Here's an example, taken from @causalinf 's The Mixtape. We have 8 individuals in our (fixed) sample, with half assigned to group 1 (D=1) and half assigned to group 0 (D=0). For those with D=1, we only observe Y(1), their response under treatment, but we don't observe Y(0)! 
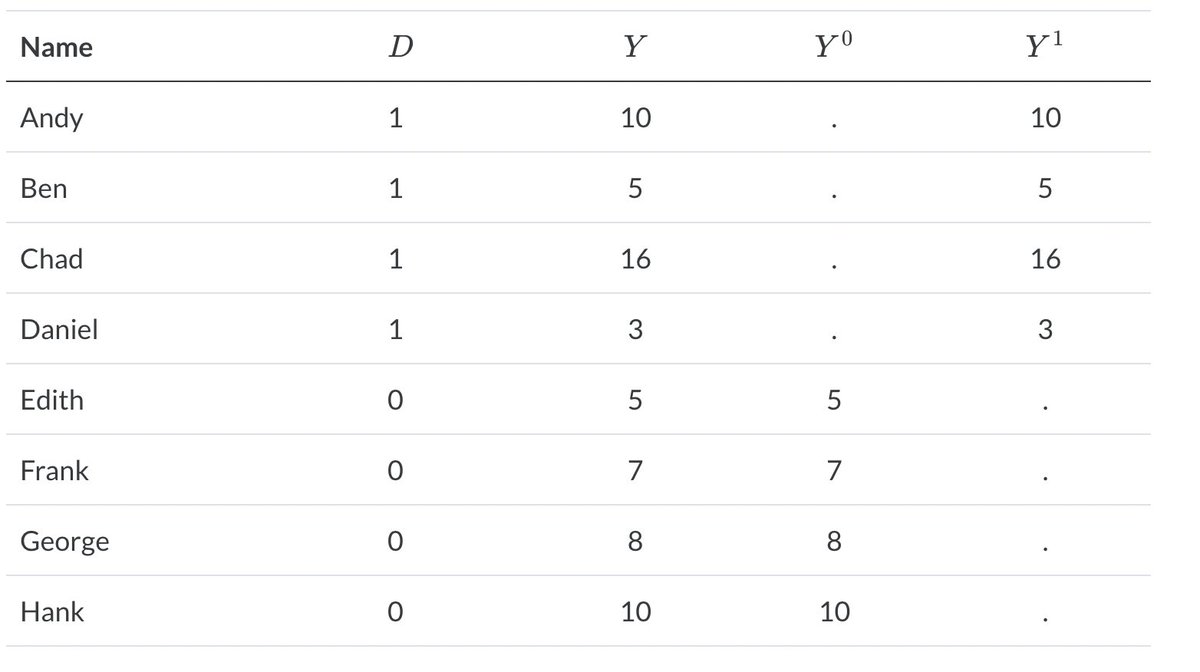
And vice-versa for those with D=0. The standard null hypothesis for RI is Fisher's sharp null, that Y(1) = Y(0) for each individual. In other words, each individual's response would have been exactly the same if they had been randomly assigned to the other group.
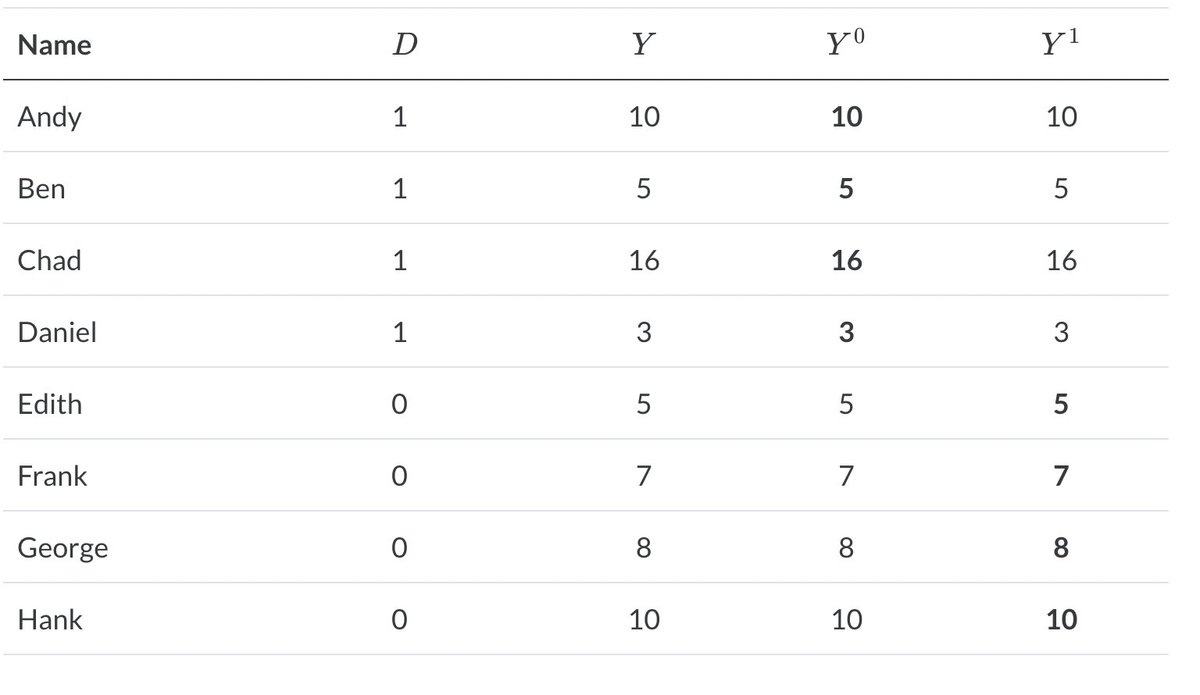
Of course, we never get to observe Y(1) if D=0 (or Y(0) if D=1). But if the sharp H0 is true, then we know Y(1) must equal Y(0) for each individual. This helps us create our RI null distribution, the distribution of our test statistic if the sharp H0 is true.
We start by calculating our statistic of interest (i.e. difference in group averages) from the observed data. We then create our null distribution by re-randomizing our treatment assignments. If a unit gets assigned D=0 when D(obs) = 1, you impute their Y(0) with their Y(1).
And if a unit gets assigned D=1 when D(obs) = 0, you impute Y(1) with Y(0). If D = D(obs), you use Y(obs). Each time you do this (computerized) re-randomization, you calculate your statistic of interest.
The null distribution under H0 is the distribution of these statistics over all possible randomizations. When N is small per group, we can actually fully compute this null distribution. If N is really large, we can use modern computing to get a monte carlo approximation!
The appealing aspect of RI is that there is no need for asymptotic approximations. If the sharp null is true, the computed distribution is the exact null distribution! You can then get your Fisher exact p-value by comparing your observed test statistic to the null distribution
This is what i think makes RI different from a general permutation test: the physical randomization gives us a guarantee that our computed null distribution is exact! In addition, you have to re-randomize your treatment assignments according to the physical randomization scheme
A common argument against RI is that the sharp null is too restrictive. It might be of more interest to test the weak null that the *average* of the potential outcomes in each group is equal between the groups.
Jason Wu & Peng Ding show that if you use a studentized statistic, you asymptotically are getting the null distribution under the weak null hypothesis, as well as always getting the exact null distribution under the sharp null (DOI: 10.1080/01621459.2020.1750415)
In a follow-up paper when they show how to adjust for covariates using RI (arxiv.org/pdf/2010.14555…) they say "we believe (RI) should be the default choice for analyzing experimental data given its flexibility
to accommodate complex randomization schemes and arbitrary"
to accommodate complex randomization schemes and arbitrary"
I don't think this is very widely used (at least not in my field) for two reasons: 1) This was impossible to do before computers, and so the t-distribution (which was used to approximate the exact null distribution!) was used instead 2) It only gives p-values
I wouldn't be surprised if there is more work done to show how you can get effect size estimates & confidence intervals. One idea is instead if setting the unobserved value to the observe value in the re-randomization, you add some constant tau.
You do this for many different values of tau, and the one that gets the smallest p-value is the effect size estimate, and a CI can be formed by using all values of tau for which you do not reject the sharp null hypothesis.
I am not an expert in this and have not published any work using RI. The econometrics field has thought about this way more, and I hope #EconTwitter jumps into this thread to give their thoughts and give examples of work on or using RI that I've missed.
Some resources and papers that I've found helpful are:
1) Lecture notes by @matt_blackwell : mattblackwell.org/files/teaching…
2) Re-randomization tests in clinical trials: pubmed.ncbi.nlm.nih.gov/30672002/
3) The ri2 R package: cran.r-project.org/web/packages/r…
1) Lecture notes by @matt_blackwell : mattblackwell.org/files/teaching…
2) Re-randomization tests in clinical trials: pubmed.ncbi.nlm.nih.gov/30672002/
3) The ri2 R package: cran.r-project.org/web/packages/r…
4) When possible, report a Fisher-exact P value and display its underlying null randomization distribution (pnas.org/doi/10.1073/pn…)
5) Work by Peng Ding: tandfonline.com/doi/abs/10.108… and sciencedirect.com/science/articl…
5) Work by Peng Ding: tandfonline.com/doi/abs/10.108… and sciencedirect.com/science/articl…
Tagging people who might find this interesting: @PhDemetri @ADAlthousePhD @SolomonKurz @stephenjwild @ildiazm @EnriqueLeigh
• • •
Missing some Tweet in this thread? You can try to
force a refresh