How I look at TPO charts 📊
I will discuss what I use/don't use and why.
SETTINGS shared throughout
//COMPLETE TPO THREAD ✅ / Template RELEASE
To receive revamped Daily TPO & Session TPO template for @ExochartsC which is being discussed -
Follow, RETWEET & like this tweet
I will discuss what I use/don't use and why.
SETTINGS shared throughout
//COMPLETE TPO THREAD ✅ / Template RELEASE
To receive revamped Daily TPO & Session TPO template for @ExochartsC which is being discussed -
Follow, RETWEET & like this tweet
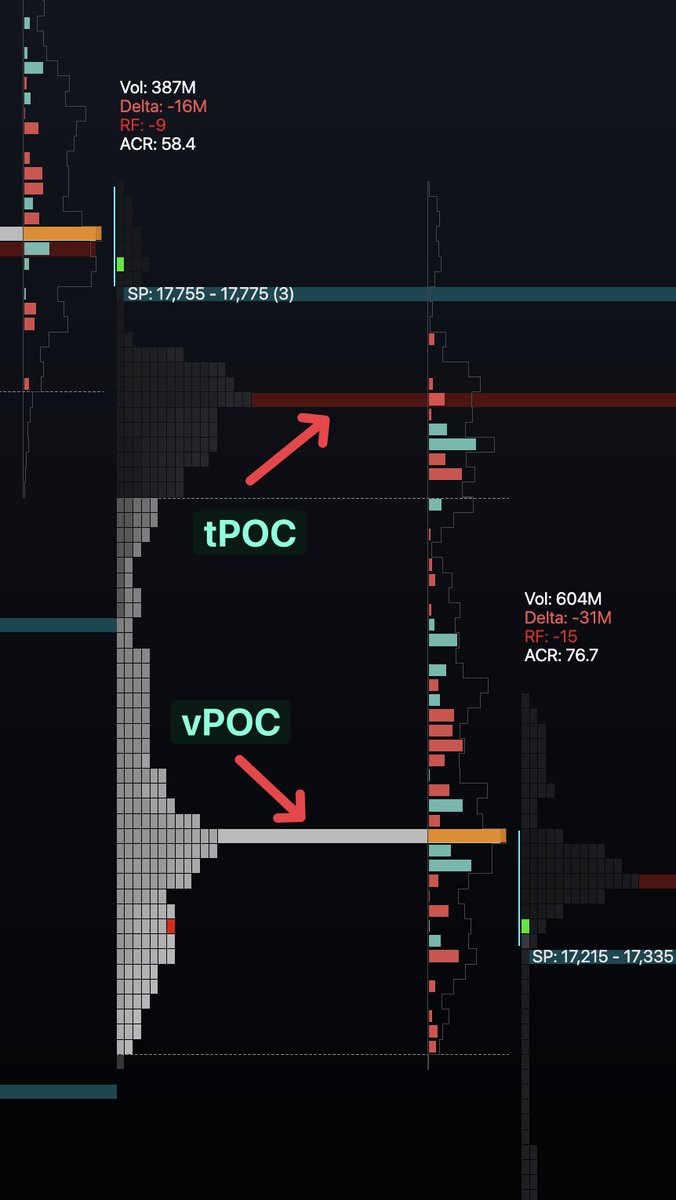
@ExochartsC 1️⃣ vPOC/tPOCs
• VOLUME point of control
• TIME point of control
tPOC - where has price spent the most TIME within this profile?
vPOC - where was the most volume transacted within this profile?
I place more weight on the VOLUME POC.
• VOLUME point of control
• TIME point of control
tPOC - where has price spent the most TIME within this profile?
vPOC - where was the most volume transacted within this profile?
I place more weight on the VOLUME POC.

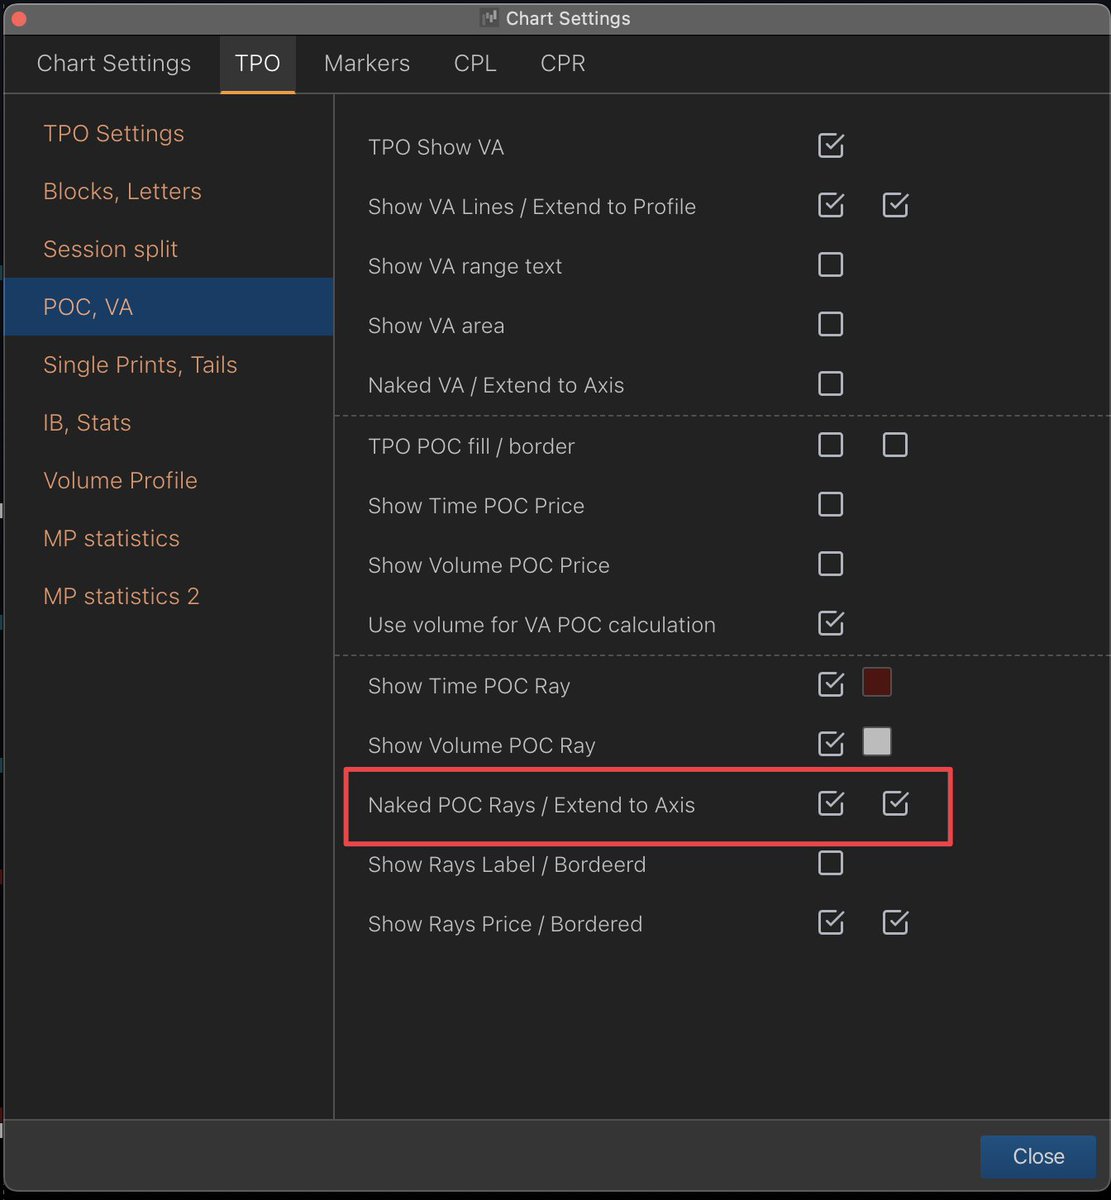
@ExochartsC 1️⃣🅱️ vPOC/tPOCs (Use case)
naked/untapped POCs are the most powerful.
Hence why I extend the naked ones out to mark onto TV
These levels can be key S/R levels with the correct confluence.
(Each TPO session is commonly split up as a daily profile)
naked/untapped POCs are the most powerful.
Hence why I extend the naked ones out to mark onto TV
These levels can be key S/R levels with the correct confluence.
(Each TPO session is commonly split up as a daily profile)
@ExochartsC 2️⃣ Single prints
Inefficiencies in the chart
where single blocks are printed on the TPO chart creating "gaps"
Can be viewed as a magnet to be filled or tested as S/R Levels
I will prefer to see the SP filled as from my testing this is where we will get a better reaction.
Inefficiencies in the chart
where single blocks are printed on the TPO chart creating "gaps"
Can be viewed as a magnet to be filled or tested as S/R Levels
I will prefer to see the SP filled as from my testing this is where we will get a better reaction.
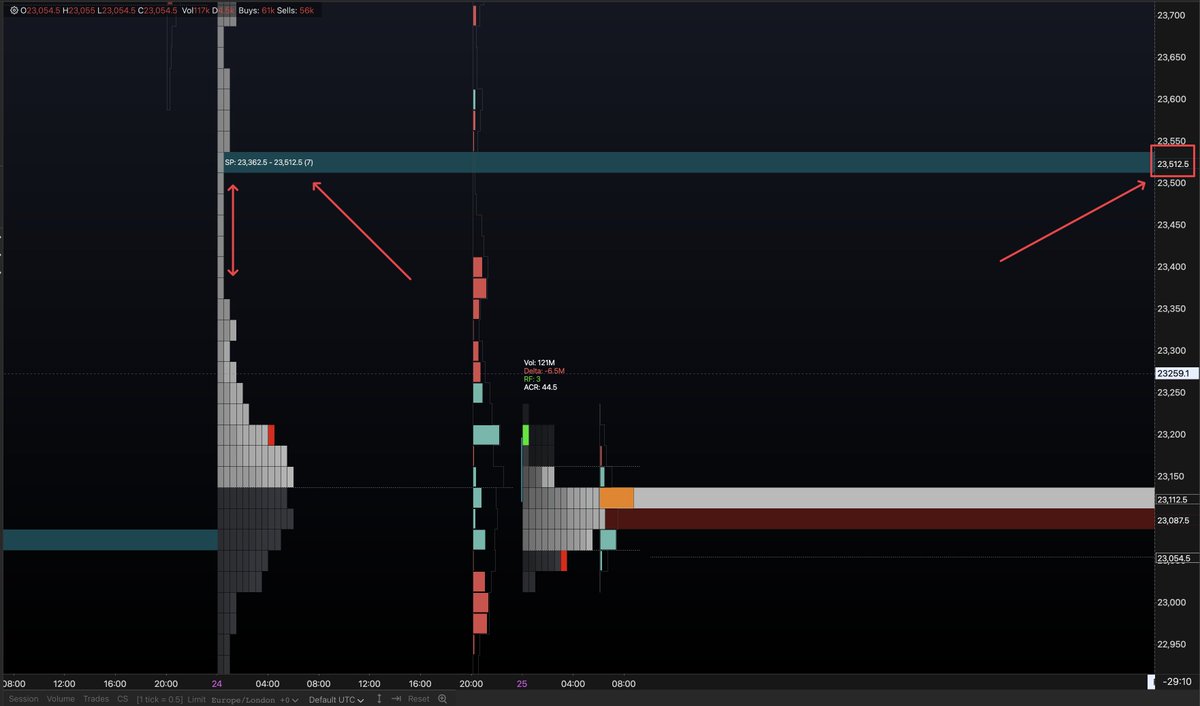
@ExochartsC 2️⃣🅱️ Single prints
In Exo, we created a setting to show once the single print is filled
• "Show only first print range"
Is an option which will show you this.
I extend this ray also as the first touch of these levels can provide good reactions.
In Exo, we created a setting to show once the single print is filled
• "Show only first print range"
Is an option which will show you this.
I extend this ray also as the first touch of these levels can provide good reactions.

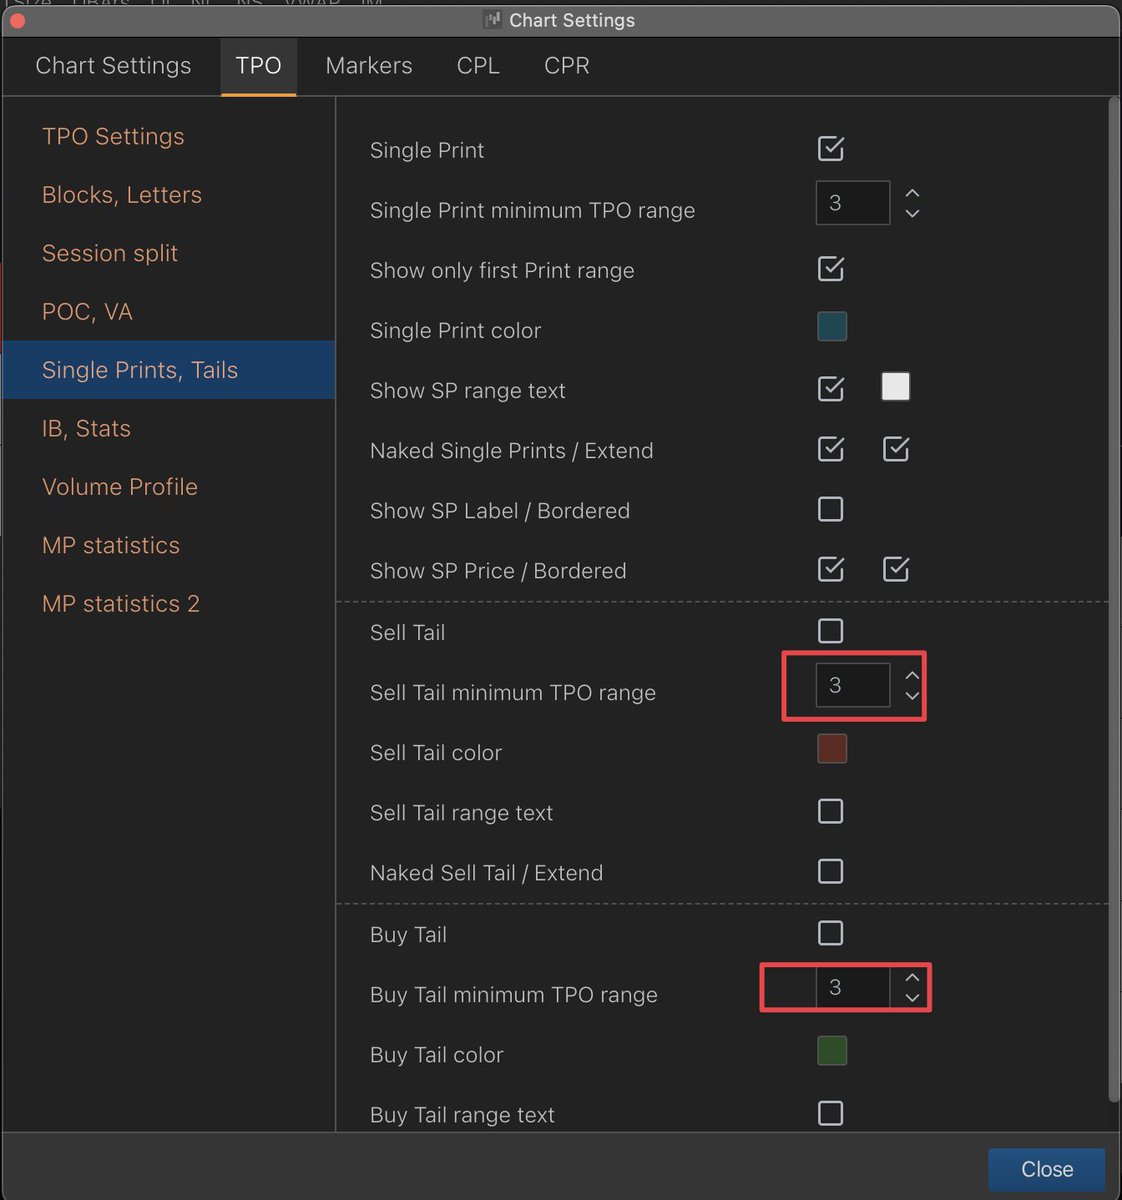
@ExochartsC 3️⃣ ST/BT - poor highs and lows
ST - Selling tail
BT - Buying tail
Single prints occur in the middle of a TPO profile
STs or BTs occur at the top or bottom end.
ST - Selling tail
BT - Buying tail
Single prints occur in the middle of a TPO profile
STs or BTs occur at the top or bottom end.

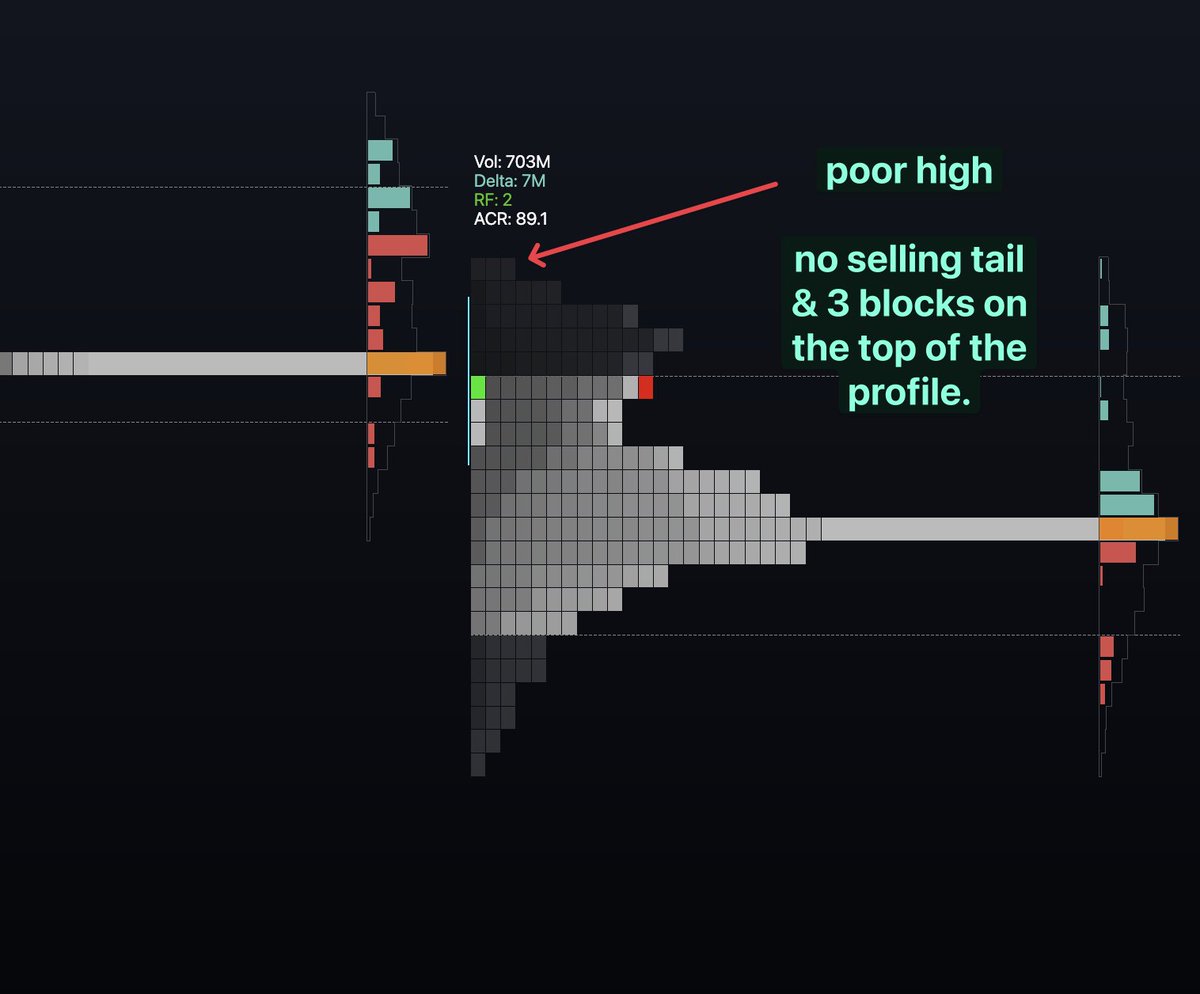
@ExochartsC 3️⃣🅱️ ST/BT - poor highs and lows
If I do not see one of these at an expected pivot point then we can expect that pivot point h/l still will be taken out.
a poor high or poor low is a TPO profile which does not have either an ST or BT at either end of its profile.
If I do not see one of these at an expected pivot point then we can expect that pivot point h/l still will be taken out.
a poor high or poor low is a TPO profile which does not have either an ST or BT at either end of its profile.
@ExochartsC 4️⃣ Session TPOs
Daily TPO sessions are typical they are split by dOpen.
Session TPOs are more often related to trading hours determined by different regions around the world.
I use this for trading intra-day nPOCs and in particular the vPOCs
5min 40tick - nPOCs extended
Daily TPO sessions are typical they are split by dOpen.
Session TPOs are more often related to trading hours determined by different regions around the world.
I use this for trading intra-day nPOCs and in particular the vPOCs
5min 40tick - nPOCs extended

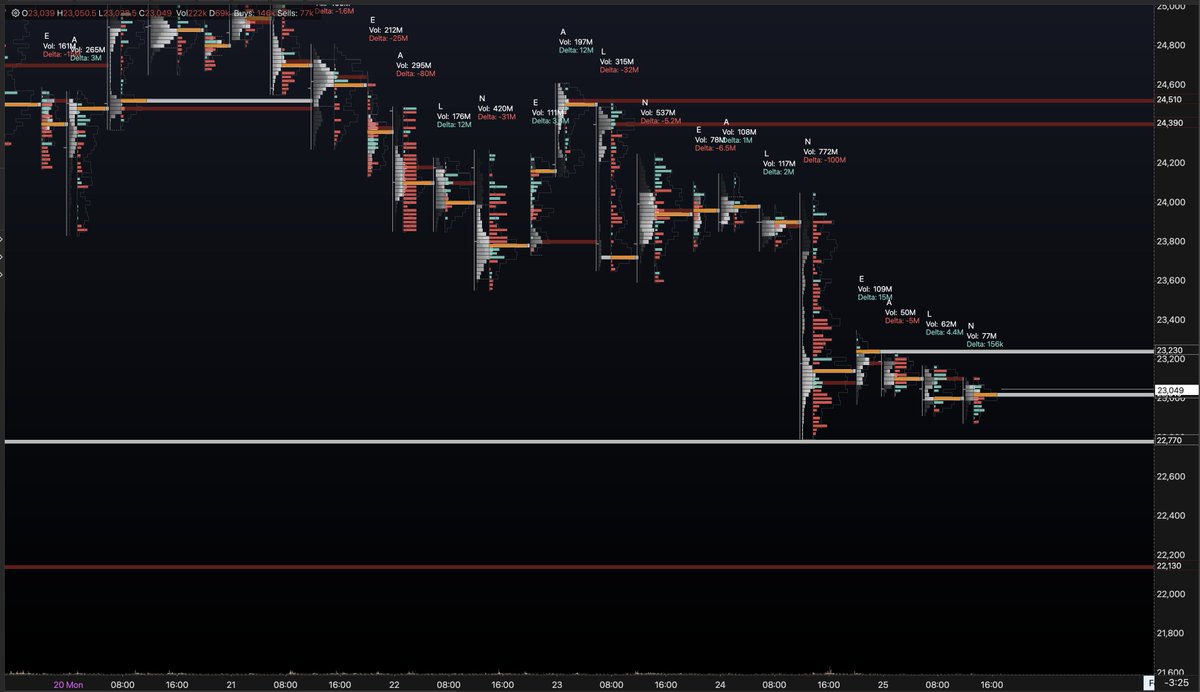
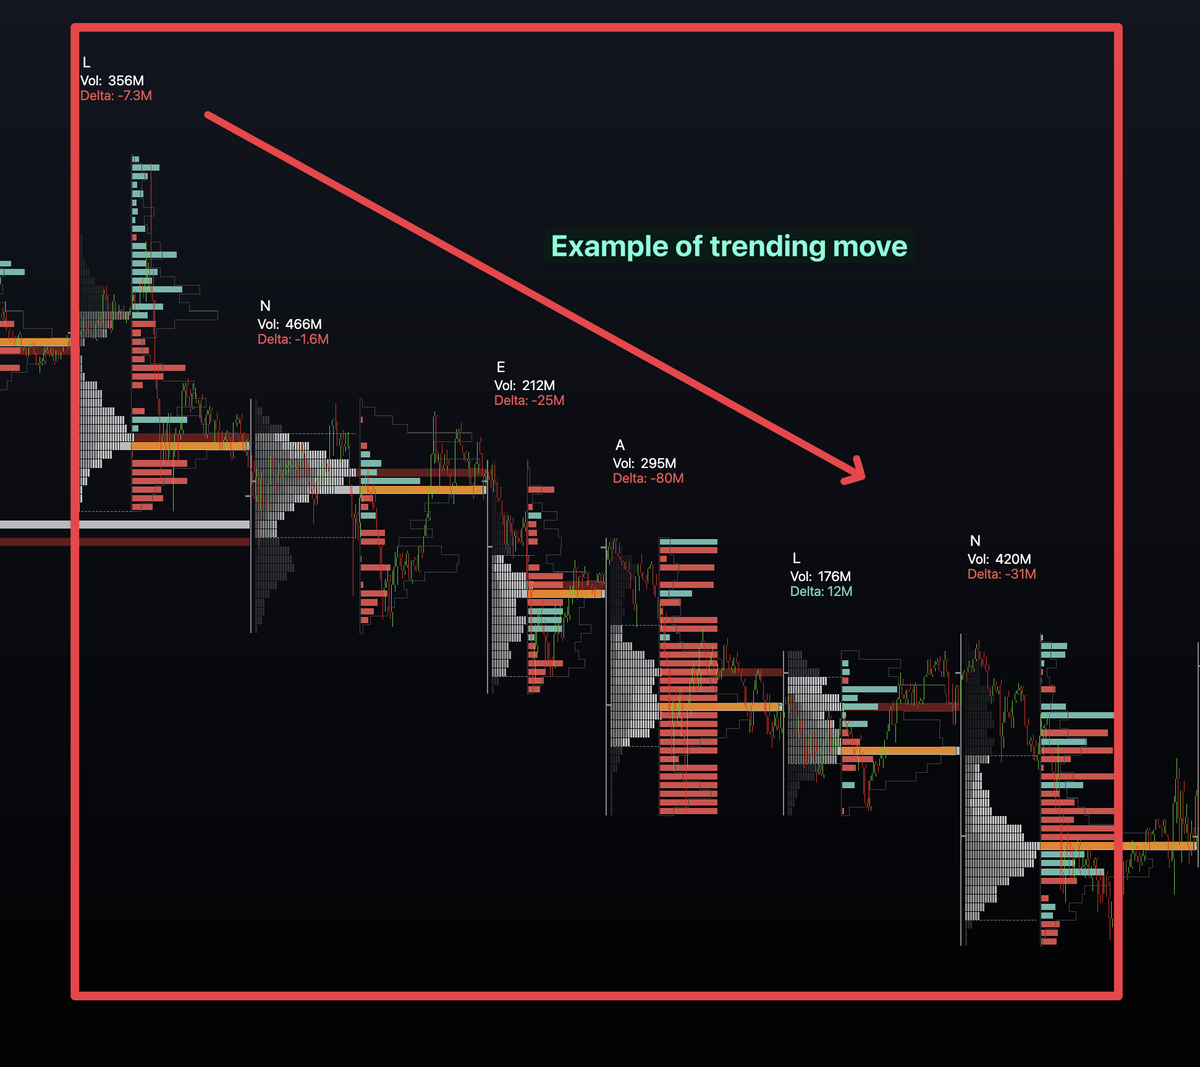
@ExochartsC 5️⃣ Merging sessions
I merge sessions which fit the following criteria:
• Directional trends
• Ranges I've identified via TV
• Sessions with similar VA values
The POC of these merges can have significance with confluence and provide key S/R levels to trade off.
I merge sessions which fit the following criteria:
• Directional trends
• Ranges I've identified via TV
• Sessions with similar VA values
The POC of these merges can have significance with confluence and provide key S/R levels to trade off.

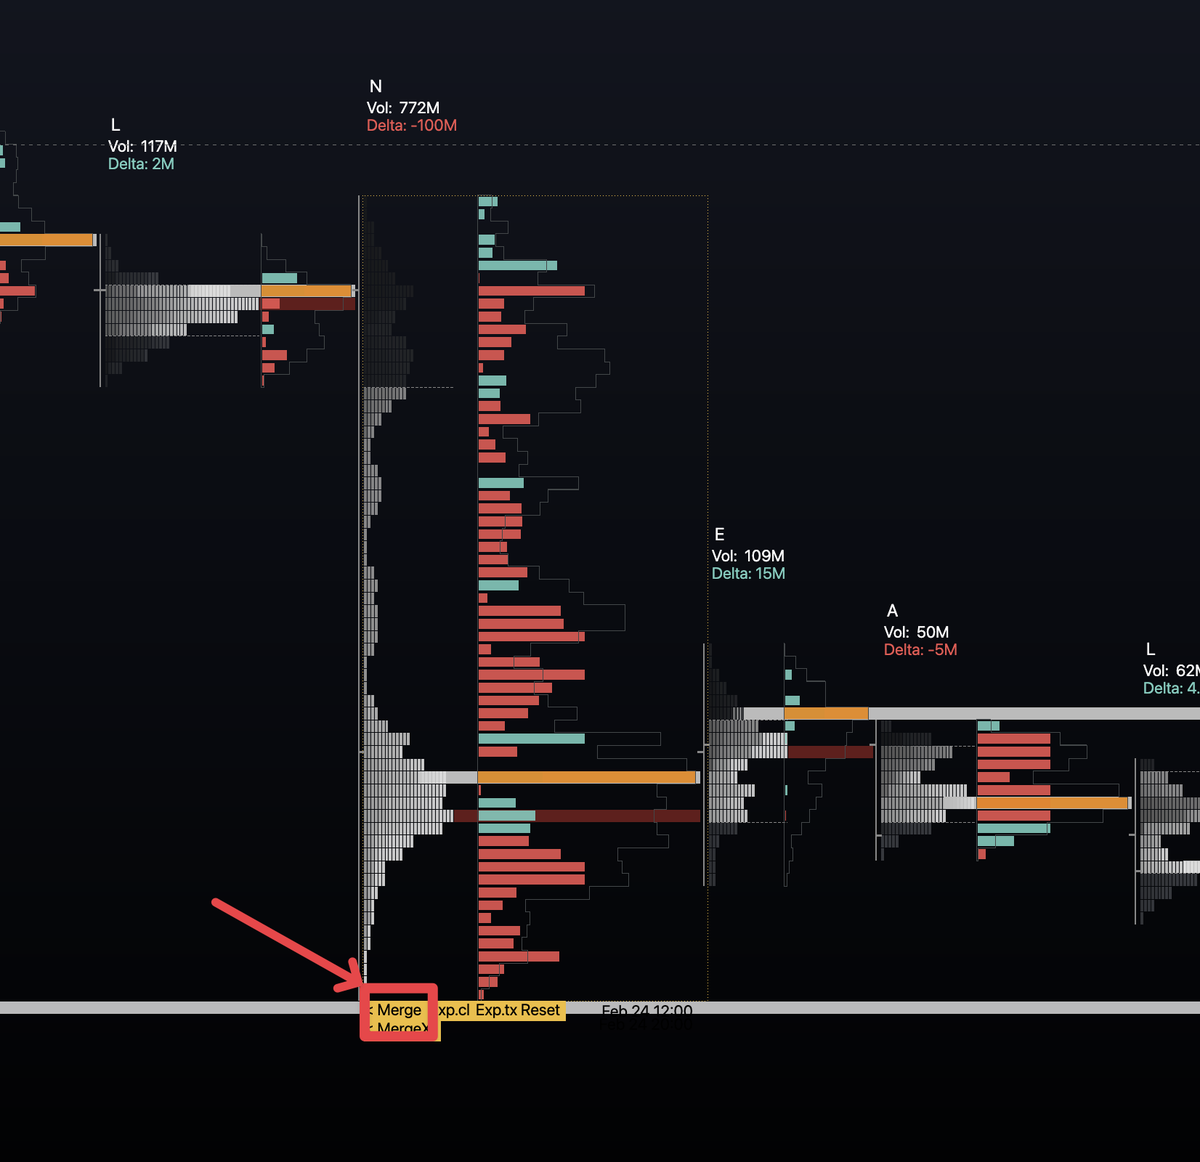
@ExochartsC 5️⃣🅱️ Merging sessions
• Double-click any profile
• Hit the merge button to merge back a profile
OR use merge X to merge back a certain number of profiles.
• Double-click any profile
• Hit the merge button to merge back a profile
OR use merge X to merge back a certain number of profiles.
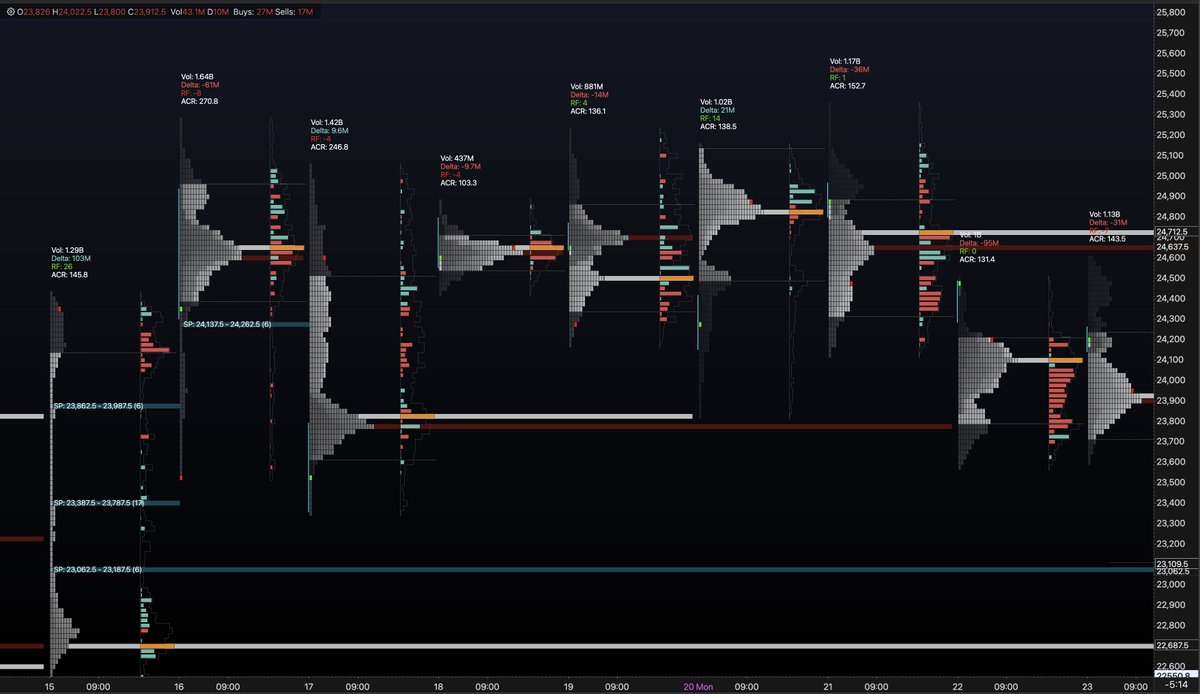
@ExochartsC 6️⃣ POC Discrepancies
Where is the tPOC in relation to the vPOC?
Typically these 2 levels are either very close to one another or at the same level in relation to each TPO profile.
A discrepancy is when these 2 POCs are NOT together.
So what does that mean? 👇
Where is the tPOC in relation to the vPOC?
Typically these 2 levels are either very close to one another or at the same level in relation to each TPO profile.
A discrepancy is when these 2 POCs are NOT together.
So what does that mean? 👇
@ExochartsC 6️⃣🅱️ POC Discrepancies
If we see a break of a range or a trend change & the vPOC is within the direction of the break which then leaves behind the tPOC.
- That would show strength in that move to me as it tells me volume is following the break of the range/trend change
If we see a break of a range or a trend change & the vPOC is within the direction of the break which then leaves behind the tPOC.
- That would show strength in that move to me as it tells me volume is following the break of the range/trend change
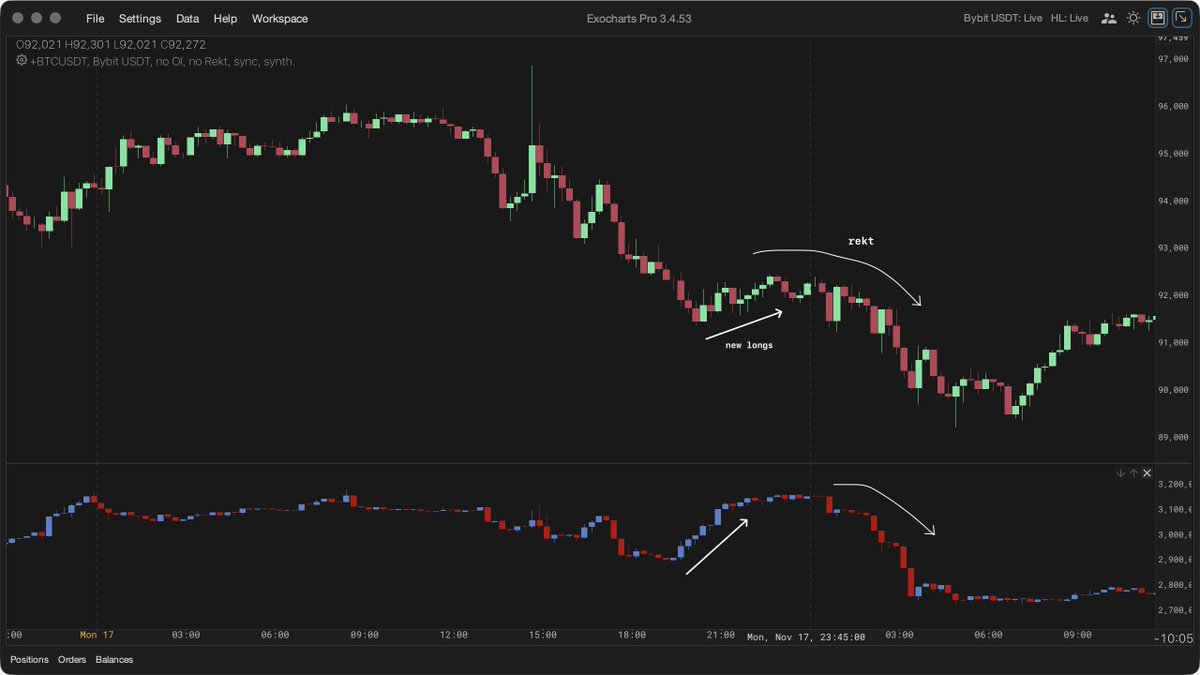
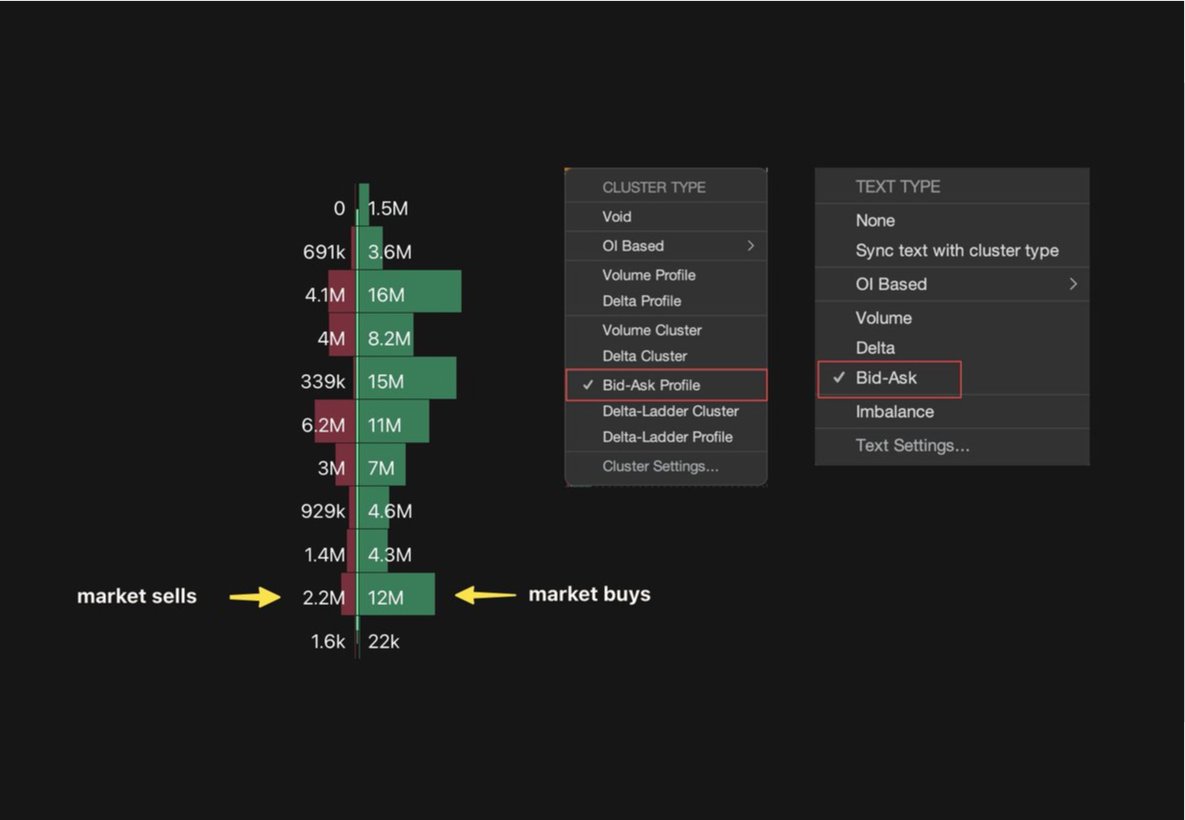
@ExochartsC 7️⃣ Volume profile & Delta overlay
I prefer to see larger blue bars at the top of a profile or large red bars at the bottom of a profile if we are to see a pivot at either point.
This could signify trapped traders.
Then would check OI at those levels within a different tpl.
I prefer to see larger blue bars at the top of a profile or large red bars at the bottom of a profile if we are to see a pivot at either point.
This could signify trapped traders.
Then would check OI at those levels within a different tpl.

@ExochartsC If you enjoyed remember - RT the 1st Tweet of this thread to receive the templates discussed
thanks.
thanks.
• • •
Missing some Tweet in this thread? You can try to
force a refresh