
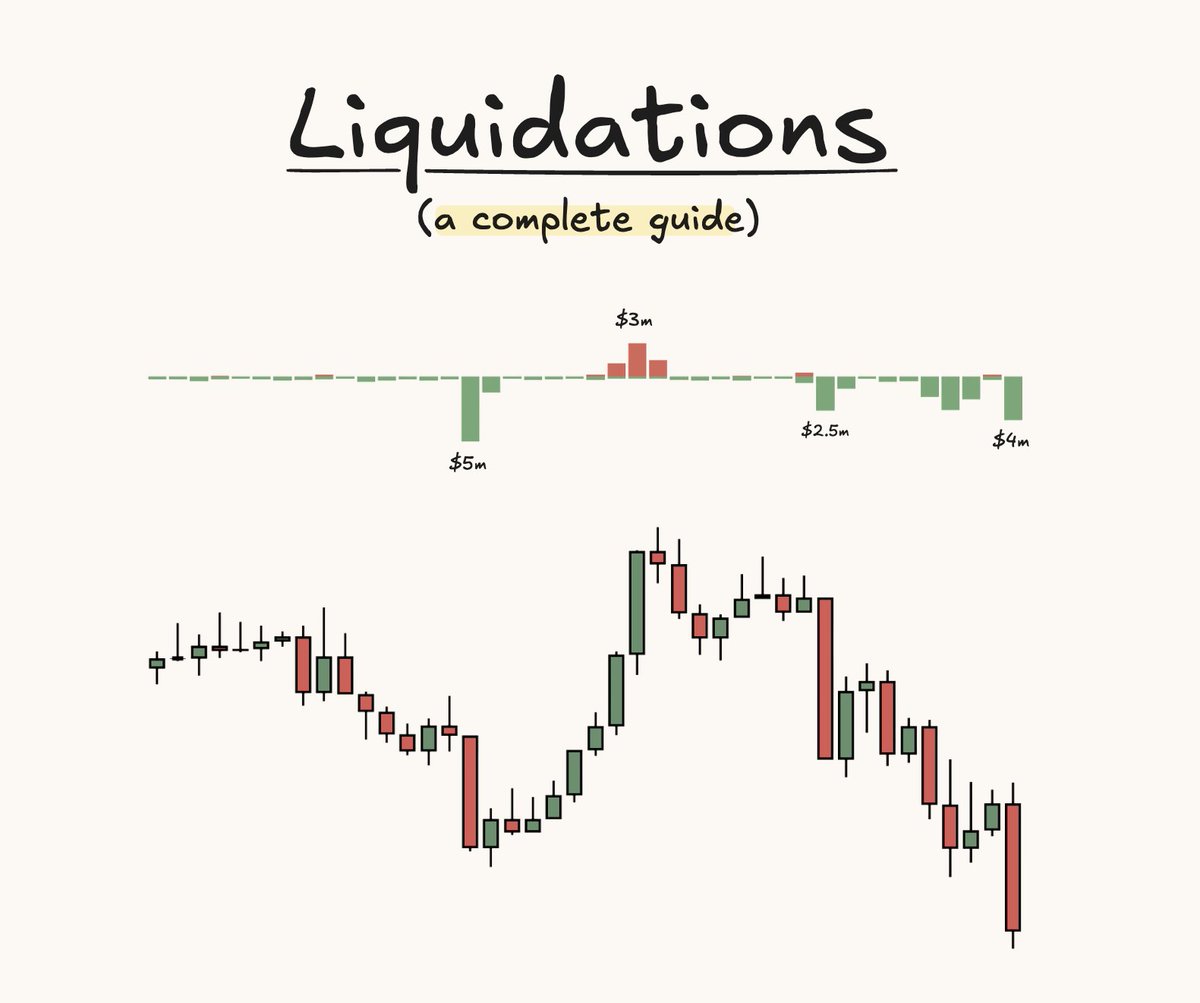
 What are liquidations?
 fading breakout traders:
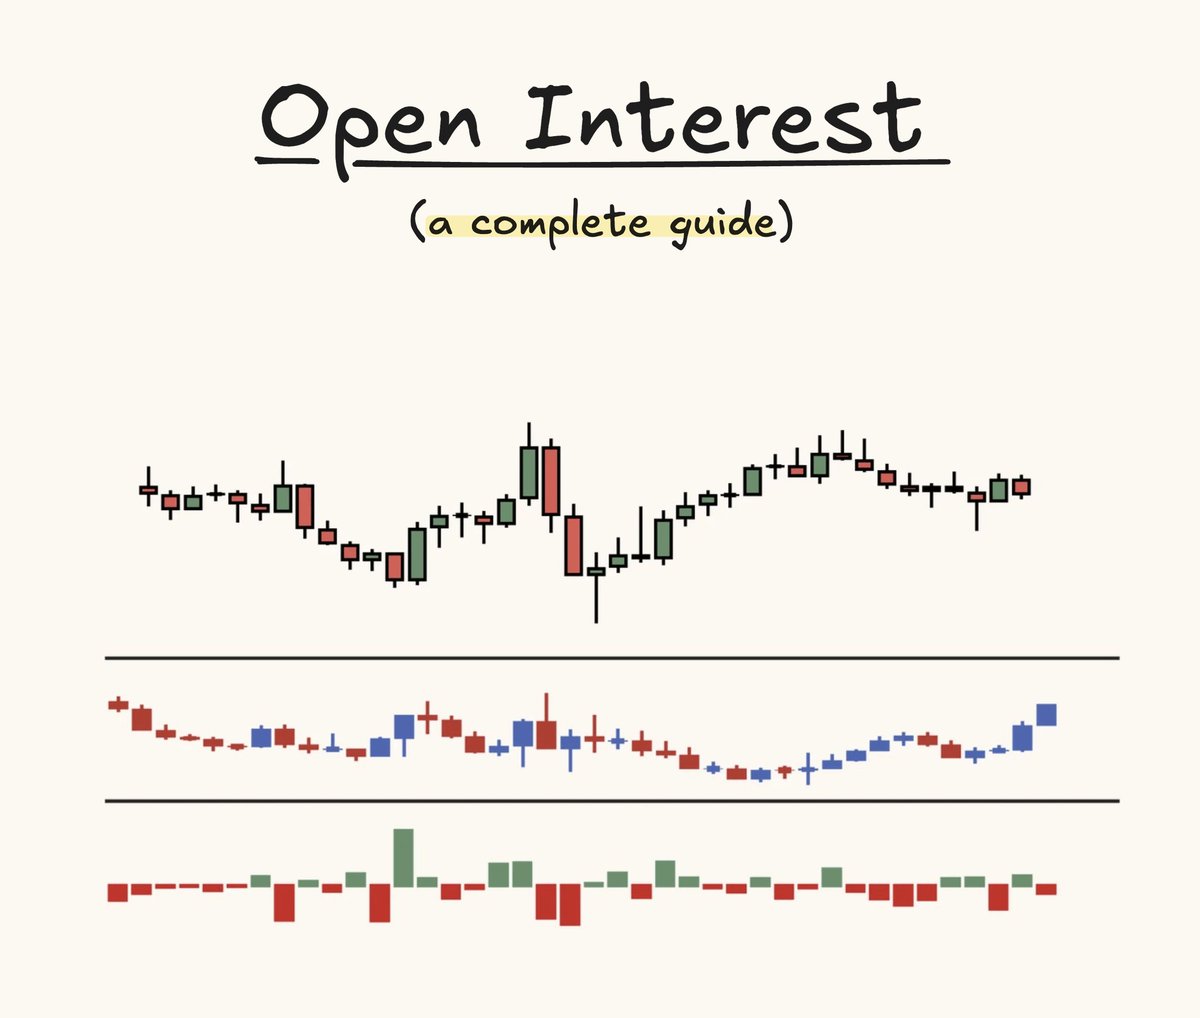 what is open interest?
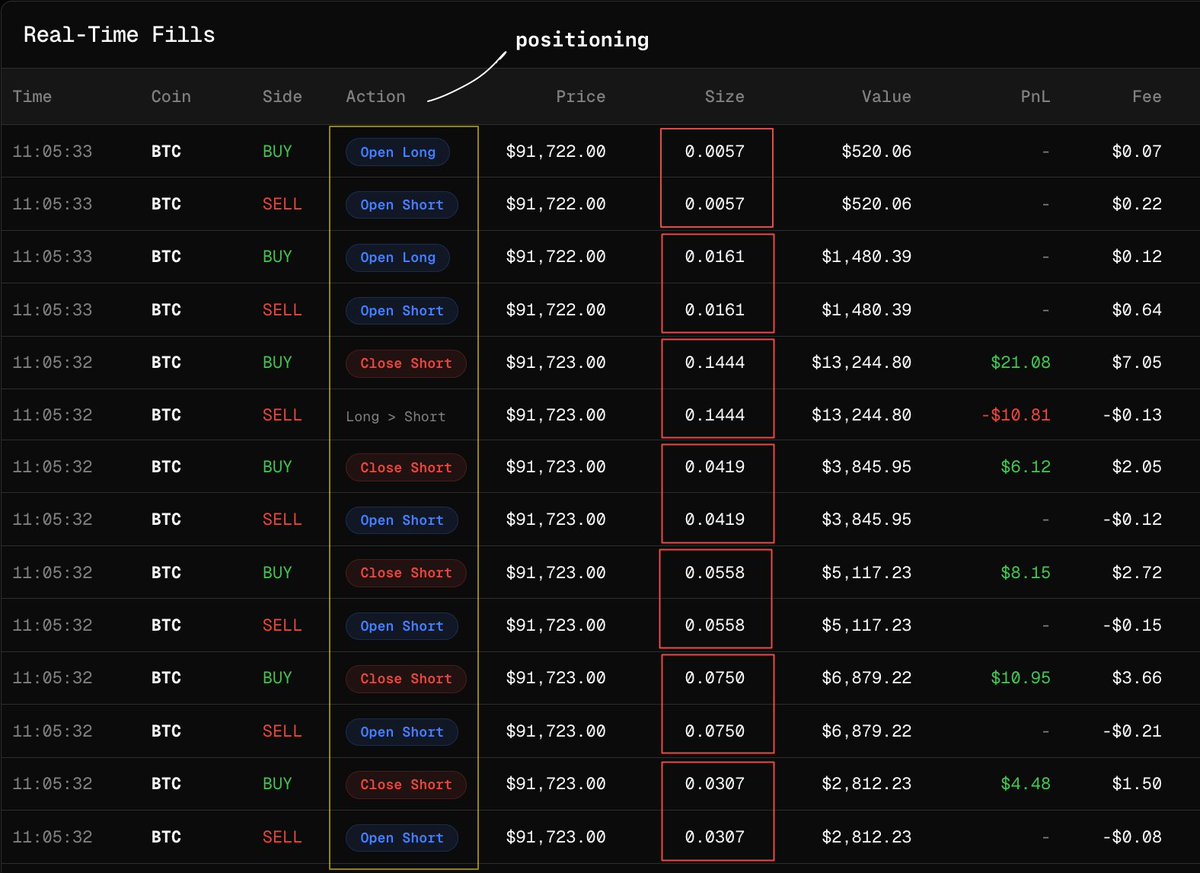
 market/limit orders:
 what is absorption?
 basics of structure:
 also known as:
 2. market dynamics
 footprint vs regular charts:
 Asia (00-06)
 what are npocs:
 what is monday range?
 what is vwap:
 open interest vs price:
 what is auction market theory:
 what is delta:
 what are orderblocks:
 what are trapped traders?
 candle formations:
 what is resting liquidity?