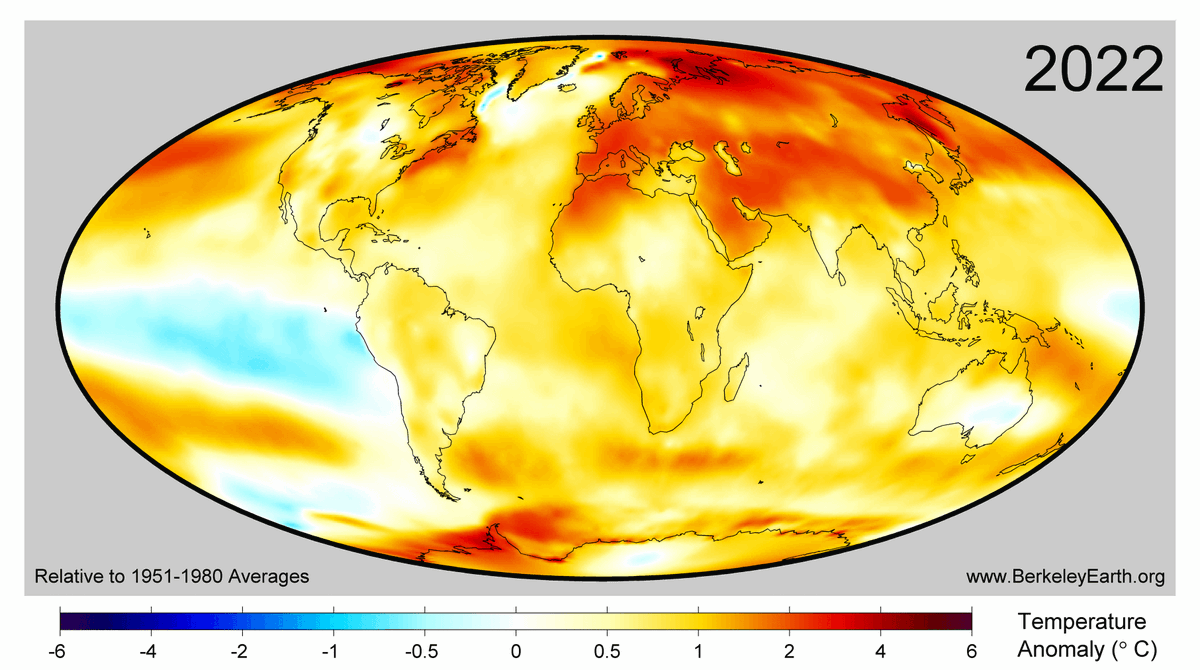
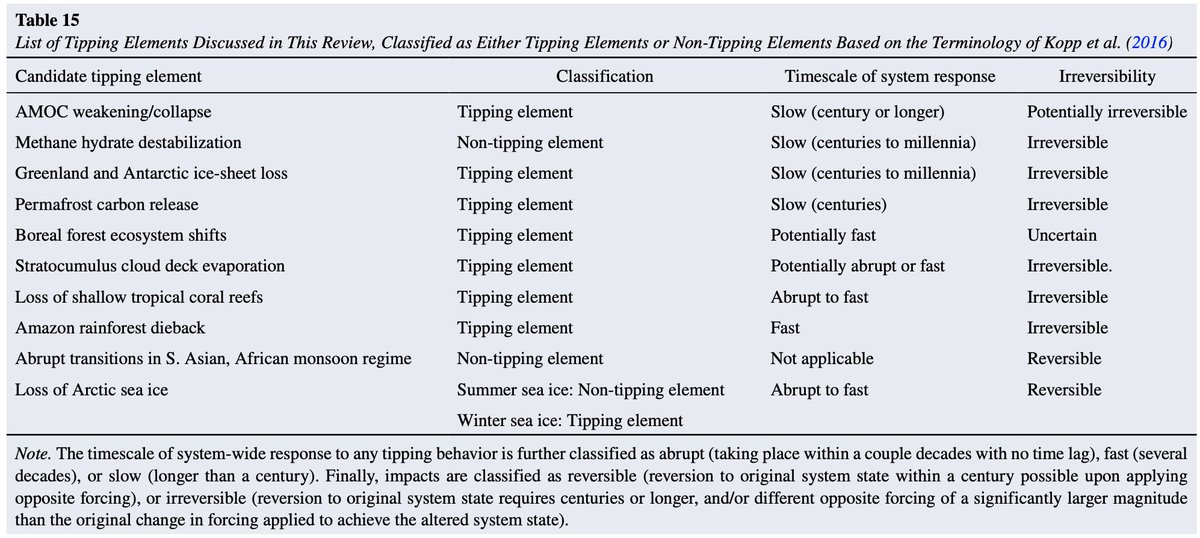
The review provides a deep dive into each proposed tipping element, as well as summarizing their level of scientific understanding, timescale of occurrence, and likely global climate effects:
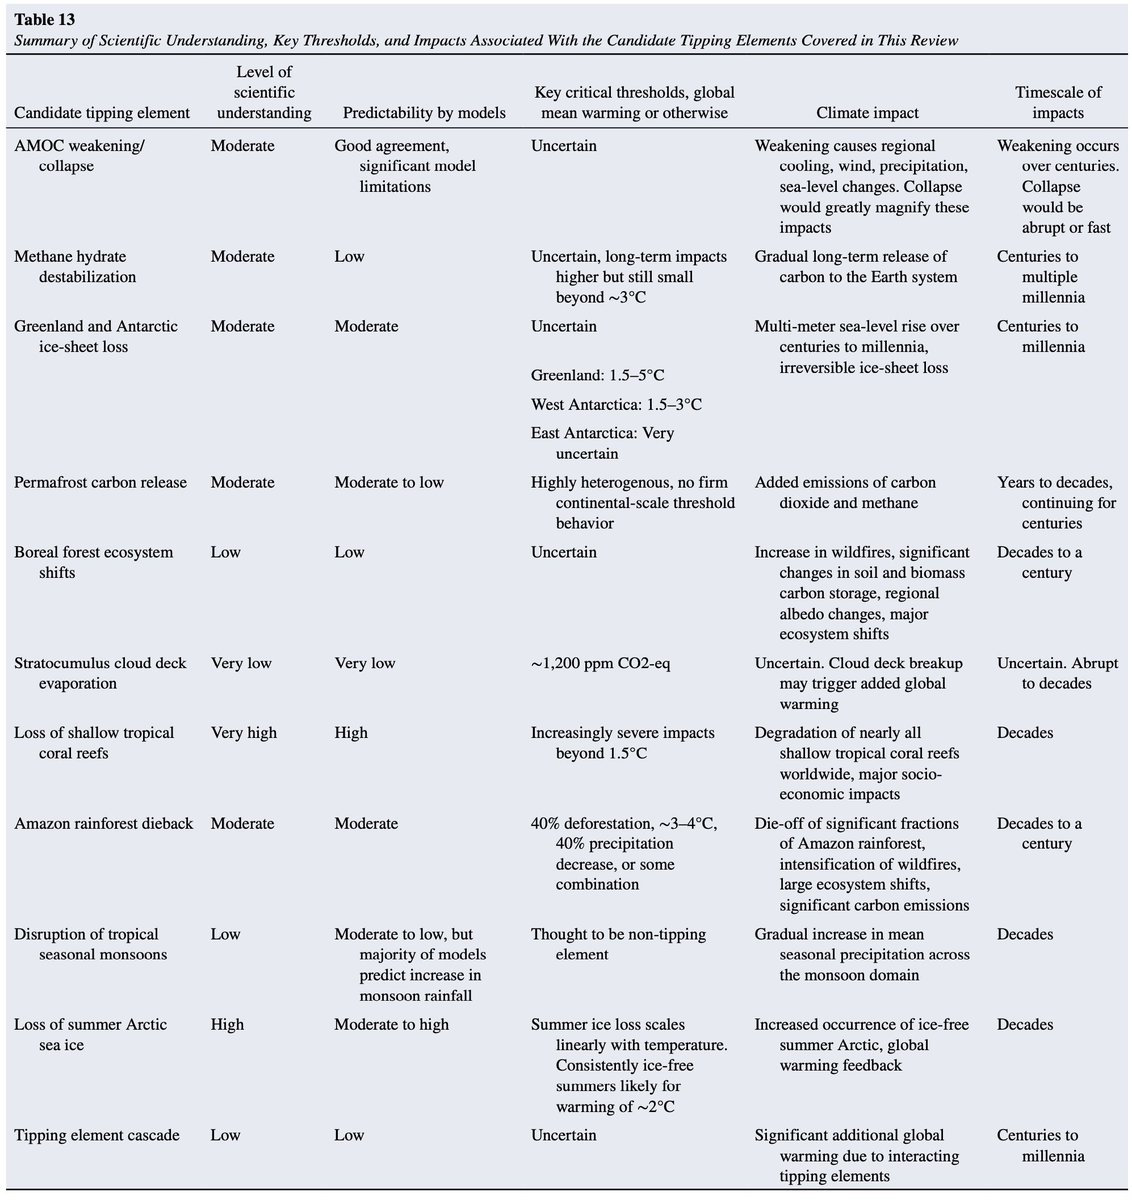
We find that these tipping elements may result in large impacts at a local or ecosystem level, and a number of them can exacerbate future warming beyond what is currently included in Earth system models.
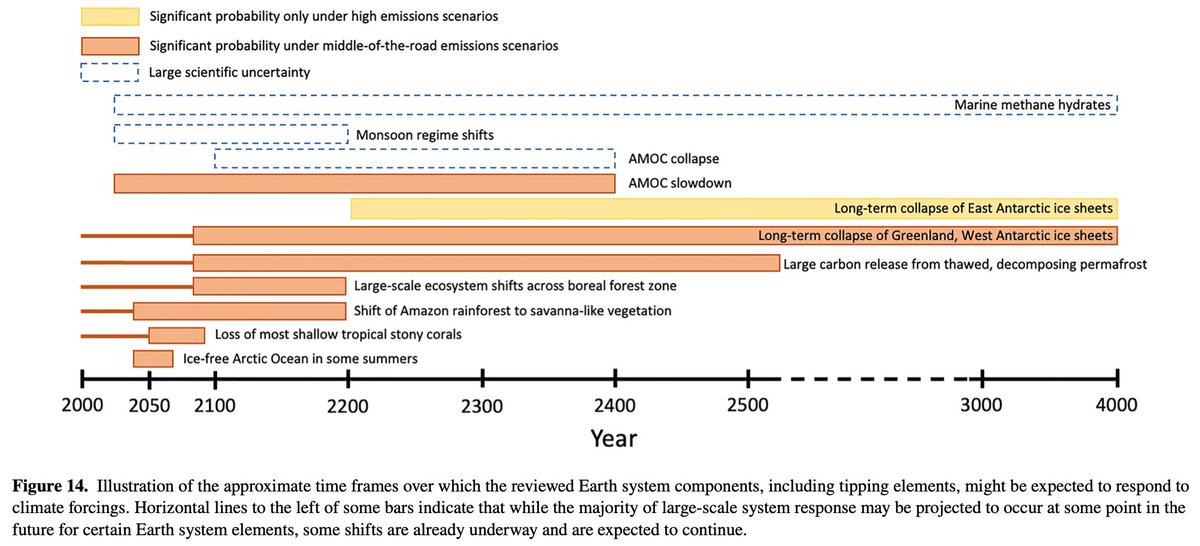
However, the combined effects of these tipping elements on global temperatures are likely much smaller than the effects of our emissions choices over the next three centuries. In other words, they make climate impacts worse but don't cause runaway warming:
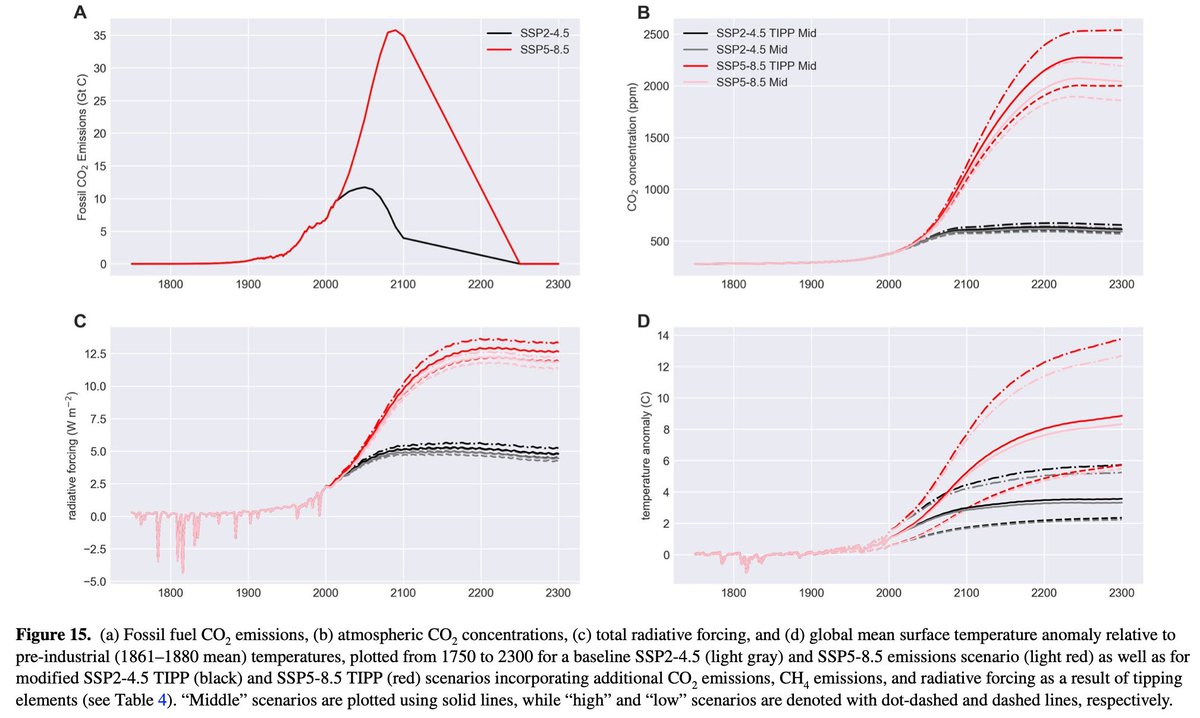
Overall, climate tipping elements are less a looming cliff after which climate change spirals out of control and cannot be stopped, and more like a slope that is hard to climb back up, where the severity of consequences is determined based on how much the future climate warms.
We are working with Reviews of Geophysics to make the article open access, but in the meantime you can view an earlier submitted version of the manuscript here: authorea.com/doi/full/10.10… (or DM me for a copy).
Last November we held a workshop in San Francisco to discuss monitoring, reporting, and verification (MRV) for permanent carbon dioxide removal technologies.
Today we published a letter signed by 35 organizations calling for a CDR Standards Initiative: carbonplan.org/blog/cdr-stand…
We envision this initiative establishing a transparent and predictable process for consolidating the best available science, reviewing existing and forthcoming protocols, and harmonizing MRV approaches across and within CDR pathways.
This process would provide reference points to ensure that claimed permanent removals are consistently and rigorously quantified and are aligned with relevant system boundaries. carbonplan.org/research/cdr-v…
Global surface temperatures have increased by ~1.3C (2.3F) since the mid-1800s, with around 1C warming just over the past 50 years (since 1970). This warming is caused by human emissions of CO2 and other GHGs.
Over land, where we all live, warming has been closer to 1.8C (3.2F).
Global temperature are now likely higher than any experienced in the past 2000 years, and may be higher than any experienced in the past 10,000 years (e.g. over the full holocene). interactive.carbonbrief.org/how-proxy-data…
Human emissions from fossil fuel and land use have increased in the amount of CO2 in the atmosphere by 50% over the past two centuries (from 280 ppm to 420 ppm).
The last time CO2 concentrations were higher was around 3 million years ago:
We see a lot of concern today that renewables and other clean electricity will require too much materials, and producing those will break our remaining carbon budget.
In the new paper in Joule we look at 75 different scenarios to meet our climate goals (limiting warming to either 1.5C or 2C), determine how much clean electricity generation (renewables, nuclear, CCS, etc.) is installed, when it is installed, and how much materials are required
We compare the demand for these materials to the current global production – both for structural materials like steel and cement, and for critical materials like neodymium, silver, and tellurium. We find that in many cases global production will need to grow to meet demand.
Our 2022 State of the Climate report is out over at @CarbonBrief!
⬆️ Record ocean heat content
⬆️ 5th or 6th warmest on surface
⬆️ 2nd warmest with El Nino/La Nina removed
⬆️ Warmest for 28 countries / 850 million people
⬆️ Record high GHGs, sea level
Over 90% of the heat trapped by CO2 and other GHGs accumulates in the Earth's oceans. Between 2021 and 2022 ocean heat content increased by 11 zettajoules – which is around 19 times as much as the total energy produced by all human activities on Earth.
5th or 6th warmest on surface.
La Nina conditions in the tropical Pacific pushed temperatures down a bit in 2022, but it was still the 5th or 6th warmest year since records began in the mid-1800s for the Earth's surface at 1.1C to 1.3C above preindustrial levels.
I object to this chart, because it turns out that the reconstruction of a single location based on an ice core drilled 40 years ago in Greenland that ends in 1885 is not a good representation of global temperatures. If we use hundreds of sites and proxy records worldwide we get:
Here are the climate proxies used in more recent holocene reconstructions (vs a single dot in Greenland that Peterson is showing): nature.com/articles/s4159…
More broadly, even if we just focus on Greenland and combine all the different ice core records available there we get a different picture than Peterson portrays, as I discuss in this @CarbonBrief analysis: carbonbrief.org/factcheck-what…
2022 was the 5th warmest year on record in our @BerkeleyEarth surface temperature dataset, and the warmest year on record for regions where 850 million people live.
28 countries saw their warmest year on record, including the UK, Spain, France, Germany, New Zealand, and China.
2022 was only the 5th warmest year on record largely due to continued La Nina conditions in the Pacific that suppress global temps on a year-to-year basis.
But the long-term human warming is clear. The biggest La Nina today is warmer than the biggest El Nino two decades ago.
Here is what global temperature anomalies (departure above the historical average) looked like in 2022; we saw extreme wamrth over Europe, parts of North Africa, the Middle East, China, Russia, and the Antarctic Peninsula among other places: