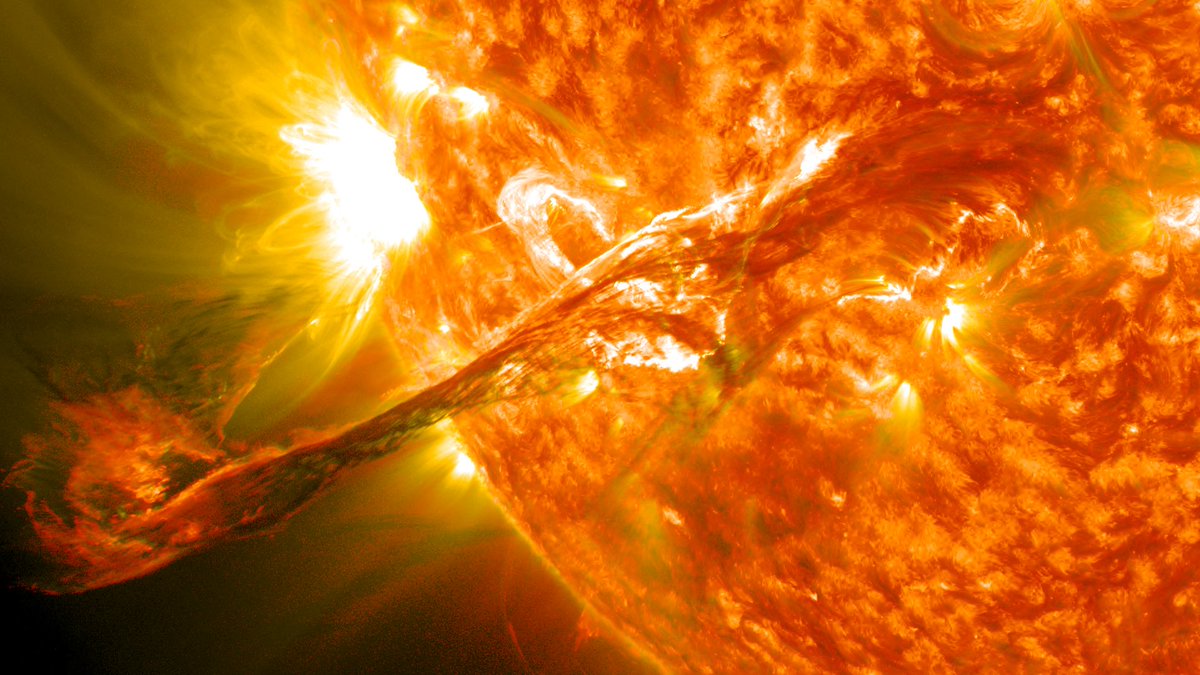
The ☀️sun☀️ is getting very active.
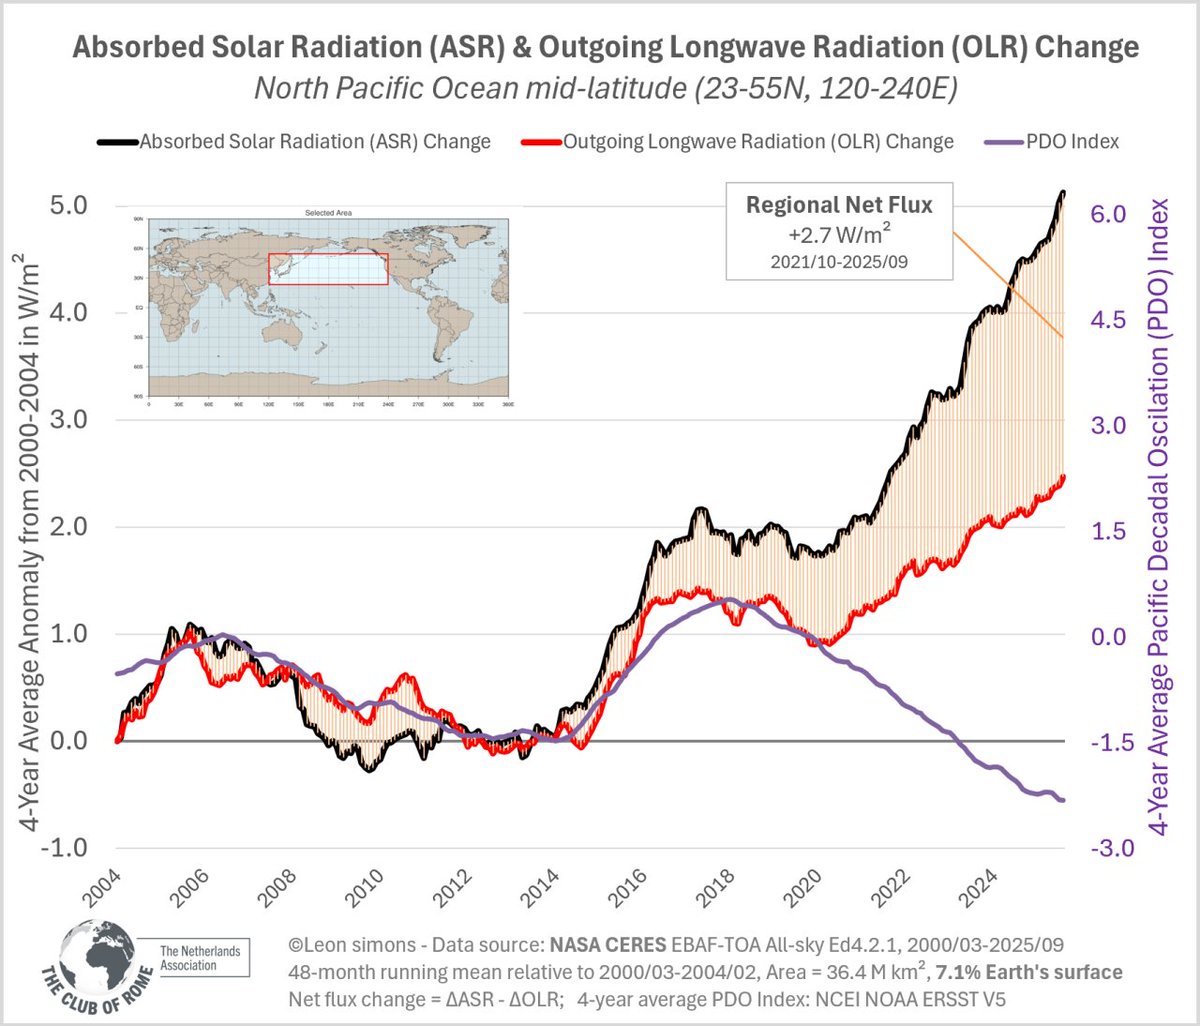
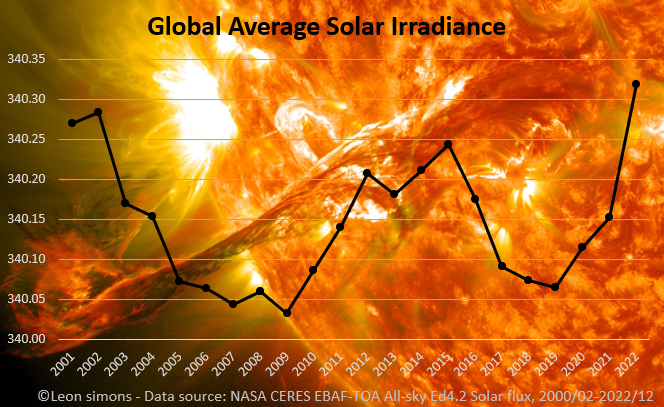
Last year Earth received on average more solar radiation than it has for the past 20 years.
Next years will most likely top this, as we are moving into the positive phase of the solar cycle.
Last year Earth received on average more solar radiation than it has for the past 20 years.
Next years will most likely top this, as we are moving into the positive phase of the solar cycle.
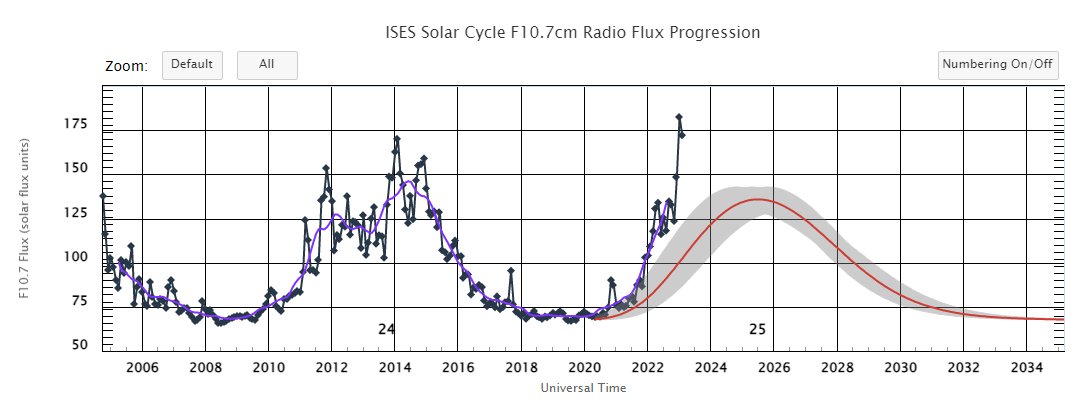
This Solar Cycle is much more active than predicted by @NWSSWPC , rapidly moving outside the Predicted Range, with 2.5 more years to the estimated solar maximum.
swpc.noaa.gov/products/solar…
swpc.noaa.gov/products/solar…
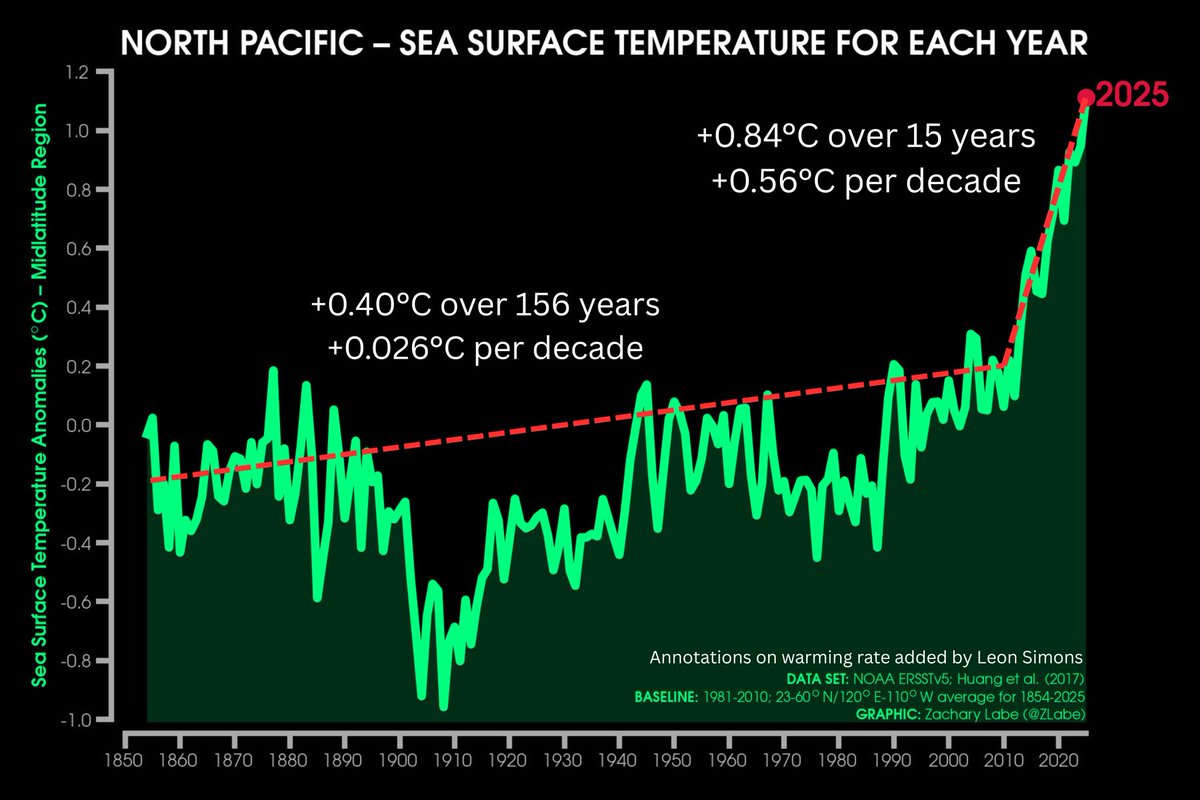
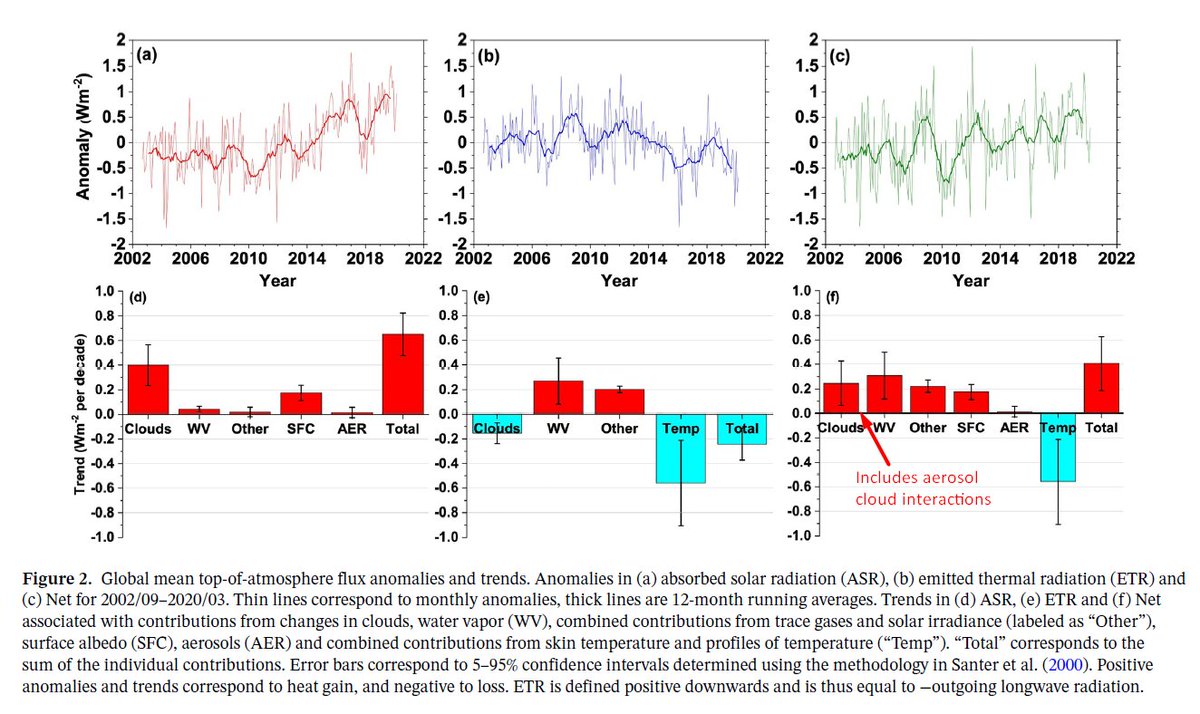
This could turn out to be a strong temporary climate forcing, adding ~0.2°C to warming from:
-Increasing greenhouse gasses
-Decreasing aerosols
-El Niño
-Reducing ice albedo
-Increased water vapor in both the troposphere (feedback) and stratosphere (Hunga Tonga volcano eruption).
-Increasing greenhouse gasses
-Decreasing aerosols
-El Niño
-Reducing ice albedo
-Increased water vapor in both the troposphere (feedback) and stratosphere (Hunga Tonga volcano eruption).
Next years will give some insight in the climate of the next decades.
Highest annual Global Average Solar Irradiance in 20 years.
This adds about 0.25 W/m² of incoming radiation compared to the years experiencing a solar minimum.
This adds about 0.25 W/m² of incoming radiation compared to the years experiencing a solar minimum.
• • •
Missing some Tweet in this thread? You can try to
force a refresh