Tom Engle has lived off of his portfolio for 40 years.
No inheritance. No lottery winnings. Just 9 years of saving from an averge salary.
How? He's a great investor with a BRILLIANT cash management strategy.
Here's how it works:
No inheritance. No lottery winnings. Just 9 years of saving from an averge salary.
How? He's a great investor with a BRILLIANT cash management strategy.
Here's how it works:
Let's say Tom's portfolio is worth $100,000 in the middle of a bull market.
Tom is happy with this number and wants to protect it.
He mentally calls this $100,000 his "protected value."
All his cash management decisions are based on this number.
Tom is happy with this number and wants to protect it.
He mentally calls this $100,000 his "protected value."
All his cash management decisions are based on this number.

Tom always keeps an eye on the macro and has an idea of how the market is:
▪️Under-valued
▪️Fairly-valued
▪️Over-valued
Tom keeps ~12% of his "protected value" in cash in a fairly-valued market.
That's $12,000
▪️Under-valued
▪️Fairly-valued
▪️Over-valued
Tom keeps ~12% of his "protected value" in cash in a fairly-valued market.
That's $12,000

Let's say the bull market continues.
Tom's portfolio continues to grow.
He trims some of his holdings as valuations expand and his net worth grows.
Tom's portfolio continues to grow.
He trims some of his holdings as valuations expand and his net worth grows.

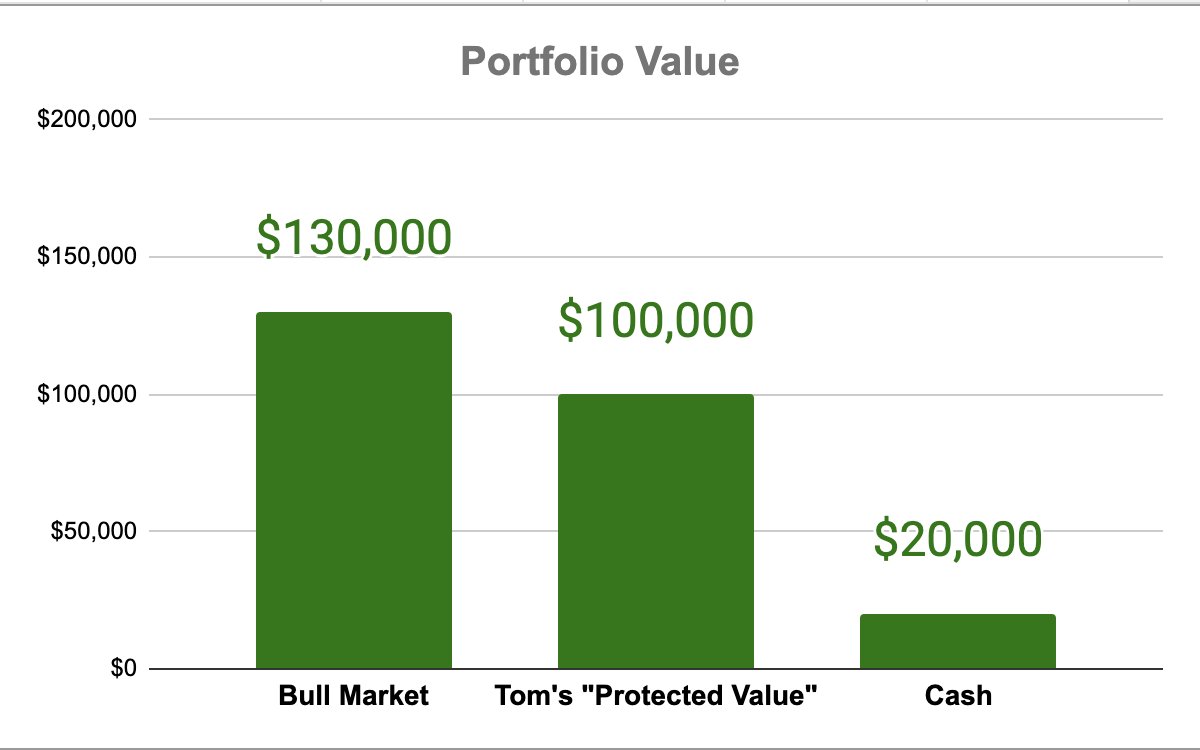
Let's say his portfolio grows to $130,000
Tom continues to trim, maxing out at 20% of the protected value in cash ($20,000)
At this point, Tom usually can't find any stocks trading at bargain prices.
Tom continues to trim, maxing out at 20% of the protected value in cash ($20,000)
At this point, Tom usually can't find any stocks trading at bargain prices.
The bull market eventually ends. Prices start to decline.
Tom slowly buys his favorite stocks at "better and better valuations" as prices fall and valuations begin to favor buyers.
Tom slowly buys his favorite stocks at "better and better valuations" as prices fall and valuations begin to favor buyers.

Tom continues to buy as prices fall and valuations improve.
Tom is OK with his portfolio value falling, even below his "protected value."
If that happens, he knows he's buying TONS of bargains.
Tom is OK with his portfolio value falling, even below his "protected value."
If that happens, he knows he's buying TONS of bargains.
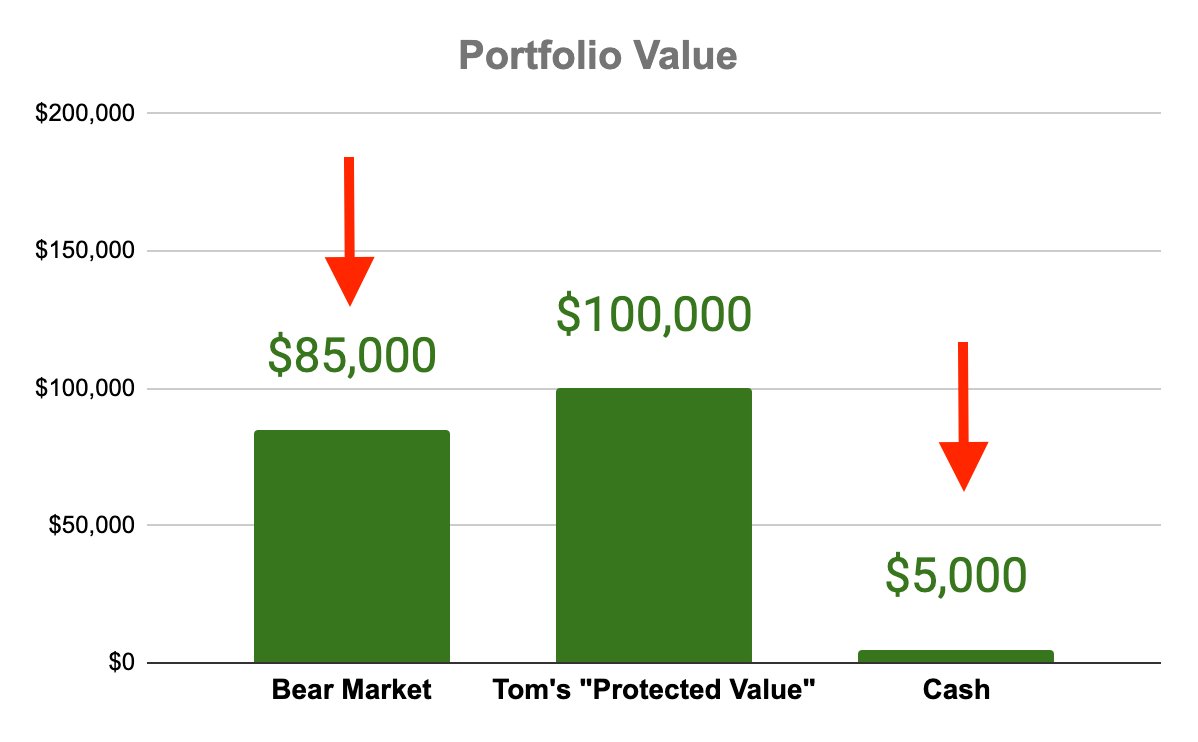
Let's say the bear market is really bad, like 2008.
Tom's portfolio falls to $70,000, well below his $100,000 protected value.
At that point, HUGE bargains are everywhere, and his cash position drops to just 1% of the protected value from all the buying.
Tom's portfolio falls to $70,000, well below his $100,000 protected value.
At that point, HUGE bargains are everywhere, and his cash position drops to just 1% of the protected value from all the buying.

Eventually, the bear market ends, and the next bull market starts.
Tom's returns skyrocket, especially from his bargain purchases when his portfolio was below $100,000
He slowly trims on the way up to rebuild his cash position.
Tom's returns skyrocket, especially from his bargain purchases when his portfolio was below $100,000
He slowly trims on the way up to rebuild his cash position.

Within 3 to 5 years, his portfolio doubles to $200,000, powered by his bargain buying during the last bear market
He's happy with this number, so it becomes his new "protected value."
His cash balance target is now $24,000 -- 12% of the $200,000
He's happy with this number, so it becomes his new "protected value."
His cash balance target is now $24,000 -- 12% of the $200,000

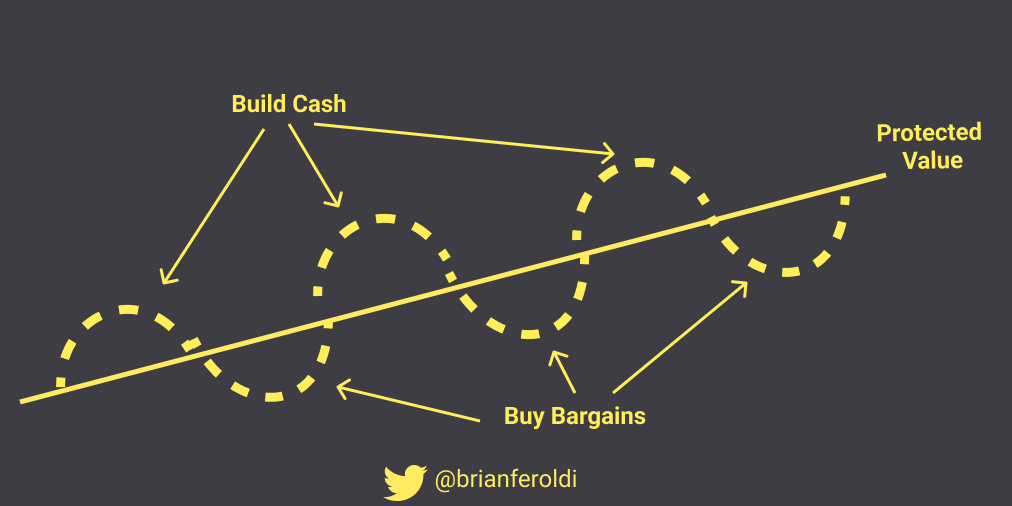
Tom rinses and repeats for each market cycle, which lasts 5-15 years.
He builds cash when valuations are high.
He buys bargains when valuations are low.
The protected value moves steadily higher over time.
He builds cash when valuations are high.
He buys bargains when valuations are low.
The protected value moves steadily higher over time.

Tom likes this strategy because it allows his cash position to "grow at the same rate as my portfolio."
The example above is an extreme bull/bear market.
Tom's cash balance was only 1% once (Feb 2009).
And it's rare for it to be above 20%
Tom usually keeps between 5% and 15% of the projected value in cash during "normal" market fluctuations.
Tom's cash balance was only 1% once (Feb 2009).
And it's rare for it to be above 20%
Tom usually keeps between 5% and 15% of the projected value in cash during "normal" market fluctuations.
I love the idea of a "protected value."
It gives Tom a firm target to focus his cash value around.
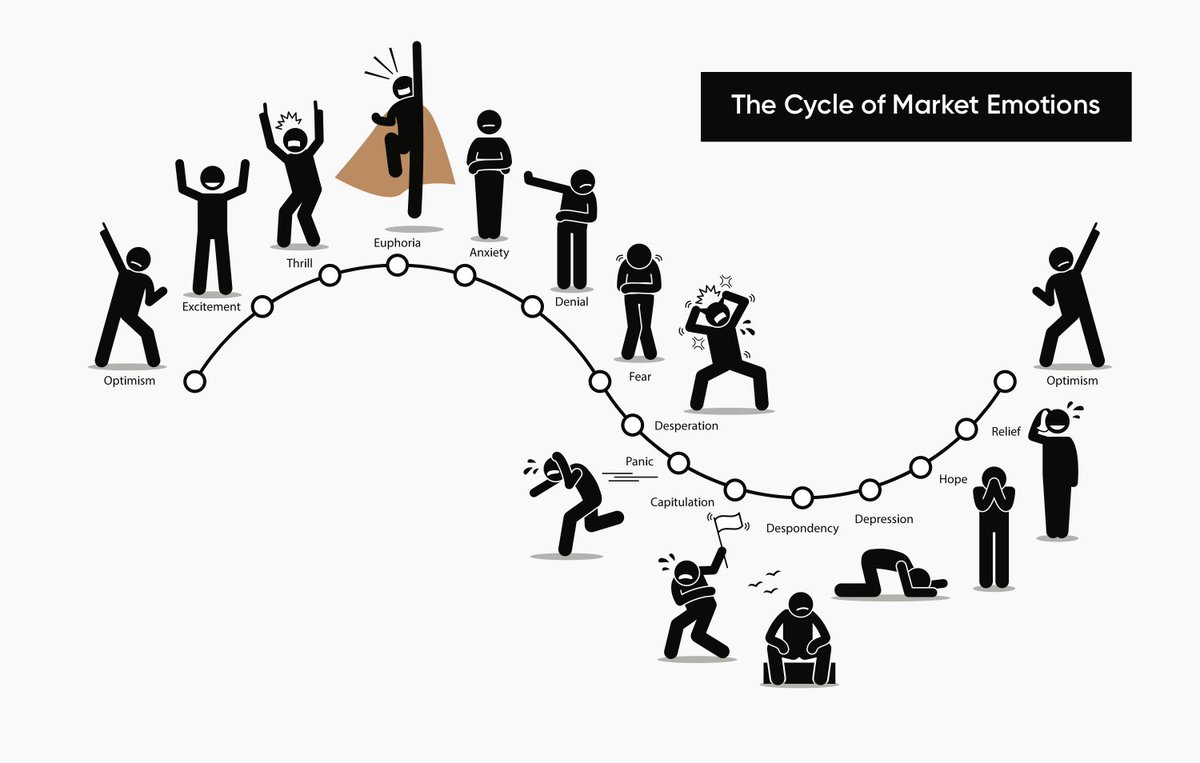
Focusing on the "protected value" makes it easier (but not easy) to handle the cycle of market emotions.
It gives Tom a firm target to focus his cash value around.
Focusing on the "protected value" makes it easier (but not easy) to handle the cycle of market emotions.
Tom success also comes from his modest lifestyle.
He lives in rural Kentucky, which keeps his cost of living very low.
This allows his cash to support his lifestyle, even during lean times.
He lives in rural Kentucky, which keeps his cost of living very low.
This allows his cash to support his lifestyle, even during lean times.
I've learned so much about investing by studying Tom.
Investing successfully for decades has helped him to remain calm & rationale during periods of market excess
Investing successfully for decades has helped him to remain calm & rationale during periods of market excess

Tom's investing success is rooted in his understanding of market valuation.
His favorite metric? Cash flow yield.
Want a deep dive into how this metric works? Join my cohort-based course - Valuation Explained Simply
(DM me for a coupon code)
maven.com/brian-feroldi/…
His favorite metric? Cash flow yield.
Want a deep dive into how this metric works? Join my cohort-based course - Valuation Explained Simply
(DM me for a coupon code)
maven.com/brian-feroldi/…
If you got value out of this thread:
1. Follow me @BrianFeroldi for more threads like this
2. RT the tweet below to share this thread with your friends
1. Follow me @BrianFeroldi for more threads like this
2. RT the tweet below to share this thread with your friends
https://twitter.com/BrianFeroldi/status/1632374044141015041?s=20
Want to learn more about the art of valuation?
Check out this thread about the flaws of using the P/E ratio:
Check out this thread about the flaws of using the P/E ratio:
https://twitter.com/BrianFeroldi/status/1619012942275686400?s=20
• • •
Missing some Tweet in this thread? You can try to
force a refresh