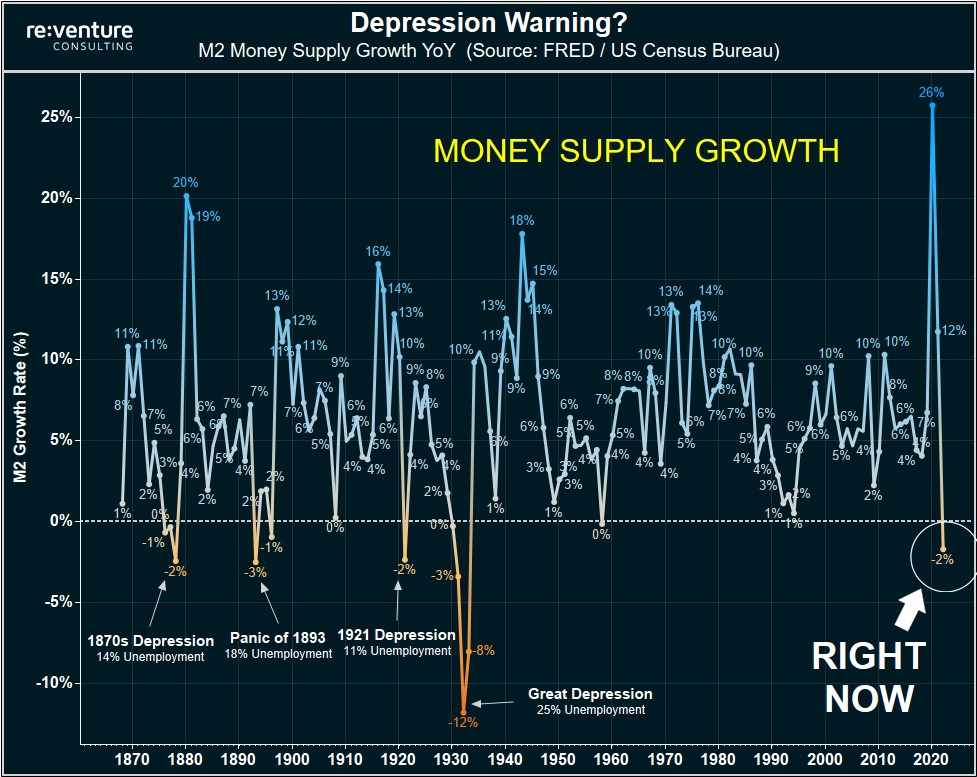
WARNING: the Money Supply is officially contracting. 📉
This has only happened 4 previous times in last 150 years.
Each time a Depression with double-digit unemployment rates followed. 😬
This has only happened 4 previous times in last 150 years.
Each time a Depression with double-digit unemployment rates followed. 😬
1) Contracting money supply + inflation is a nasty combination.
Because it means there are fewer dollars floating around in the system to pay for the higher prices. ❌💵
At some point the system "breaks" & a deflationary crash occurs.
Because it means there are fewer dollars floating around in the system to pay for the higher prices. ❌💵
At some point the system "breaks" & a deflationary crash occurs.
2) This is exactly what happened in the Depression of 1921. (NOT the Great Depression).
This occurred after WWI and the Spanish Flu. Where there were years of high inflation/money supply growth.
And then...WHAM. 11% Deflation and the unemployment rate skyrocketed.
This occurred after WWI and the Spanish Flu. Where there were years of high inflation/money supply growth.
And then...WHAM. 11% Deflation and the unemployment rate skyrocketed.
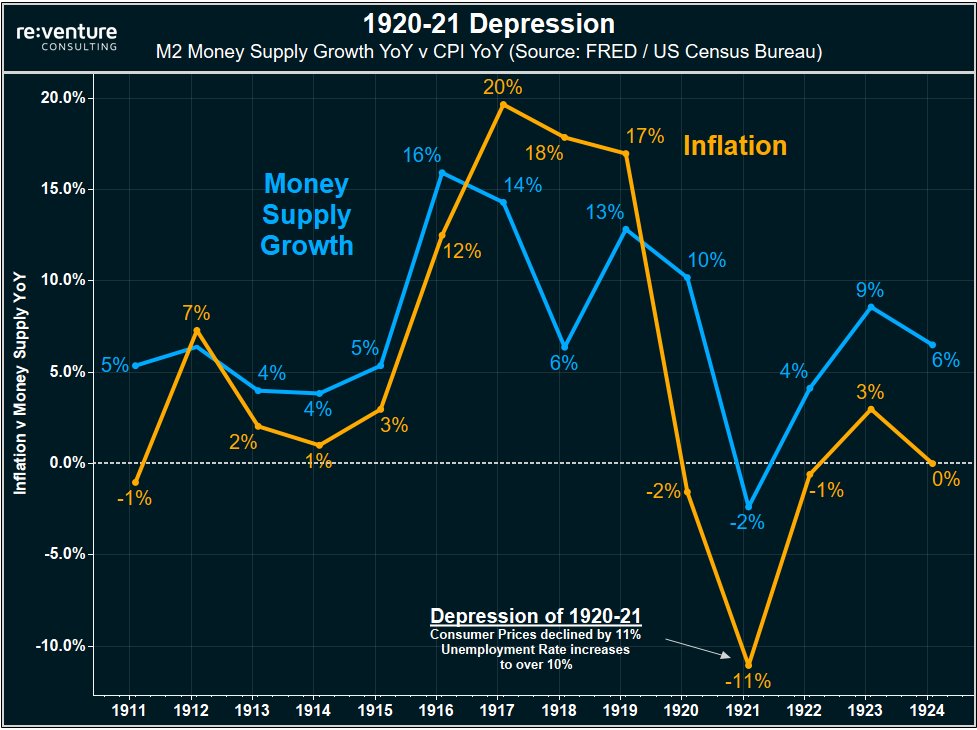
3) All it took was a -2% contraction in the money supply in 1921 to cause that deflationary depression.
And we're already at -2% contraction today in 2023.
Suggesting that the resilience of our economy and the current inflation might not be as strong as people think.
And we're already at -2% contraction today in 2023.
Suggesting that the resilience of our economy and the current inflation might not be as strong as people think.
4) Of course - there is still lots of money floating around in the financial system in 2023.
Money Supply, or M2, is about 35% higher today than it was pre-pandemic.
($15 Trillion --> $21 Trillion).
Money Supply, or M2, is about 35% higher today than it was pre-pandemic.
($15 Trillion --> $21 Trillion).

5) But historical record is clear: Depressions/Deflation don't need a "linear" decrease in money supply to occur.
It just needs to be a little bit. 2-4% contraction YoY. And then problems occurs.
It just needs to be a little bit. 2-4% contraction YoY. And then problems occurs.
6) Lots of people seem to think this Inflation will last forever. Like the one in the 1970s.
But remember: 1970s Inflation was bad because Money Supply kept growing.
It never contracted. Which is why we had a decade of inflation.
Now is very different.
But remember: 1970s Inflation was bad because Money Supply kept growing.
It never contracted. Which is why we had a decade of inflation.
Now is very different.

7) Now the Fed is doing "Quantitative Tightening".
This QT is what's causing the money supply to contract in 2023.
Everyone's focused on rate hikes. But it's the QT/Money Supply they should be paying attention to.
This QT is what's causing the money supply to contract in 2023.
Everyone's focused on rate hikes. But it's the QT/Money Supply they should be paying attention to.
8) Because if QT continues at its current pace, the money supply will contract by more.
+Just as all these big Recession warnings are piling up.
+Just as inflation continues to be a problem.
That's how you get a system meltdown. And a Deflationary Depression.
+Just as all these big Recession warnings are piling up.
+Just as inflation continues to be a problem.
That's how you get a system meltdown. And a Deflationary Depression.
9) But of course - a Deflationary Depression in 2023-24 is not a guarantee.
The government will of course see what's happening.
And might attempt to print money again, send stimulus checks, and re-ignite inflation/economy.
The government will of course see what's happening.
And might attempt to print money again, send stimulus checks, and re-ignite inflation/economy.
10) History also shows that WARS are periods where the money supply grows a lot.
Like during WWI and WW2.
If the US were to get into a war (hopefully not), the money supply would grow again.
And inflation would last longer.
Like during WWI and WW2.
If the US were to get into a war (hopefully not), the money supply would grow again.
And inflation would last longer.

11) To summarize this tweet thread:
-The money supply is contracting in early 2023.
-Each time this happened before Deflation/Depression was the result.
-Stubbornly high inflation has made many blind to this risk factor.
-High chance Fed overtightens and causes Recession
-The money supply is contracting in early 2023.
-Each time this happened before Deflation/Depression was the result.
-Stubbornly high inflation has made many blind to this risk factor.
-High chance Fed overtightens and causes Recession
12) Summary continued...
-If history repeats itself, we could be in a "Deflationary Recession/Depression"
-Prices of a lot of things would go down. Houses. Rent. Commodities. Maybe even wages.
-Unemployment Rate would likely skyrocket. Maybe to as high as 10%.
-If history repeats itself, we could be in a "Deflationary Recession/Depression"
-Prices of a lot of things would go down. Houses. Rent. Commodities. Maybe even wages.
-Unemployment Rate would likely skyrocket. Maybe to as high as 10%.
13) But gov't could also step in and "save the day"...
-More money printing. Like what happened during pandemic.
-Which would increase money supply growth and sustain inflation.
-A war would also be a situation where money supply growth and inflation would increase
-More money printing. Like what happened during pandemic.
-Which would increase money supply growth and sustain inflation.
-A war would also be a situation where money supply growth and inflation would increase
• • •
Missing some Tweet in this thread? You can try to
force a refresh