Hey, if you're currently teaching micro (time for some game theory), macro (bank runs!) or even finance (maturity transformation!) you may want to add a bit about the Silicon Valley bank run.
Lemme try to give you a quick couple of slides you can insert into class. #TeachEcon
Lemme try to give you a quick couple of slides you can insert into class. #TeachEcon
Here's the Diamond-Dybvig model, written down as a simple 2x2. Have the students solve for the *multiple* equilibria! (Pure strategies is enough for today's class.)
[I use the "check mark method" to find the Nash equilibrium]
[I use the "check mark method" to find the Nash equilibrium]

Next, explain what deposit insurance is.
Now have the students pair off. Together they should:
1. Revise the payoff matrix now that deposit insurance means folks no longer lose $ in a bank run.
2. Solve for the new equilibrium.
Viola! They just solved the problem of bank runs.
Now have the students pair off. Together they should:
1. Revise the payoff matrix now that deposit insurance means folks no longer lose $ in a bank run.
2. Solve for the new equilibrium.
Viola! They just solved the problem of bank runs.
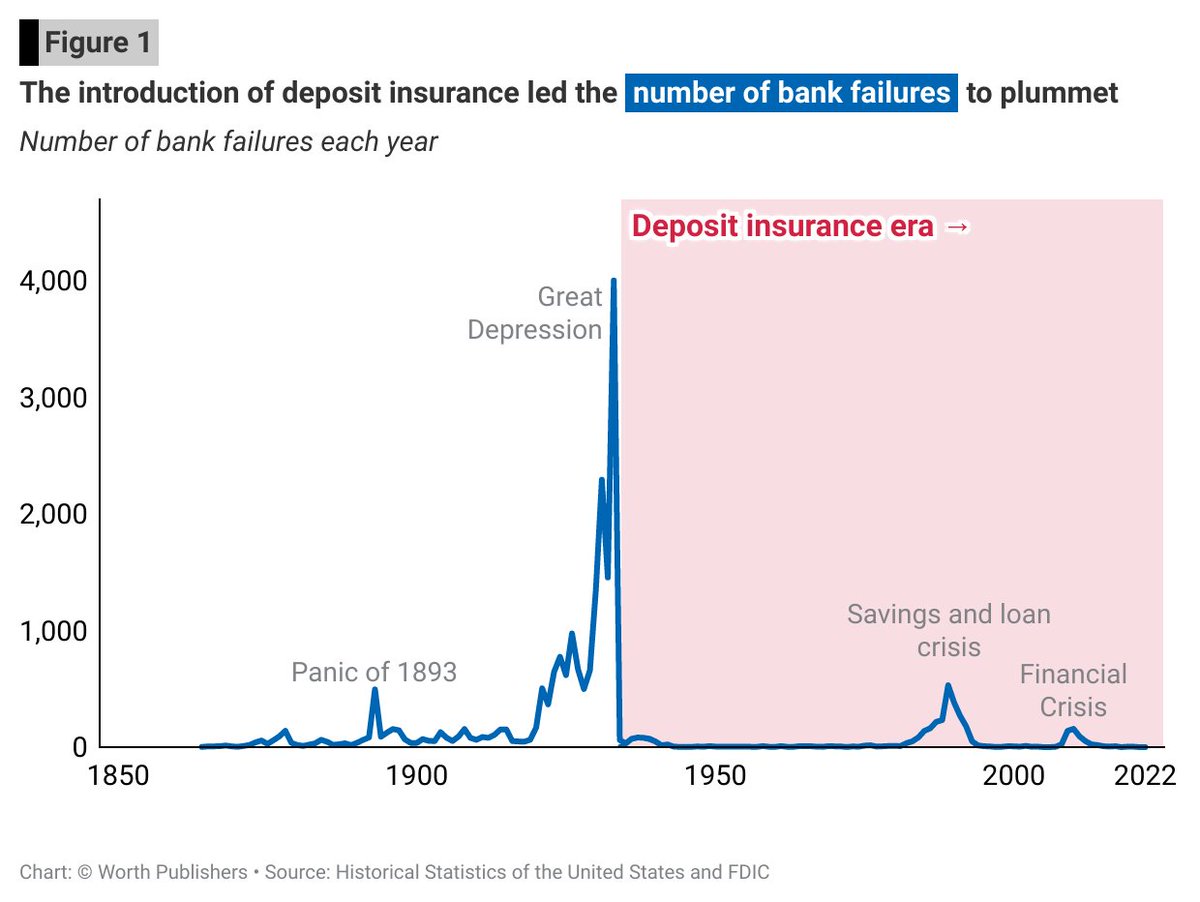
Your students just solved bank runs -- in theory... Does it work in practice?
Pretty much perfectly: Bank runs have almost been eradicated since the adoption of deposit insurance.
(Aside: The 2008 financial crisis was a run on shadow banks which don't have deposit insurance.)
Pretty much perfectly: Bank runs have almost been eradicated since the adoption of deposit insurance.
(Aside: The 2008 financial crisis was a run on shadow banks which don't have deposit insurance.)
Okay, so what's up with Silicon Valley bank?
FDIC insures only the first $250k of your savings. (Aside: When you get rich, open multiple accounts.)
Silicon Valley Bank was different: Its customers were businesses with $$$, so 97% of its deposits were uninsured!
A huge outlier.
FDIC insures only the first $250k of your savings. (Aside: When you get rich, open multiple accounts.)
Silicon Valley Bank was different: Its customers were businesses with $$$, so 97% of its deposits were uninsured!
A huge outlier.

This insight helps explain why markets are worried about some banks (but not most banks).
Basically they're looking for other SVB-like banks where customers are uninsured. In fact, as @AliHortacsu shows, these are the banks markets are worried about.
Basically they're looking for other SVB-like banks where customers are uninsured. In fact, as @AliHortacsu shows, these are the banks markets are worried about.
https://twitter.com/AliHortacsu/status/1635317135655456769
@AliHortacsu All of this explains the government's response.
It's effectively promising to insure everyone's deposits. And then (if our analysis is correct!) this implies that Treasury's actions will put an end to this round of bank runs.
[Govt response is here:
home.treasury.gov/news/press-rel…]
It's effectively promising to insure everyone's deposits. And then (if our analysis is correct!) this implies that Treasury's actions will put an end to this round of bank runs.
[Govt response is here:
home.treasury.gov/news/press-rel…]
@AliHortacsu Some of your students might still ask why some (but only some!) bank stocks are sinking today. I think this is a partial explanation:
https://twitter.com/JustinWolfers/status/1635342392130936839
What hustle is over?
This one: Basically SVB took in deposits, and rather than lend them to businesses, it bet on bonds.
But it's a one-sided bet: Heads, it gets the profits. Tails, it lost its customers money, and the govt levies taxes to pay the bill.
This one: Basically SVB took in deposits, and rather than lend them to businesses, it bet on bonds.
But it's a one-sided bet: Heads, it gets the profits. Tails, it lost its customers money, and the govt levies taxes to pay the bill.
https://twitter.com/JustinWolfers/status/1635054903973515264
What about a critique of the government's policy approach? It's this: If we regulated SVB's betting activity, it couldn't take on this much risk.
Alternatively: If we had insured all the funds a week ago, there never would have been a bank run.
Alternatively: If we had insured all the funds a week ago, there never would have been a bank run.
https://twitter.com/JustinWolfers/status/1635058451880751105
There's *a lot* more to be said about SVB. But this is a barebones structure for what I think will yield a useful class discussion, drawing on a lot of the concepts we teach in introductory econ.
[Paid ad: These notes / graphs come from the Stevenson-Wolfers intro econ textbook]
[Paid ad: These notes / graphs come from the Stevenson-Wolfers intro econ textbook]
• • •
Missing some Tweet in this thread? You can try to
force a refresh