

2/
Candlestick charts is one of the oldest trading techniques. They're referred as "Japanese candles" because the Japenese would use them to analyse the price of rice contracts.
A rice trader named Homma from Sakata deserves much of the credit for candlestick development.
Candlestick charts is one of the oldest trading techniques. They're referred as "Japanese candles" because the Japenese would use them to analyse the price of rice contracts.
A rice trader named Homma from Sakata deserves much of the credit for candlestick development.
3/
Over many years of trading, it's likely that his original concepts were altered and improved, eventually leading to the candlestick charting system that we use today.
But many of the guiding principles remained the same throughout the years 👇
Over many years of trading, it's likely that his original concepts were altered and improved, eventually leading to the candlestick charting system that we use today.
But many of the guiding principles remained the same throughout the years 👇
4/
🔸 Price action is the supreme parameter and is above all. In traders parlance - "Bhao bhagwaan che"
🔸 Price is a reflection of the behaviours of the bears & bulls in the market
🔸 The actual price may/may not reflect the intrinsic value of the underlying asset
🔸 Price action is the supreme parameter and is above all. In traders parlance - "Bhao bhagwaan che"
🔸 Price is a reflection of the behaviours of the bears & bulls in the market
🔸 The actual price may/may not reflect the intrinsic value of the underlying asset
5/
To understand the need and power of candlestick charts, let’s analyse the price action movement of TCS over the last month.
The table below contains the daily reported price movement of TCS from 1st Feb 2023 to 24th Feb 2023.
To understand the need and power of candlestick charts, let’s analyse the price action movement of TCS over the last month.
The table below contains the daily reported price movement of TCS from 1st Feb 2023 to 24th Feb 2023.

6/
One can come to a conclusion by just looking at the table. What is your analysis? Could you understand the price movement, or could you observe any pattern?
If one is not a maths genius, it would have been very difficult for him to draw conclusion from these numbers.
One can come to a conclusion by just looking at the table. What is your analysis? Could you understand the price movement, or could you observe any pattern?
If one is not a maths genius, it would have been very difficult for him to draw conclusion from these numbers.
7/
Let’s give it another go, but this time we’ll use the figure below:
The table & the chart both represent the same info: Daily Price movement of TCS in Feb’23, but notice how easy it is to process info when it is in the form of a chart rather than numbers in a table
Let’s give it another go, but this time we’ll use the figure below:
The table & the chart both represent the same info: Daily Price movement of TCS in Feb’23, but notice how easy it is to process info when it is in the form of a chart rather than numbers in a table

8/
Simply put, candlesticks are a way of communicating information about how price is moving. As the name suggests, the candlesticks charts resemble a simple candlestick with a body and wick.
Simply put, candlesticks are a way of communicating information about how price is moving. As the name suggests, the candlesticks charts resemble a simple candlestick with a body and wick.

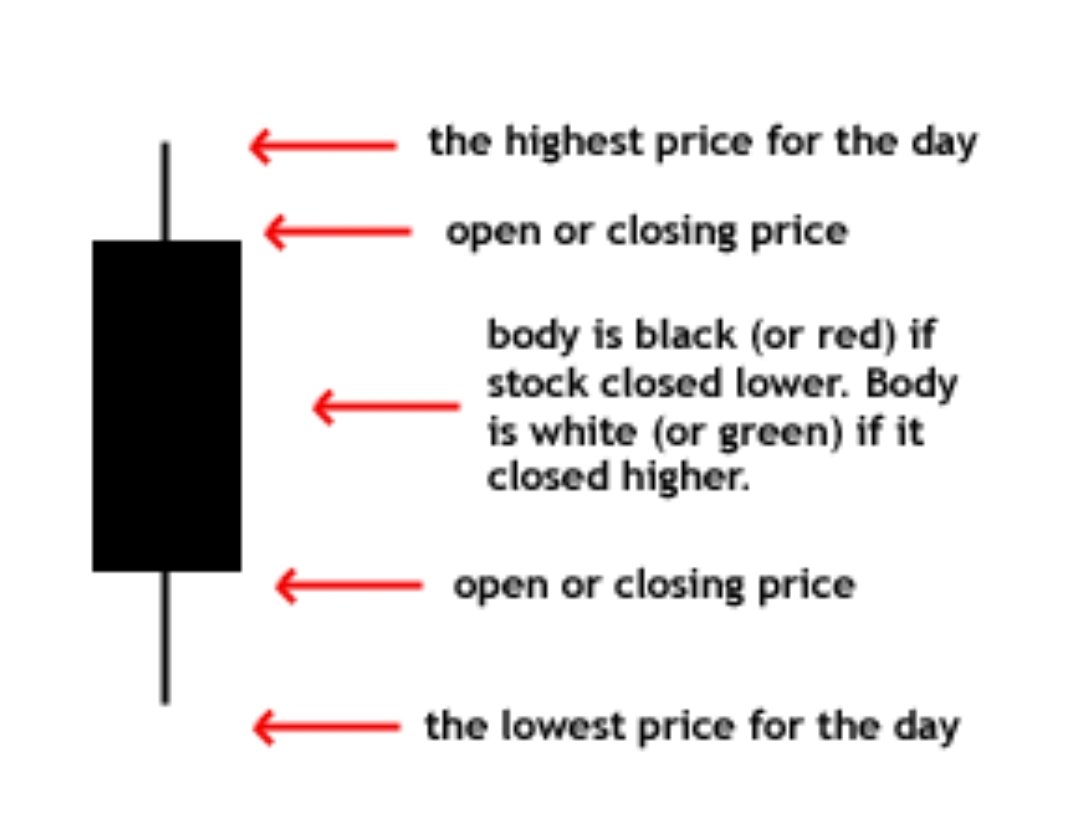
9/ Understanding a candletstick
A candlestick displays the:
🔸Open price
🔸Close price
🔸High price
🔸Low price
of the underlying security for a time period. In a candlestick chart, each candlestick represents a specific time period, such as a day, a week, or an hour.
A candlestick displays the:
🔸Open price
🔸Close price
🔸High price
🔸Low price
of the underlying security for a time period. In a candlestick chart, each candlestick represents a specific time period, such as a day, a week, or an hour.
10/
The colour of the candlestick indicates whether the price of the asset rose or fell during that time period.
🟩 A green or white candlestick indicates that the price rose, while
🟥 A red or black candlestick indicates that the price fell.
for that time frame.
The colour of the candlestick indicates whether the price of the asset rose or fell during that time period.
🟩 A green or white candlestick indicates that the price rose, while
🟥 A red or black candlestick indicates that the price fell.
for that time frame.
11/
Simply, a candlestick has 5 factors; High, low, close, open and the body. Let's understand these terms using the same example of TCS.
Simply, a candlestick has 5 factors; High, low, close, open and the body. Let's understand these terms using the same example of TCS.

12/
To sum it up, TCS made:
O:3363
H: 3419
C: 3408
L:3355
The body of the candle represents both the opening and the closing price. If the stock closed at a higher price than it opened, body is green & if the closing price falls below the opening price, the body is red
To sum it up, TCS made:
O:3363
H: 3419
C: 3408
L:3355
The body of the candle represents both the opening and the closing price. If the stock closed at a higher price than it opened, body is green & if the closing price falls below the opening price, the body is red
13/
The colour and the length of the body and the wick convey a snapshot of who’s winning the battle between the bulls and bears
The thin vertical bars/lines above and below the body of the candle represent the price extremes of the trading session and are called wicks
The colour and the length of the body and the wick convey a snapshot of who’s winning the battle between the bulls and bears
The thin vertical bars/lines above and below the body of the candle represent the price extremes of the trading session and are called wicks

14/
The thin vertical bars/lines above and below the body of the candle represent the price extremes of the trading session and are called shadows/wicks.
The thin vertical bars/lines above and below the body of the candle represent the price extremes of the trading session and are called shadows/wicks.
15/
The line above the body is called “upper shadow” & the line below the candle is called “lower wick”. The tip of the upper wick in a bullish candle is the high price, and the tip of the lower wick in a bullish candle is the low price of the trading session of the stock
The line above the body is called “upper shadow” & the line below the candle is called “lower wick”. The tip of the upper wick in a bullish candle is the high price, and the tip of the lower wick in a bullish candle is the low price of the trading session of the stock
This is part 1 of our series on candlesticks.
In part 2, we will cover analysis of key candlesticks patterns such as:
🔸Single candlesticks - Hammer, Doji, Shooting star, etc
🔸Multiple candlesticks - Evening star, morning star, etc
Follow us @ICICI_Direct to stay updated
In part 2, we will cover analysis of key candlesticks patterns such as:
🔸Single candlesticks - Hammer, Doji, Shooting star, etc
🔸Multiple candlesticks - Evening star, morning star, etc
Follow us @ICICI_Direct to stay updated
For a more detailed analysis,
Read here: icicidirect.com/ilearn/technic…
Read here: icicidirect.com/ilearn/technic…
• • •
Missing some Tweet in this thread? You can try to
force a refresh


