Want to learn investing from scratch? 🤔
Here is the 2nd part of our series on Fundamental Analysis📈
Let’s learn about Revenue, Cost, Taxes, EPS and many more
Let's understand a Profit & Loss Account
A thread 🧵👇 #LearnwithICICIDirect
Here is the 2nd part of our series on Fundamental Analysis📈
Let’s learn about Revenue, Cost, Taxes, EPS and many more
Let's understand a Profit & Loss Account
A thread 🧵👇 #LearnwithICICIDirect

[A] What is Profit & Loss Account (P&L)?
🔶It is a statement of Company's Revenue, Cost & Profitability
🔶Simply, it's a snapshot of what Company earns and how it spends money
🔶It is prepared for the specific period
🔶Also known as Income Statement
Check out the image👇
🔶It is a statement of Company's Revenue, Cost & Profitability
🔶Simply, it's a snapshot of what Company earns and how it spends money
🔶It is prepared for the specific period
🔶Also known as Income Statement
Check out the image👇

[B] What are the Components of BS?
🔶Income: How much the company earns
🔶Expenses: How much the company spends
🔶Profit/Loss: Net earning of the Company
Mathematically,
Income - Expenses = Profit/Loss
Let's understand in detail
Contd.
Check out below image 👇
🔶Income: How much the company earns
🔶Expenses: How much the company spends
🔶Profit/Loss: Net earning of the Company
Mathematically,
Income - Expenses = Profit/Loss
Let's understand in detail
Contd.
Check out below image 👇

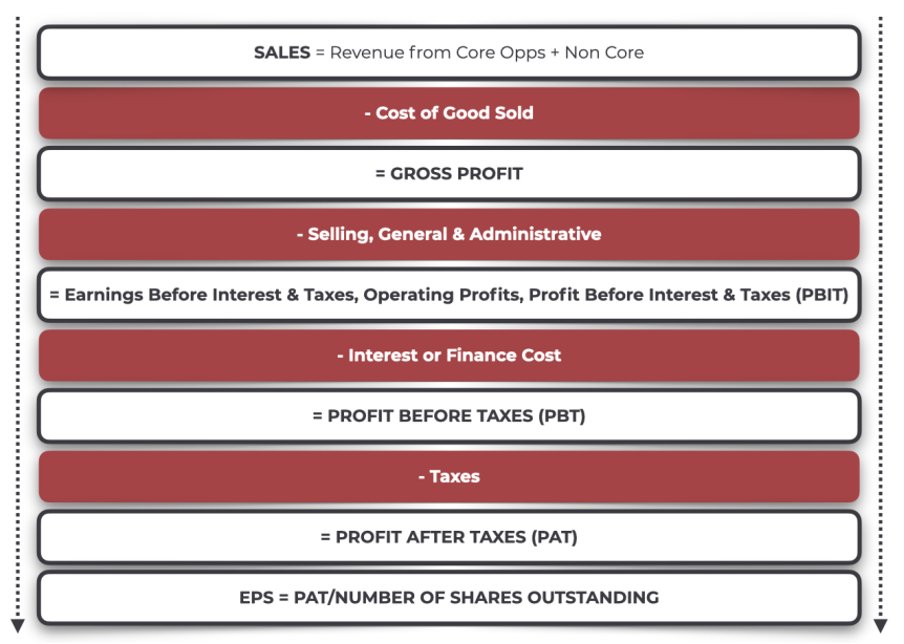
Shown in the image is the simplified form of P&L A/c
It flows from Top to Bottom.
That's why Net profit is known as the Bottom line of the Company.
P&L also discloses EPS i.e. Earnings per share (Calculated as Net Profit/Total No. of Shares)
It flows from Top to Bottom.
That's why Net profit is known as the Bottom line of the Company.
P&L also discloses EPS i.e. Earnings per share (Calculated as Net Profit/Total No. of Shares)
[B.1] - Income
Income includes:
🔶Revenue from Operations i.e., Sales from Core business [Can be bifurcated into Sale of Products and Sale of Services]
🔶Other Income i.e., Income from non-operating activities such as dividend, Interest, Forex Gain/loss, etc.
Check image 👇
Income includes:
🔶Revenue from Operations i.e., Sales from Core business [Can be bifurcated into Sale of Products and Sale of Services]
🔶Other Income i.e., Income from non-operating activities such as dividend, Interest, Forex Gain/loss, etc.
Check image 👇

[B.2] - Expenses
Expenses are the costs that a business incurs to run the business
It includes:
🔶Cost of Material Used
🔶Salary to employees
🔶Interest
🔶Depreciation
🔶Taxes
🔶Advertisement Expense
🔶Commission
🔶Repairing Cost
🔶Other expenses
Check image below👇
Expenses are the costs that a business incurs to run the business
It includes:
🔶Cost of Material Used
🔶Salary to employees
🔶Interest
🔶Depreciation
🔶Taxes
🔶Advertisement Expense
🔶Commission
🔶Repairing Cost
🔶Other expenses
Check image below👇

[C] How it is prepared?
🔶Based on accrual accounting
🔶Prepared for a specific period
🔶With comparative figures
🔶Prepared Quarterly for listed companies
🔶Based on accrual accounting
🔶Prepared for a specific period
🔶With comparative figures
🔶Prepared Quarterly for listed companies
[D] How it is Used?
🔶To evaluate growth in Business
🔶To assess whether Co. made money or lost during the period
🔶Helps in gaining insights into financial Position of Co.
🔶Used for Calculating several ratios
🔶Further, it's used by several stakeholders for different purposes
🔶To evaluate growth in Business
🔶To assess whether Co. made money or lost during the period
🔶Helps in gaining insights into financial Position of Co.
🔶Used for Calculating several ratios
🔶Further, it's used by several stakeholders for different purposes

[E] Limitations of P&L A/C
P&L doesn't capture the entire picture always
E.g. it doesn't consider
🔶Loss of Valuable Employees
🔶Cash Realization of Profits
🔶Window dressing could be possible through several means
Let's understand Window dressing in detail 👇
Contd.
P&L doesn't capture the entire picture always
E.g. it doesn't consider
🔶Loss of Valuable Employees
🔶Cash Realization of Profits
🔶Window dressing could be possible through several means
Let's understand Window dressing in detail 👇
Contd.
[F] Window Dressing
Simply, it is a superficial or misleading presentation of F St. to create favourable impression
It includes methods such as:
🔶Revaluation of assets
🔶Heavy discount or commission to boost sales
🔶Changing the method of depreciation
🔶Sale and leaseback txn.
Simply, it is a superficial or misleading presentation of F St. to create favourable impression
It includes methods such as:
🔶Revaluation of assets
🔶Heavy discount or commission to boost sales
🔶Changing the method of depreciation
🔶Sale and leaseback txn.

Want us to keep doing this?
1. Follow us (@ICICI_Direct) and hit the bell icon🔔
2. Retweet this tweet
1. Follow us (@ICICI_Direct) and hit the bell icon🔔
2. Retweet this tweet
https://twitter.com/ICICI_Direct/status/1635891094482296835
TL;DR
[1] What is P&L A/c
[2] Components of P&L A/c
[3] What is Income
[4] What is Expense
[5] How P&L A/c is prepared
[6] How P&L A/c is used
[7] Limitations of P&L A/c
[8] What is Window dressing
[1] What is P&L A/c
[2] Components of P&L A/c
[3] What is Income
[4] What is Expense
[5] How P&L A/c is prepared
[6] How P&L A/c is used
[7] Limitations of P&L A/c
[8] What is Window dressing
Disclaimer: bit.ly/fulldisclaimer
• • •
Missing some Tweet in this thread? You can try to
force a refresh