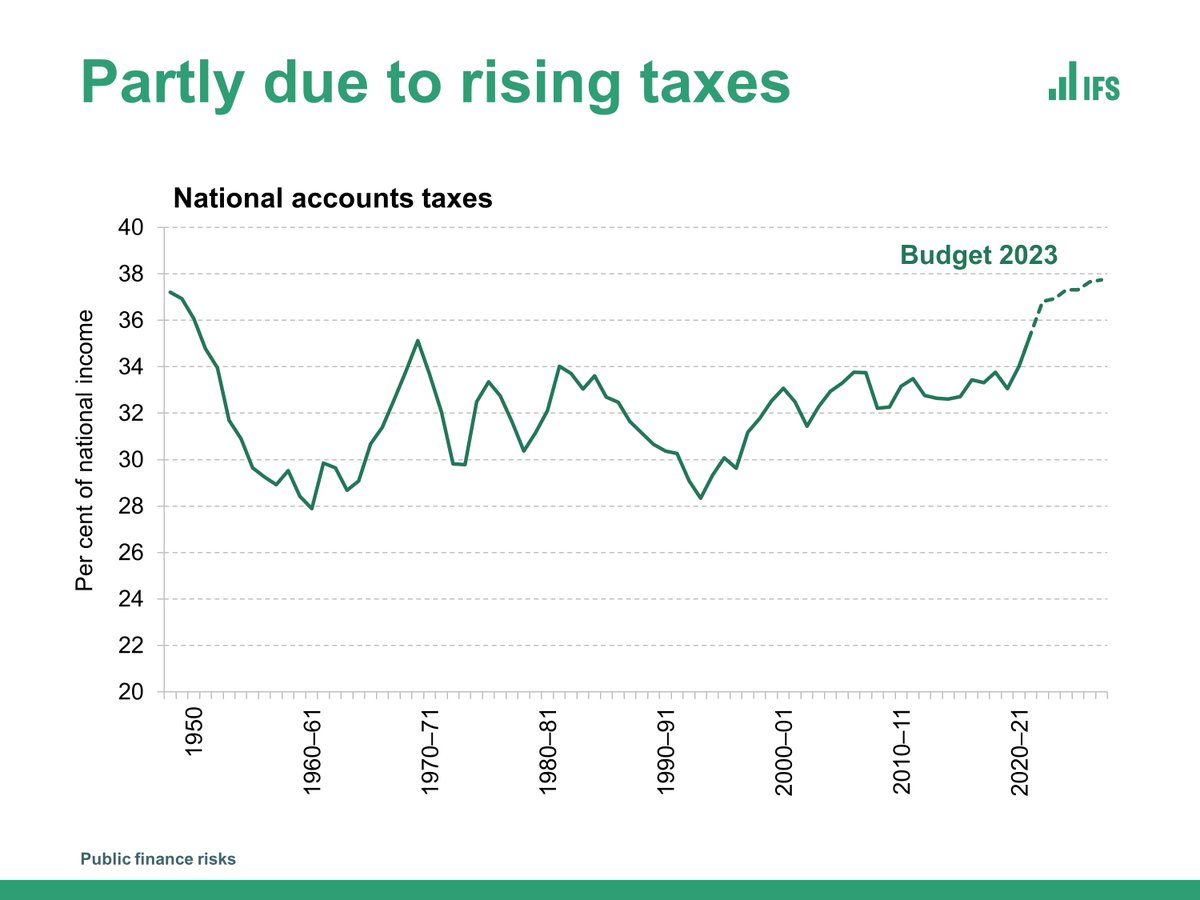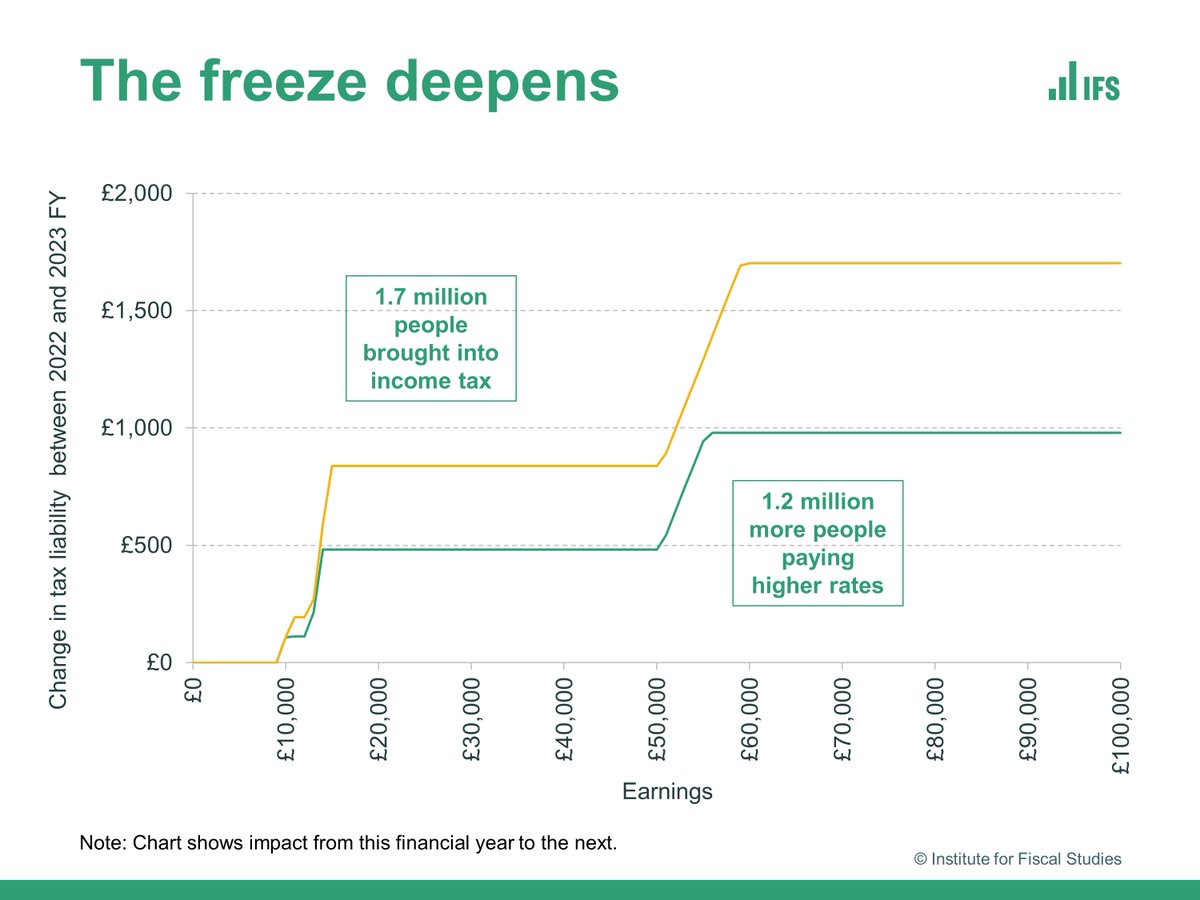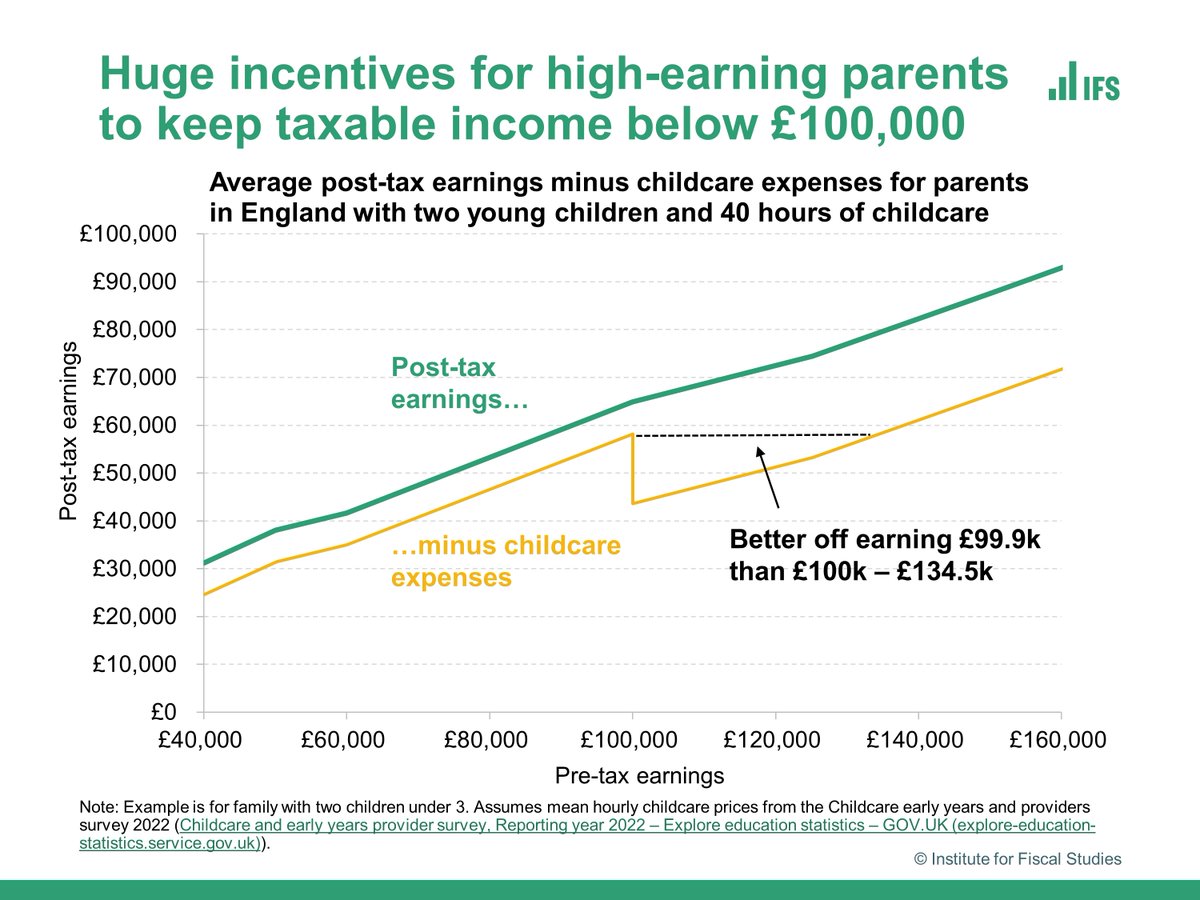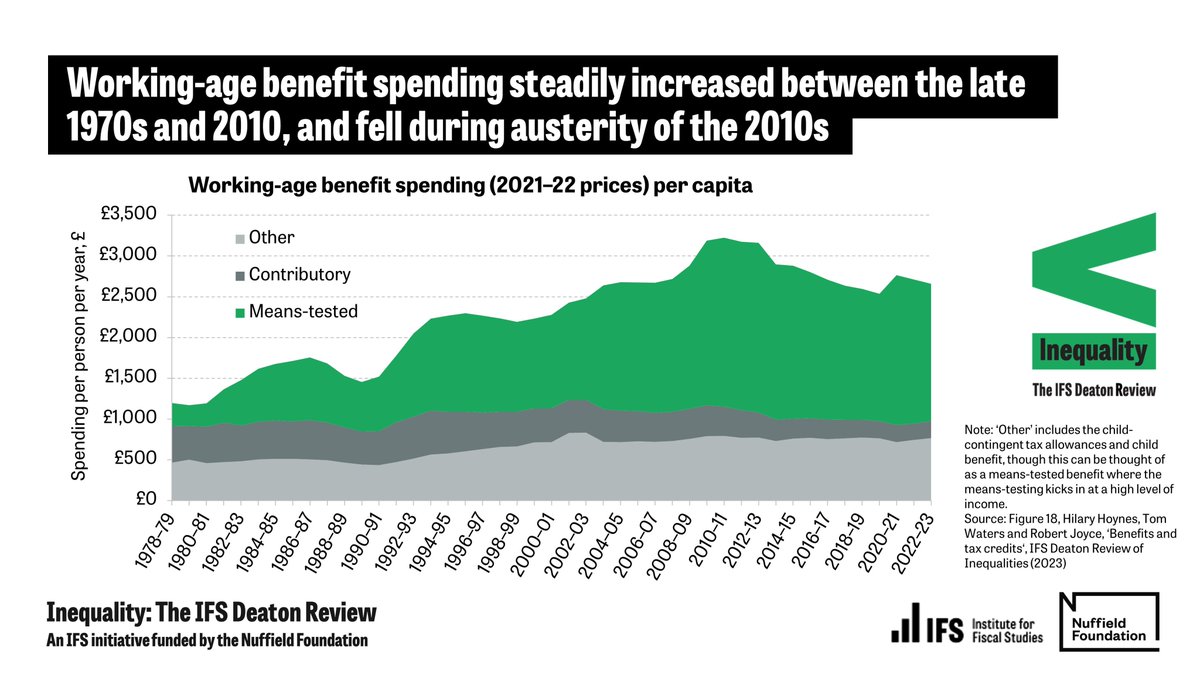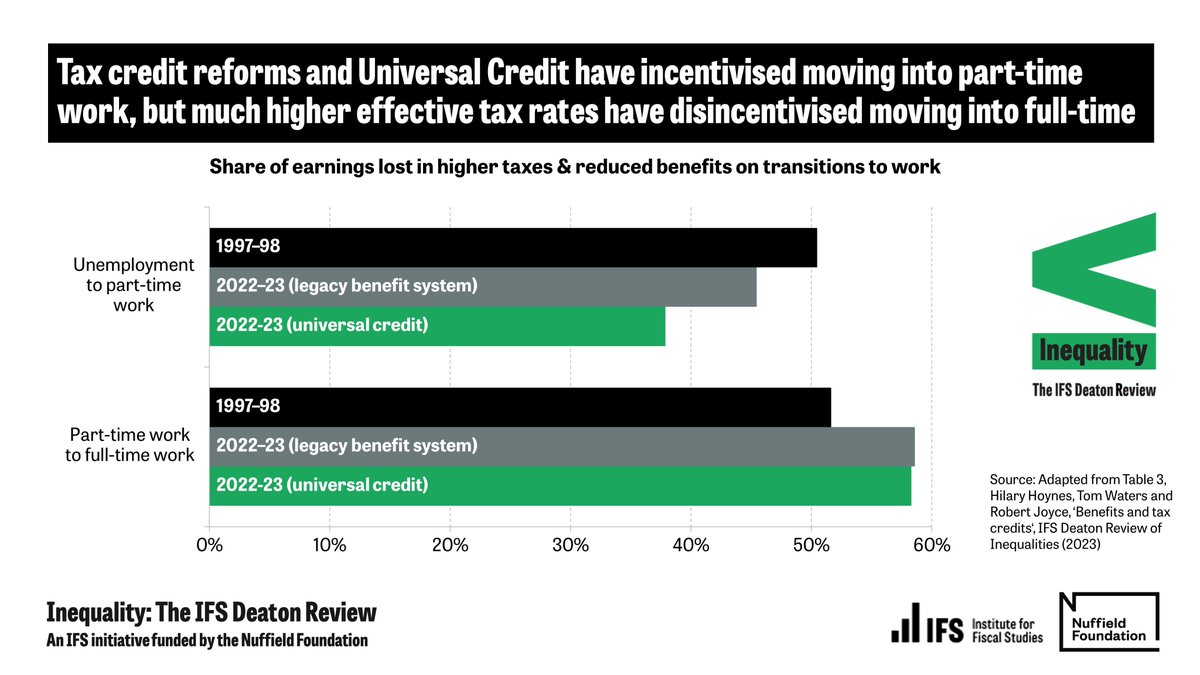
Carl Emmerson presents on the public finance risks and the public spending in our #Budget2023 analysis event.
Watch live here:
Watch live here:
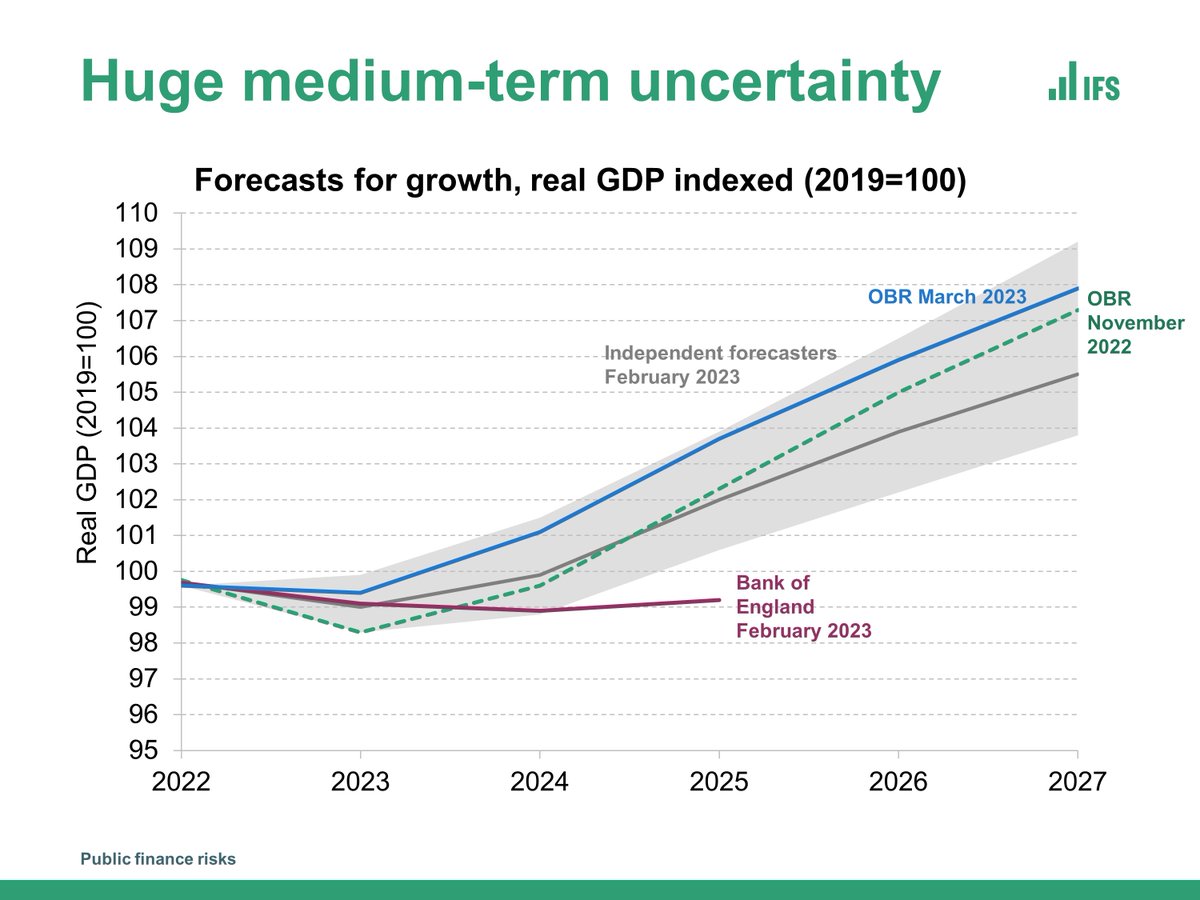
The @OBR_UK are now among the most optimistic of forecasters on growth, and expect the economy to be 0.6% bigger in 2027 than under its previous forecast.
This would be stronger growth than under @bankofengland's forecast, but still poor compared to the long-run average.
This would be stronger growth than under @bankofengland's forecast, but still poor compared to the long-run average.
Inflation may be coming down, but prices remain much higher than two years ago and earnings haven’t caught up.
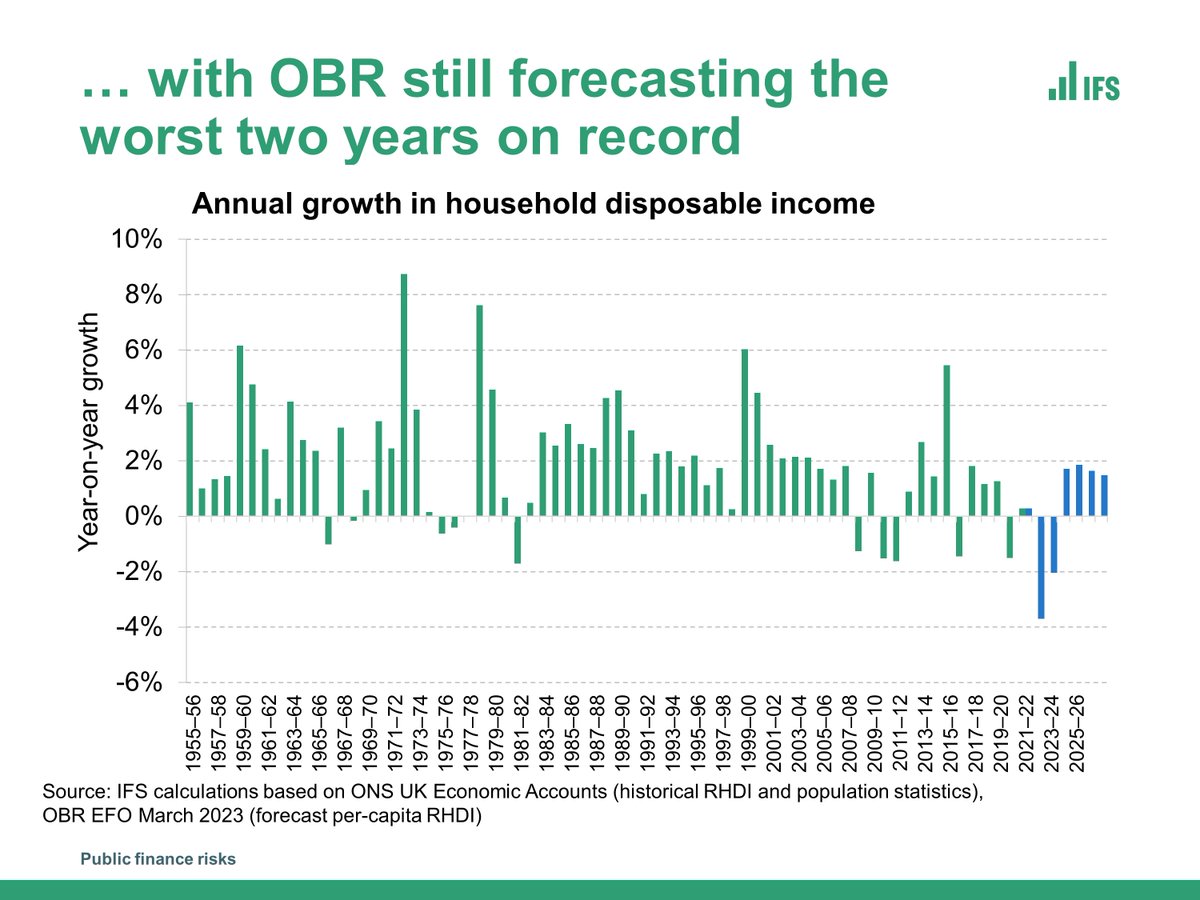
@OBR_uk’s still projects that real household disposable incomes will be no higher in 2027 than they were in 2019.
@OBR_uk’s still projects that real household disposable incomes will be no higher in 2027 than they were in 2019.

Real disposable household income is still undergoing its largest fall on record, despite @OBR_UK being more optimistic than in November.
Real disposable household income is set to drop by 3.7% this financial year, and over the next year by a further 2%.
Real disposable household income is set to drop by 3.7% this financial year, and over the next year by a further 2%.
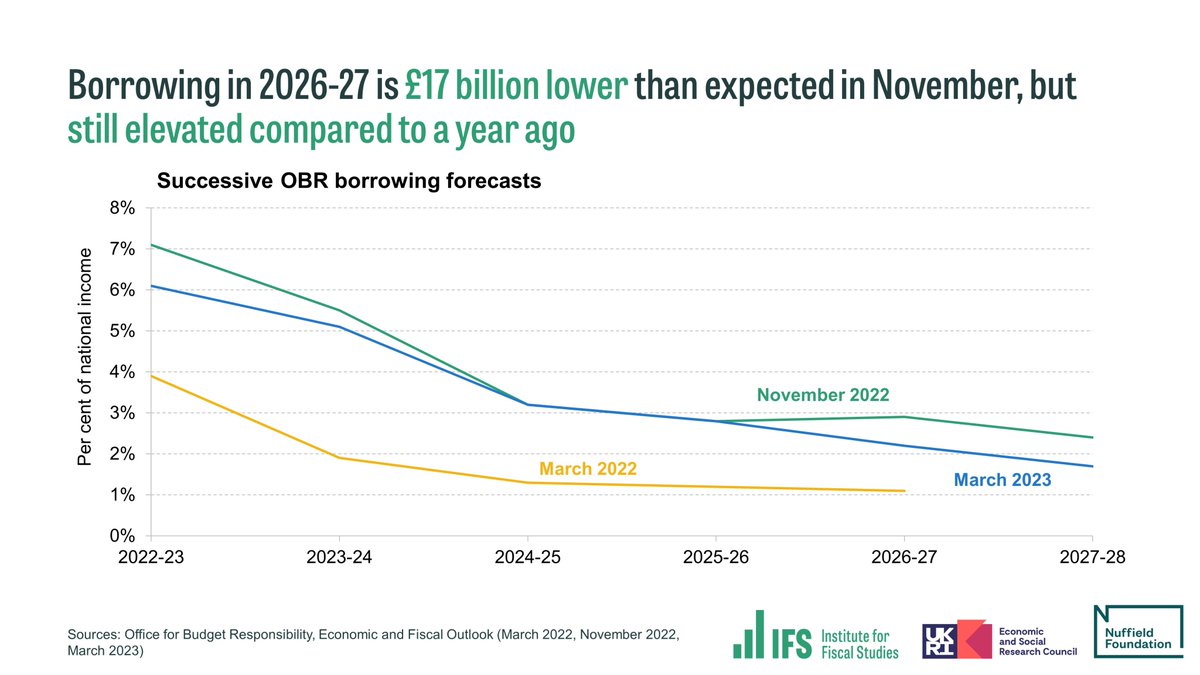
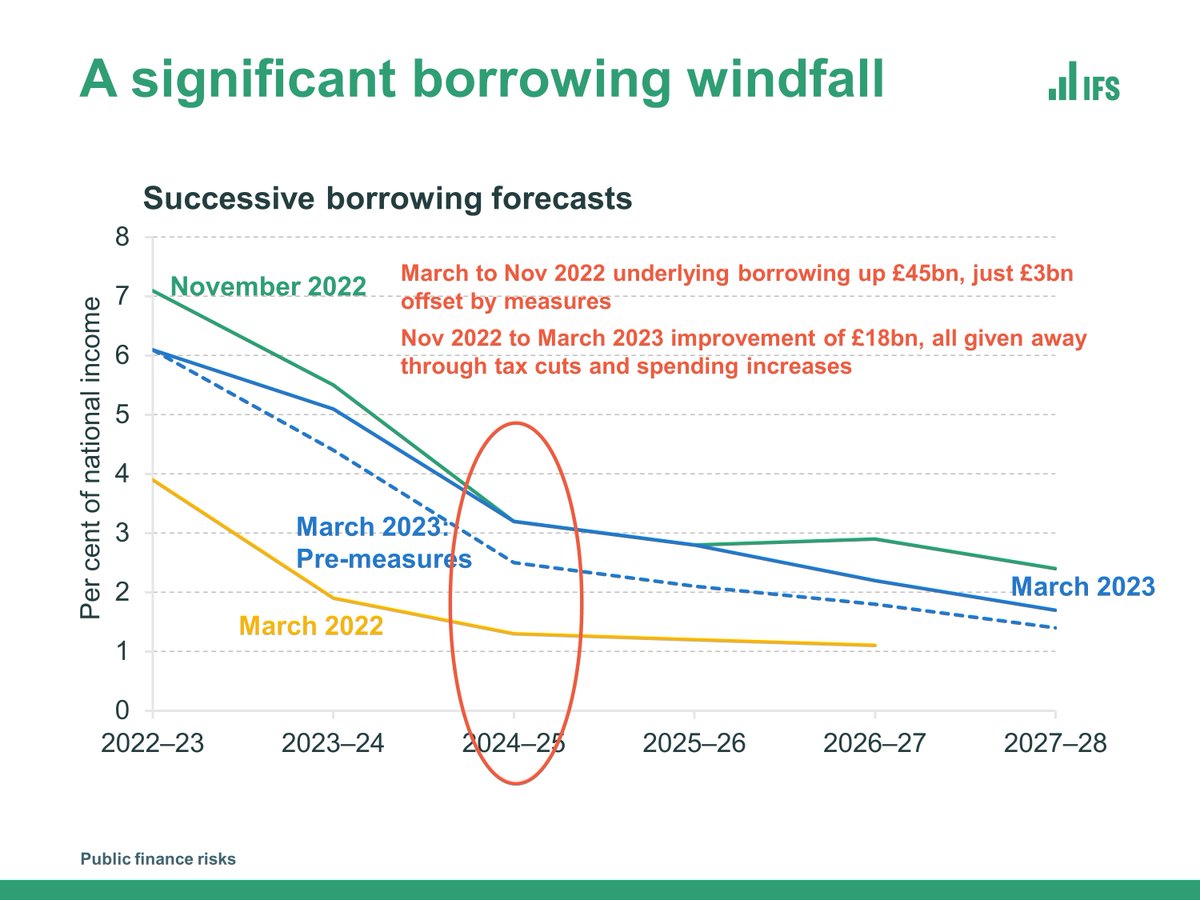
Borrowing in the later forecast years was revised down by @OBR_UK, by £17 billion or 0.6% of national income.
However, this still leaves borrowing higher than in the forecast produced before Russia’s 2022 invasion of Ukraine.
However, this still leaves borrowing higher than in the forecast produced before Russia’s 2022 invasion of Ukraine.
The medium-term trajectory for debt is extremely sensitive to what happens to growth.
Under the @OBR_UK's long-run growth assumption, debt would steadily fall. Under @bankofengland's assumption, it would effectively flatline.
Under the @OBR_UK's long-run growth assumption, debt would steadily fall. Under @bankofengland's assumption, it would effectively flatline.

Under one plausible scenario, 'unprotected' budgets like local government, further education, courts, prisons, HMRC could face £18bn of cuts over the three years after the next election.
https://twitter.com/BenZaranko/status/1636321648537219074
Fuel duty rates have been frozen in cash terms once again, and the 'temporary' 5p cut has been maintained. This amounts to a cumulative £80bn tax cut relative to RPI uprating since 2010–11.
Continuing these freeze would reduce revenues in 2027–28 by £4 billion.
Continuing these freeze would reduce revenues in 2027–28 by £4 billion.

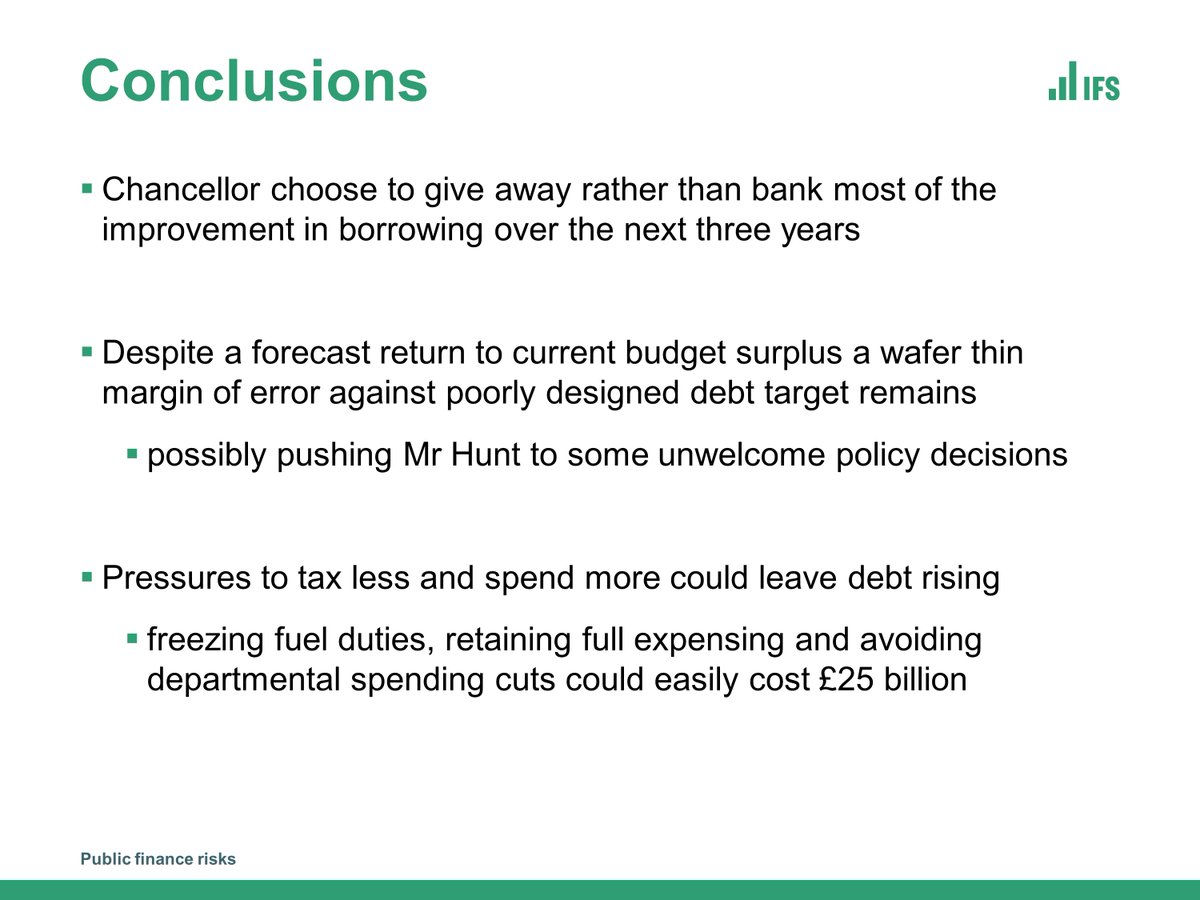
Despite a forecast return to current budget surplus, a "wafer-thin margin of error against a poorly designed debt target" could push @Jeremy_Hunt towards some unwelcome policy decisions.

• • •
Missing some Tweet in this thread? You can try to
force a refresh

