There has been a major—and almost entirely unnoticed—advance in the research on the most significant place-based incentive on the books. That’s right: it’s time to update your priors on Opportunity Zones!
Today colleagues @kenanfikri @AugustBenzow and I are out with an analysis of two very important studies on the size and effects of Opportunity Zones investment.
Bottom line: OZs are having impact on a scale not seen with previous place-based policies.
eig.org/opportunity-zo…
Bottom line: OZs are having impact on a scale not seen with previous place-based policies.
eig.org/opportunity-zo…
Why should you care about #OpportunityZones right now?
Because high-quality multi-year evidence is telling us that OZs have produced:
✅Large-scale $ and geographic reach
✅Large development effects
✅positive spillovers
✅⬆️housing supply
✅⬆️housing values
✅stable rents
Because high-quality multi-year evidence is telling us that OZs have produced:
✅Large-scale $ and geographic reach
✅Large development effects
✅positive spillovers
✅⬆️housing supply
✅⬆️housing values
✅stable rents
Let’s look at each of the major findings we cover in our analysis, starting with ones from a study of IRS tax return data through 2020 on the scale, reach, and targeting of OZ investment.
papers.ssrn.com/sol3/papers.cf…
papers.ssrn.com/sol3/papers.cf…
First, IRS data confirms the geographic reach of OZs is enormous. Nearly half of all OZs–roughly 3,800 communities–had received investment through 2020, less than three years after the policy took effect. For comparison, it took NMTC investment 18 years to achieve the same reach. 

Next, IRS data confirms what has long been obvious to any close observer: the types of communities seeing investment are on average low-income, high-poverty places that lag far behind the economic vitality of the average US community.
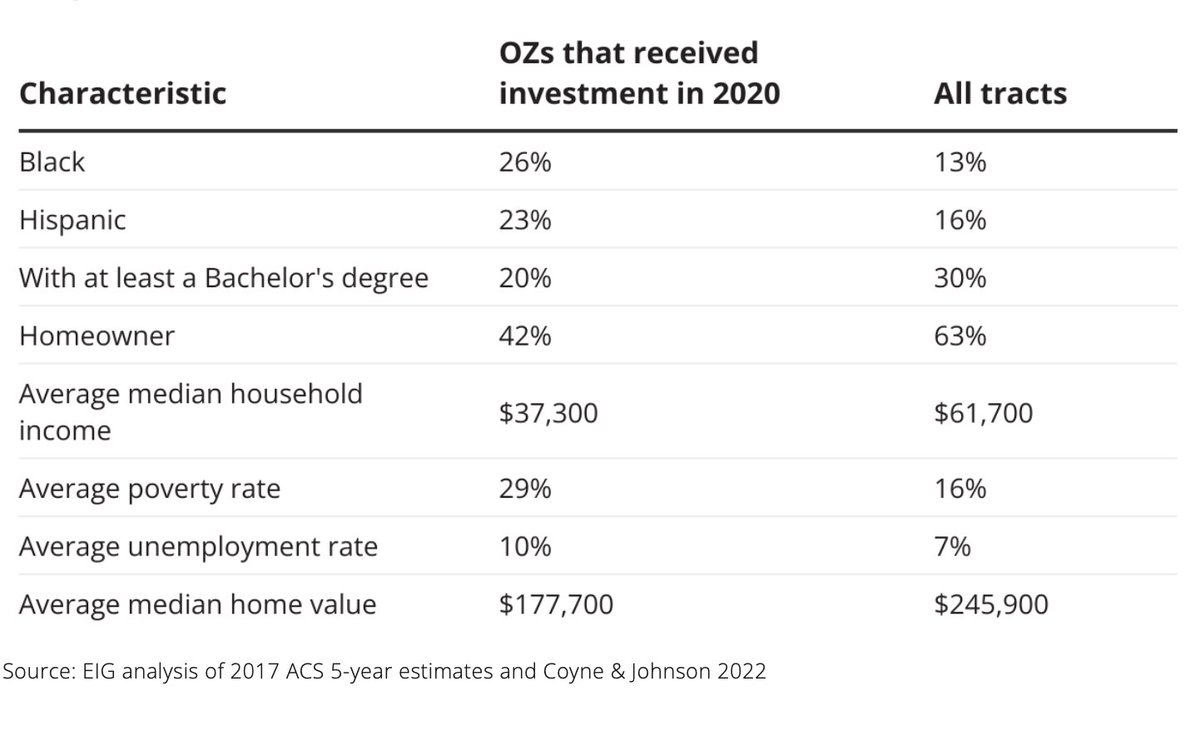
When ranked from lowest to highest percentiles of need, invested OZs average in the 87th for poverty, 81st for median household income, and 80th for unemployment. When weighted by dollars invested, they rank at the 85th percentile for poverty and 70th for MHI.
What’s more, IRS data confirms that a significant portion of total investment is going to the most severely distressed OZs. The bottom 1/3 of OZs by household income rank within the bottom *decile* of all US tracts.
This is not the outcome that many expected.
This is not the outcome that many expected.

These findings are only surprising if one was led to think that OZ designations were generally not well-targeted. Some critics have tried very hard to make it seem so by treating extreme outliers as representative of the broader story. As you can see: nope.


What about the *amount* of investment? A key goal for OZs was achieving the meaningful scale that eluded past revitalization policies.
By the end of 2020, OZ investment was already $48B+ —much larger than previous programs—& there is strong evidence it is much higher today.
By the end of 2020, OZ investment was already $48B+ —much larger than previous programs—& there is strong evidence it is much higher today.
One key reason why OZ investment quickly reached such a large scale is that the policy succeeded in generating widespread & geographically distributed participation from investors, including 21k individuals & 4k corporate investors. (For comparison, NMTC is 95% corporate.)
Why does broad participation among investors matter in achieving OZ’s policy goals? Simply put, the driving force behind the diffuse geography of OZ investment is its diffuse investor base with local knowledge, which was encouraged by the flexible and decentralized OZ structure.
So far we’ve covered dollars, spatial reach, and community characteristics. But what actually has OZ designation *caused* to happen within target communities?
That question brings us to the most credible study of OZ effects to date, by Harrison Wheeler.
hbwheeler.github.io/files/JMP_HW.p…
That question brings us to the most credible study of OZ effects to date, by Harrison Wheeler.
hbwheeler.github.io/files/JMP_HW.p…

It's important to understand this is not just one study among many. This is a very careful study gathering unique data over a sufficient time period, using a variety of rigorous approaches, and credibly demonstrating a causal and economically significant effect. It stands apart.
The study looks at commercial and residential building permits data across 47 cities through mid-2022 to see if OZ designation produced an effect on local development.
Result: a “large and immediate effect” such that the monthly probability of new investment jumps by over 20%.
Result: a “large and immediate effect” such that the monthly probability of new investment jumps by over 20%.

That’s just the beginning of what makes this so interesting. Wheeler also finds that, rather than simply poaching activity from nearby tracts, OZs produce positive spillovers to neighboring communities. He even observes a meaningful boost in development on a city-wide scale.
Now let’s zero-in on housing. OZs is a fundamentally supply-oriented policy. And what do we know about the effects of new housing supply? It restrains rents and decreases displacement pressure. That is exactly what we see in OZs.
Wheeler finds that OZ designations boosted housing supply and increased median home values by 3.4% through 2020 *while rents remain stable*.
As every YIMBY knows, that’s what the housing literature told us to expect! Many observers didn’t expect it because they fundamentally misunderstand the supply-oriented OZ incentive model.
Lots of critics have botched the OZ housing story. They claimed that new housing supply–and an increase in housing values–would lead to a surge in rents and displacement. I wrote about why this is backwards back in 2021: eig.org/wp-content/upl…
It’s hard to overstate the significance of these findings. The combination of large causal effects on development, positive spillovers to neighboring tracts, a boost in home values, and stable rents is extremely promising–and, to put it mildly, not what many observers expected.
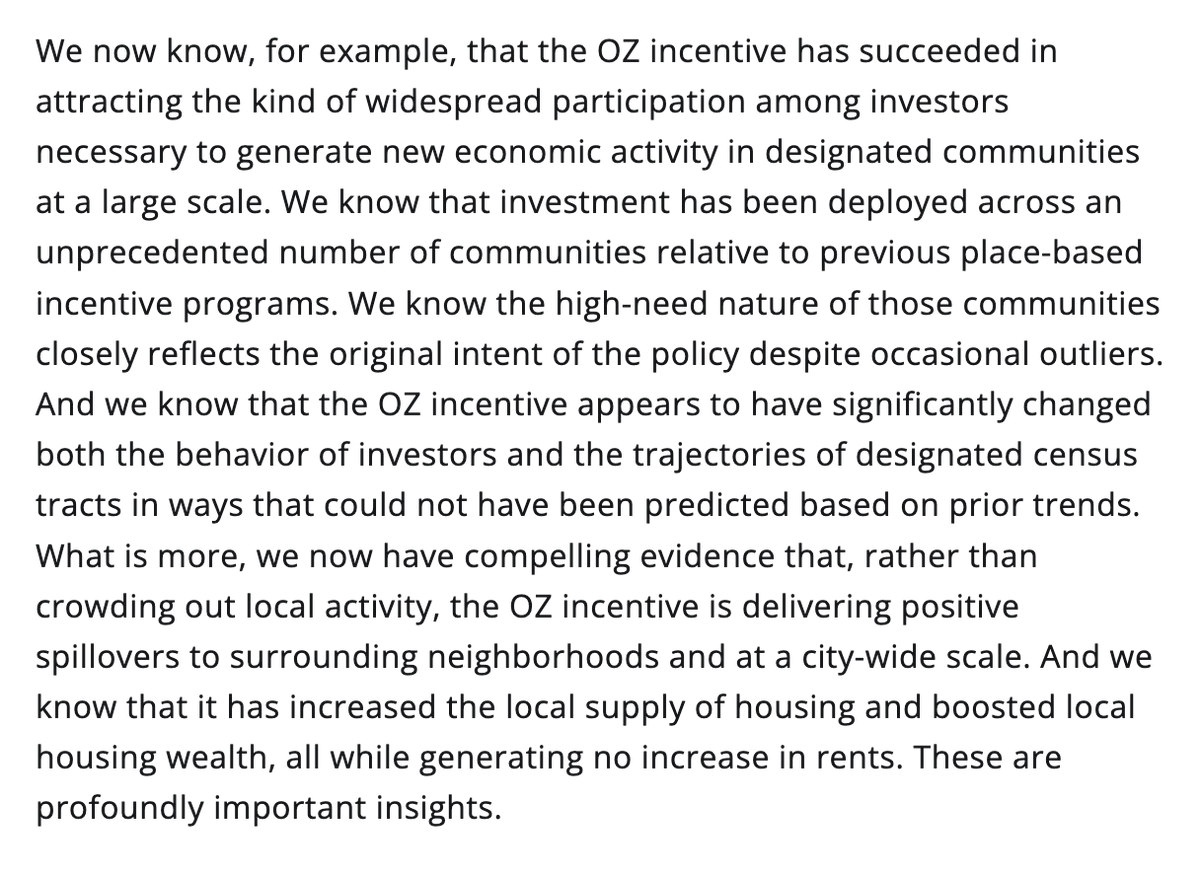
Early perceptions of the OZs were heavily shaped by outliers, anecdotes, and incomplete preliminary data. While we don’t yet have answers to critical, long-term questions, we know enough to put to rest many early critiques and misconceptions about the policy.
Regardless of what one thinks of OZs, we’re in a new era of place-based policymaking—one that OZs itself helped usher in. We need to carefully study this big experiment in a more flexible, decentralized, and scalable incentive model and apply lessons to future efforts.
To do that, we need more and better publicly available OZ data. And that, in turn, will require Congress to act. Fortunately, lawmakers in both parties agree.
scott.senate.gov/media-center/p…
scott.senate.gov/media-center/p…
In the end, the emerging evidence should motivate lawmakers to make Opportunity Zones a more transparent, carefully measured, and powerful tool in a new generation of policies to uplift needy communities and regions.
/end
/end
• • •
Missing some Tweet in this thread? You can try to
force a refresh