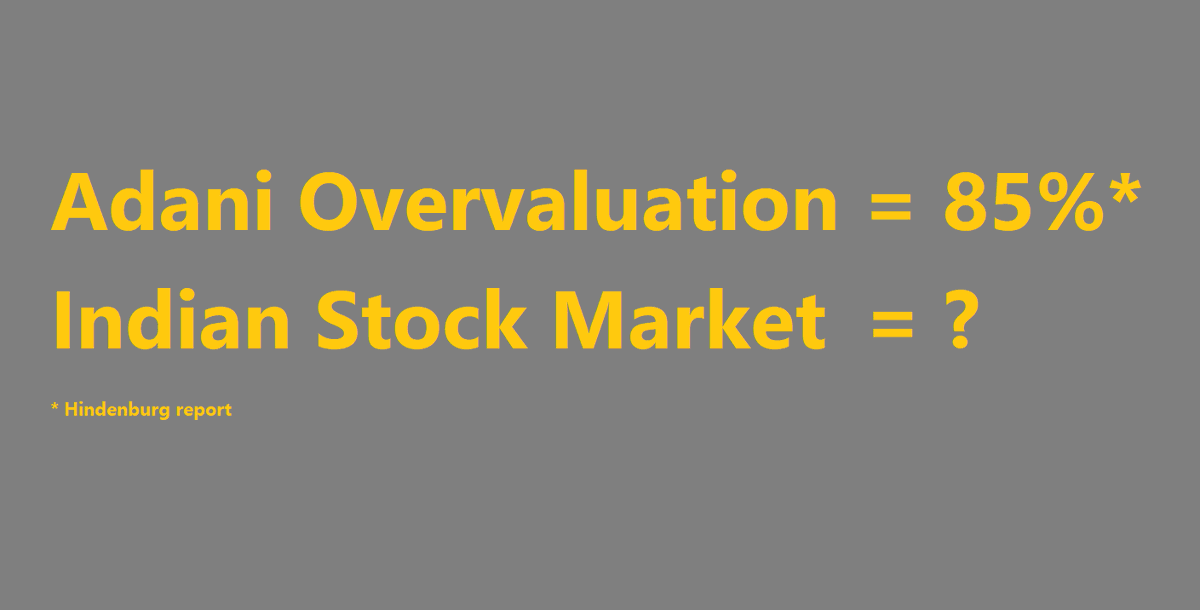
▪️ If Adani shares are overvalued by 85%, how much is the Indian stock market overvalued?
▪️ What keeps the bubble going?
▪️ Should you stay invested?
Long thread Warning! I hope it will be worth it.
(1/n)
▪️ What keeps the bubble going?
▪️ Should you stay invested?
Long thread Warning! I hope it will be worth it.
(1/n)
How can we estimate the size of the bubble?
BSE Sensex averaged 20,120 in FY 2013-14. NIFTY-50 averaged at 6009. In Dec-2022, Sensex hit an all-time high of 63,583 and NIFTY hit 18,887.
Sensex rose by 3.16x times and NIFTY by 3.14x in 8 years. What's wrong with this?
(2/n)
BSE Sensex averaged 20,120 in FY 2013-14. NIFTY-50 averaged at 6009. In Dec-2022, Sensex hit an all-time high of 63,583 and NIFTY hit 18,887.
Sensex rose by 3.16x times and NIFTY by 3.14x in 8 years. What's wrong with this?
(2/n)

There's nothing wrong with this if the economy also grew at the same pace. But it didn't.
GDP growth - 1.56x
Exports - 1.43x
Forex Reserves - 1.74x
It's nowhere close to Sensex growth of 3.14x. One can argue that Markets and the Economy are not linked. Fair enough.
(3/n)
GDP growth - 1.56x
Exports - 1.43x
Forex Reserves - 1.74x
It's nowhere close to Sensex growth of 3.14x. One can argue that Markets and the Economy are not linked. Fair enough.
(3/n)

Take a look at the Revenue growth and Profit Before Tax (PBT) of 30 companies listed on Sensex now.
When compared to 2014, Revenue grew by only 1.82x and Profits grew by 2.25x only. What about NIFTY?
(4/n)
When compared to 2014, Revenue grew by only 1.82x and Profits grew by 2.25x only. What about NIFTY?
(4/n)

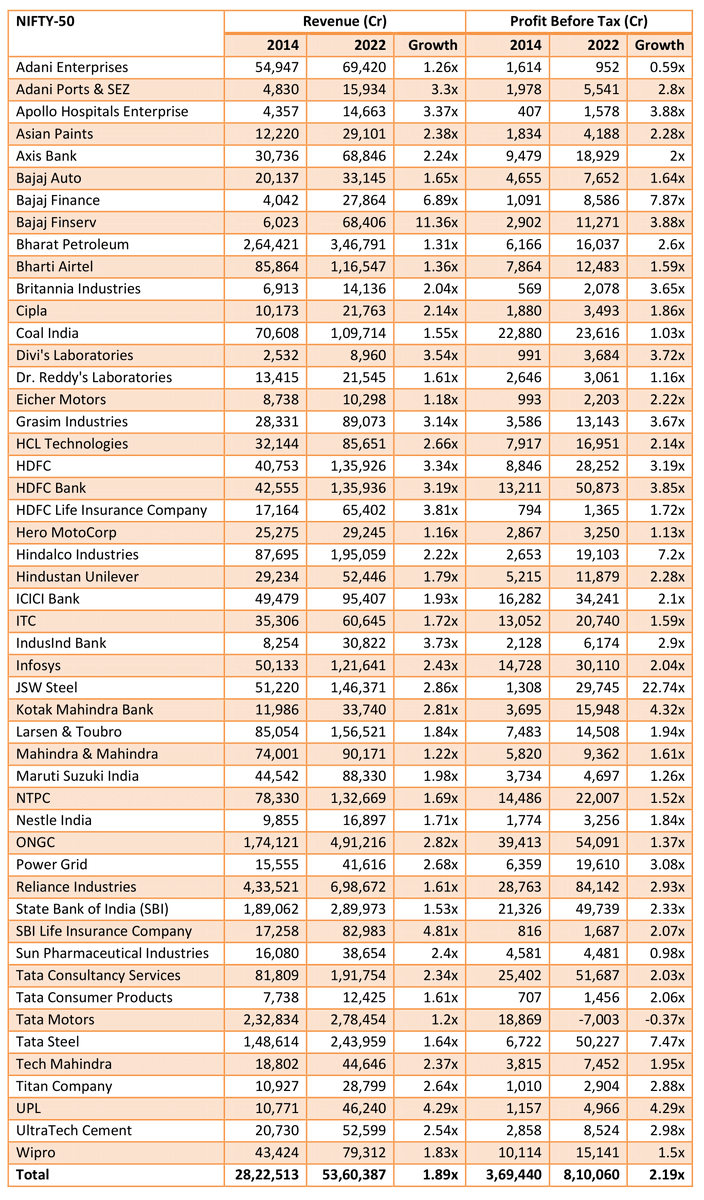
Revenue of 50 companies listed in NIFTY grew by only 1.89x and Profits grew by 2.19x. Similar lines as Sensex.
Basically, stock prices are going up or driven up without any substantial growth in the economy or fundamentals of these companies.
(5/n)
Basically, stock prices are going up or driven up without any substantial growth in the economy or fundamentals of these companies.
(5/n)
Back to my first question. Indian stock market is overvalued by around 35-37%.
Sensex should be between 1.9x - 2.2x of 2014 valuation, which is a reasonably liberal multiplier. Sensex should be between 38,000 - 44,000.
NIFTY should be in the range 11,400 - 13,200.
(6/n)
Sensex should be between 1.9x - 2.2x of 2014 valuation, which is a reasonably liberal multiplier. Sensex should be between 38,000 - 44,000.
NIFTY should be in the range 11,400 - 13,200.
(6/n)
The Price-To-Earning ratio is a way to see how much investors are willing to pay for each Rupee/Dollar a company earns.
Look at the P/E of 10 major world economies. India tops with 22.13, which means India stocks are the most exorbitantly priced stocks in comparison.
(7/n)
Look at the P/E of 10 major world economies. India tops with 22.13, which means India stocks are the most exorbitantly priced stocks in comparison.
(7/n)

It is also 37% higher than the mean P/E of economies which is around 14.
This again falls in line with my assessment based on revenue/profit growth.
So, how this bubble was created and what keeps it going?
(8/n)
This again falls in line with my assessment based on revenue/profit growth.
So, how this bubble was created and what keeps it going?
(8/n)
Surplus money is the major reason for creating this froth in the Indian markets. And it is not driven by foreign investments, but by domestic institutional investors (DII).
▪️ Who are DIIs?
▪️ How much did they receive?
▪️ Where are they getting this much money from?
(9/n)
▪️ Who are DIIs?
▪️ How much did they receive?
▪️ Where are they getting this much money from?
(9/n)
DIIs are Mutual Fund companies, Insurance companies (LIC etc.), Pension Funds (EPFO), Banks and other financial institutions.
Employee Provident Funds Organisation (EPFO) started investing in stocks in 2015 when Govt gave permission to invest up to 5% of its corpus. (10/n)
Employee Provident Funds Organisation (EPFO) started investing in stocks in 2015 when Govt gave permission to invest up to 5% of its corpus. (10/n)
Now the limits are raised to 15% and around 1.8 lakh crore from the EPFO corpus is invested in the markets through ETFs.
Govt is considering increasing the limit to 25% which will add more money to the markets. (11/n)
economictimes.indiatimes.com/news/economy/p…
Govt is considering increasing the limit to 25% which will add more money to the markets. (11/n)
economictimes.indiatimes.com/news/economy/p…
Wait; EPFO is not the biggest contributor, Mutual Funds are. Take a look at the assets under management (AUM) of all Mutual Funds in India.
From ₹8.25 lakh crore in 2014, the AUM went up all the way to ₹40.37 lakh crore in Nov-22 when the indices hit an all-time high.
(12/n)
From ₹8.25 lakh crore in 2014, the AUM went up all the way to ₹40.37 lakh crore in Nov-22 when the indices hit an all-time high.
(12/n)

It is this surplus money coming into Mutual Funds that is driving the markets like crazy.
Take a look at the correlation graph between Sensex, NIFTY and Mutual Funds AUM from 1999.
Except during the 2008 financial crisis, it correlates most of the time.
(13/n)


Take a look at the correlation graph between Sensex, NIFTY and Mutual Funds AUM from 1999.
Except during the 2008 financial crisis, it correlates most of the time.
(13/n)


How are they getting so much money?
The Association of Mutual Funds in India (AMFI) has started an ad campaign called "Mutual Funds Sahi Hai" broadly meaning "Mutuals Funds are Good/Right/Correct".
They advertised heavily on Print, TV, Outdoor and Digital Media. (14/n)
The Association of Mutual Funds in India (AMFI) has started an ad campaign called "Mutual Funds Sahi Hai" broadly meaning "Mutuals Funds are Good/Right/Correct".
They advertised heavily on Print, TV, Outdoor and Digital Media. (14/n)
For instance AMFI's ad spent in 2017 was ₹280 Cr and in 2018 they spent ₹350 Cr.
To put it in perspective, Govt of India spends around ₹650-700 Cr Ads and this is more than half of Govt's ad spend. (15/n)
livemint.com/Industry/qqDbw…
To put it in perspective, Govt of India spends around ₹650-700 Cr Ads and this is more than half of Govt's ad spend. (15/n)
livemint.com/Industry/qqDbw…
They also promoted "SIP Sahi Hai", Systematic Investment Plan(SIP), where a fixed amount is invested monthly.
In 2020, they roped in @sachin_rt & @msdhoni as brand ambassadors for @amfiindia's "Mutual Fund Sahi Hai". Latest ad spend is unknown.
(16/n)
In 2020, they roped in @sachin_rt & @msdhoni as brand ambassadors for @amfiindia's "Mutual Fund Sahi Hai". Latest ad spend is unknown.
(16/n)
These ads were quite pervasive and popular. Sachin's ad got up to 10 Cr views on YouTube alone.
What do these ads tell you? They are reducing the risk perception of the masses quite significantly.
(17/n)
What do these ads tell you? They are reducing the risk perception of the masses quite significantly.
(17/n)

For example, this ad tells you that risk-taking while batting or crossing the road is the same as betting your savings in Mutual Funds.
It is trivialising financial risk-taking for a common man who doesn't really know the real risks involved.
(18/n)
It is trivialising financial risk-taking for a common man who doesn't really know the real risks involved.
(18/n)
This Sachin ad tells that there is no need to panic even if the entire portfolio goes down. Everyone is losing including @sachin_rt. And it will go up again if you stay invested in the long term.
Fallacies: Appeal to irrelevant authority & appeal to the bandwagon.
(19/n)
Fallacies: Appeal to irrelevant authority & appeal to the bandwagon.
(19/n)
The previous ad contradicts the concept of instant liquidity of Mutual Funds promoted in this ad.
During a crisis period, when the economy and markets are down, can you easily liquidate your holdings without losing money? More on that later.
(20/n)
During a crisis period, when the economy and markets are down, can you easily liquidate your holdings without losing money? More on that later.
(20/n)
Why are MF companies spending thousands of crores in ads? How do they benefit?
Asset Management Companies (AMC) charge around 1% - 3% of your investment amount for expenses like marketing, management fees, exit load and so on. (21/n)
groww.in/blog/mutual-fu…
Asset Management Companies (AMC) charge around 1% - 3% of your investment amount for expenses like marketing, management fees, exit load and so on. (21/n)
groww.in/blog/mutual-fu…
If we assume an average of 2%, then 2% of ₹40 Lakh Cr is ₹80,000 Cr. This is just indicative, but guaranteed for AMCs.
Whether you'll get positive returns or not, they'll recover many times their ad spend. That much is for sure. (22/n)
Whether you'll get positive returns or not, they'll recover many times their ad spend. That much is for sure. (22/n)
Now let's come to the ultimate question. Kya, SIP Sahi Hai?
Google "SIP Calculator", and you'll find hundreds of them by various MF companies. Go through a couple of them and you'll notice a few things gross.
(23/n)
Google "SIP Calculator", and you'll find hundreds of them by various MF companies. Go through a couple of them and you'll notice a few things gross.
(23/n)

The 4 SIP calculators show that their "expected rate of returns" starts from 1% or more.
For Franklin Templeton, the minimum is 8%! Will they compensate if the returns become less than 8%?
All of this gives a false comfort that returns can never be negative. (24/n)


For Franklin Templeton, the minimum is 8%! Will they compensate if the returns become less than 8%?
All of this gives a false comfort that returns can never be negative. (24/n)


It is very easy to hit negative returns in SIP. Let me show you how easy it is.
If you invest in Sensex, it went up from 40,000 to 62,000 in 3 years. Let's assume that it is going to come down to 40,000 in another 3 years. And let's plot it linearly for simplicity. (25/n)
If you invest in Sensex, it went up from 40,000 to 62,000 in 3 years. Let's assume that it is going to come down to 40,000 in another 3 years. And let's plot it linearly for simplicity. (25/n)
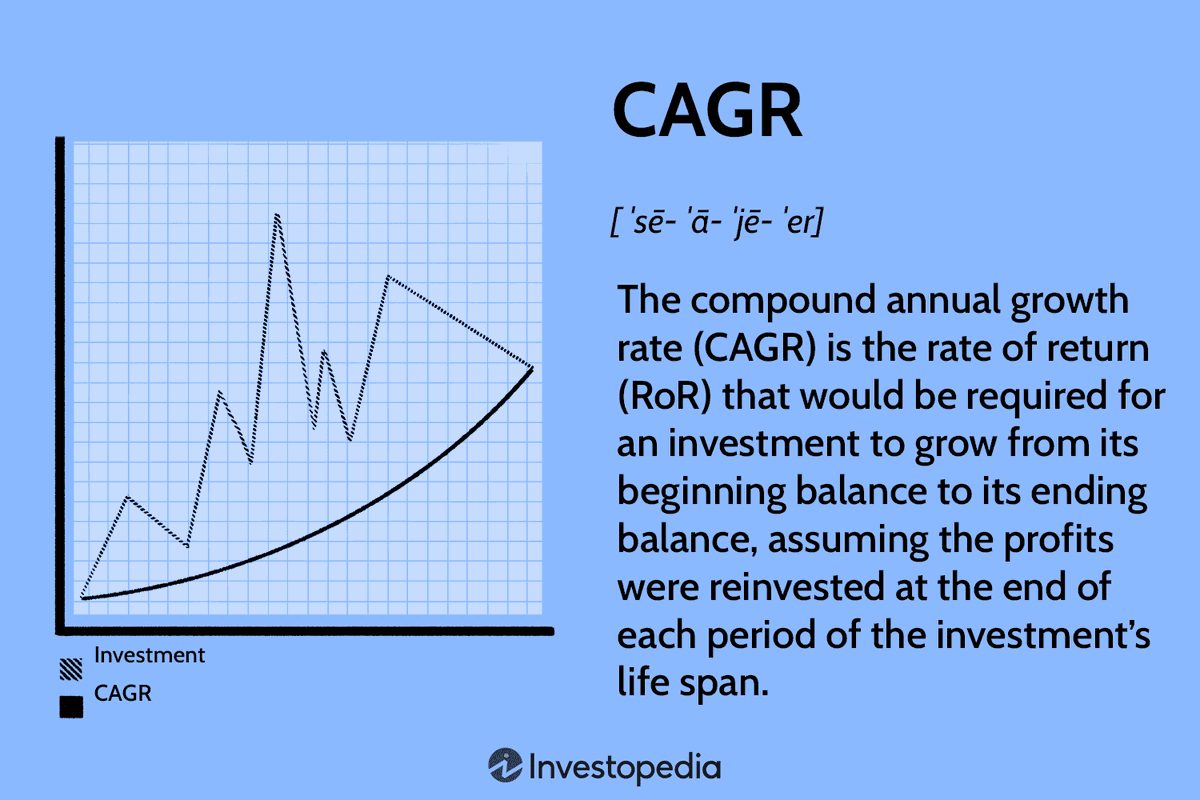
CAGR or Compounded Annual Growth Rate is the actual indicator of return. This is the common practice and best practice used to analyse the return on any investment.
This makes it easy to compare against a Fixed Deposit rate which does compounding. (26/n)
This makes it easy to compare against a Fixed Deposit rate which does compounding. (26/n)
Let's take the case of Sensex going up from 40K to 62K and coming back to 40K in 6 years linearly.
If you keep investing 10,000 monthly, you'll end up with a net loss of -19.1% and a CAGR of -3.47% after 6 years. Your 7.2 lakhs became 5.82 lakhs.
(27/n)
If you keep investing 10,000 monthly, you'll end up with a net loss of -19.1% and a CAGR of -3.47% after 6 years. Your 7.2 lakhs became 5.82 lakhs.
(27/n)

Instead of gliding, suppose the Sensex crashes to 40,000 in a year then you'll be even worse off. The CAGR will be -4.45%.
(28/n)
(28/n)

If you follow @sachin_rt's advice and stay invested what will happen? (Tweet-19)
Assume that Sensex recovers back to 62,000 in another 3 years. The best you can recover is to a CAGR of 2.2% but never to the 8%, you had once upon a time.
That's a white lie!
(29/n)
Assume that Sensex recovers back to 62,000 in another 3 years. The best you can recover is to a CAGR of 2.2% but never to the 8%, you had once upon a time.
That's a white lie!
(29/n)

Let's find out how much Sensex should go up, in order to get back to the 8% CAGR which we had in the beginning.
To get back to 8% CAGR, Sensex has to hit 1,12,000 (in 3 years) in order to get back to where it began. Think about it carefully.
(30/n)
To get back to 8% CAGR, Sensex has to hit 1,12,000 (in 3 years) in order to get back to where it began. Think about it carefully.
(30/n)

Instead of gliding, let's take case-2 where it crashes in a year (Tw:28/n). Then, you might be better off as it needs Sensex to hit only 95,000 in 3 years to be back to 8% CAGR.
The catch here is "3 years". The more time it takes, the chance of getting to 8% is unlikely. (31/n)
The catch here is "3 years". The more time it takes, the chance of getting to 8% is unlikely. (31/n)

This "long-term gains" funda is subject to so many conditions. Most of the long-term gains are not based on SIP.
An FD of 7% gives a 7.2% CAGR, but whereas a recurring deposit (SIP) with the same interest rate gives a CAGR of 3.73%.
Take time, think about it. (32/n)
An FD of 7% gives a 7.2% CAGR, but whereas a recurring deposit (SIP) with the same interest rate gives a CAGR of 3.73%.
Take time, think about it. (32/n)

You might have the following questions:
1. What about non-Index Mutual Funds giving high CAGR returns?
2. Compounding is not taken into account.
3. Why are fund managers still investing in a bubble?
(33/n)
1. What about non-Index Mutual Funds giving high CAGR returns?
2. Compounding is not taken into account.
3. Why are fund managers still investing in a bubble?
(33/n)
I took index funds as it is getting popular these days. It is simpler to establish the point, as Sensex is widely followed.
There are actively managed funds giving +ve returns, but it's hard to compute how much they'll lose if the Sensex tumbles. (34/n)
economictimes.indiatimes.com/markets/stocks…
There are actively managed funds giving +ve returns, but it's hard to compute how much they'll lose if the Sensex tumbles. (34/n)
economictimes.indiatimes.com/markets/stocks…
Compounding is another grossly misrepresented topic in these ads and literature. Listen to our champ from MF Sahi Hai talking about compounding.
His apple tree example equivalents are used by network marketing Ponzi scheme folks. (35/n)
His apple tree example equivalents are used by network marketing Ponzi scheme folks. (35/n)
Read this portion from Franklin Templeton's SIP calculator "investor education" piece.
What does it tell you? MFs earn a fixed 10% interest at the end of the year like an FD.
Is there anything like that? No.
(36/n)
franklintempletonindia.com/investor/sip-c…
What does it tell you? MFs earn a fixed 10% interest at the end of the year like an FD.
Is there anything like that? No.
(36/n)
franklintempletonindia.com/investor/sip-c…

A Mutual Fund gets dividends from the shares of the companies it holds. But is that anywhere near 10%? No.
Compared to the rest of the world, India gives the lowest dividend yield of 1.27%. Mgmt fees might be higher than this. That's why I didn't take it into account. (37/n)
Compared to the rest of the world, India gives the lowest dividend yield of 1.27%. Mgmt fees might be higher than this. That's why I didn't take it into account. (37/n)

Why are expert fund managers not realising this and continue enlarging this bubble? No, they are not. They are trying their best to hold cash and avoid investing.
When inflows increase they have no choice other than to buy to keep the bubble going (38/n)
economictimes.indiatimes.com/mf/mf-news/cas…
When inflows increase they have no choice other than to buy to keep the bubble going (38/n)
economictimes.indiatimes.com/mf/mf-news/cas…
And my argument is that this bubble is fueled by the #MutualFundsSahiHai and #SIPSahiHai frenzy created by AMFI spending thousands of crores in all-pervasive misleading ads.
This is forcing the country's savings to be put in one basket. @SEBI_India must look into this.
(39/n)
This is forcing the country's savings to be put in one basket. @SEBI_India must look into this.
(39/n)
And when it crashes, FIIs are going to have the last laugh. They have been pulling out from India at peaks from April-21.
But the markets didn't even wink. Instead, it hit all-time high. But remember, we are buying at the peaks giving handsome profits to fleeing FIIs.
(40/n)
But the markets didn't even wink. Instead, it hit all-time high. But remember, we are buying at the peaks giving handsome profits to fleeing FIIs.
(40/n)

The smartest investors buy in troughs and sell on the peak. But figuring out whether we are at a peak or trough is the real deal.
I believe we have hit a peak. Can the Sensex go above 63500 in 2-3 years? I don't think so. It can only go down from here. (41/n)
I believe we have hit a peak. Can the Sensex go above 63500 in 2-3 years? I don't think so. It can only go down from here. (41/n)
I really don't know when you entered the market. It's for you to sit and calculate whether you've hit the highest-ever CAGR.
If so, listening to Sachin's advice of staying invested is not going to do good for you. (42/n)
If so, listening to Sachin's advice of staying invested is not going to do good for you. (42/n)
Don't outsource your thinking to someone else. Their interest is only in increasing their fortunes, not yours.
Sachin & Dhoni has nothing to lose. Gullible people who bought into this narrative betting their savings on things that they don't understand well will lose. (43/n)
Sachin & Dhoni has nothing to lose. Gullible people who bought into this narrative betting their savings on things that they don't understand well will lose. (43/n)
Warren Buffet's investment advice is generally good and applicable to US markets.
The NASDAQ index has tech companies innovating in every frontier possible and amassing huge wealth from all over the world. Do we have a single company like that in Sensex/Nifty? (44/n)
The NASDAQ index has tech companies innovating in every frontier possible and amassing huge wealth from all over the world. Do we have a single company like that in Sensex/Nifty? (44/n)
NASDAQ corrected itself by 34%. From its peak of 16057 in Nov-2021 to 10321 in Oct-2022.
Likewise, other US indices have corrected themselves by similar margins last year. (45/n)
Likewise, other US indices have corrected themselves by similar margins last year. (45/n)
When this easy money streak is over the markets will return to their true value. IMO, it has already begun.
If you still don't so, zoom into the AMFI AUM data plot. Looks like smart investors are getting out. What will Sensex look like when AUM becomes 35 lakh Cr? (46/n)


If you still don't so, zoom into the AMFI AUM data plot. Looks like smart investors are getting out. What will Sensex look like when AUM becomes 35 lakh Cr? (46/n)


For full disclosure: I have not bought or sold any mutual funds/index funds in the last 5 years.
Don't treat the thread as any investment advice. That's not my intention. The intention is to show you the big picture and make you think on your own. (47/n)
Don't treat the thread as any investment advice. That's not my intention. The intention is to show you the big picture and make you think on your own. (47/n)
If you find any issues in the data I shared, please point them out. Will be happy to fix it.
If you have arguments based on past data and other mutual funds' performance in the past, I don't have any arguments. I am talking about the future. (48/n)
If you have arguments based on past data and other mutual funds' performance in the past, I don't have any arguments. I am talking about the future. (48/n)
Disclaimer: My disclaimer is the combined disclaimers of all the mutual funds marketing materials out there :-)
Stop outsourcing thinking. Invest wisely, it's your hard-earned money!
(49/49)
Stop outsourcing thinking. Invest wisely, it's your hard-earned money!
(49/49)
• • •
Missing some Tweet in this thread? You can try to
force a refresh


