Lance Lambert Profile picture
Mar 25 4 tweets 1 min read
#NEW Ed Pinto at AEI reaffirms his national home price outlook:

“We project a cumulative [U.S. home price] decline from the Jun 2022 peak of -10% to 0%, and -5% to +5% by year end 2023 and 2024 respectively.”
Heading into the year, AEI was more bearish. But that changed as their outlook for mortgage rates got less bearish.
AEI has national prices up 1.2% MoM in Feb.

I don’t closely follow the AEI HPI readings. On their website, they call it “a quasi repeat sales index with a hedonic element.”
Unlike the Case-Shiller and ZHVI data I share frequently, the AEI HPA doesn’t appear to be seasonally adjusted.

• • •

Missing some Tweet in this thread? You can try to force a refresh
 

Keep Current with Lance Lambert

Lance Lambert Profile picture

Stay in touch and get notified when new unrolls are available from this author!

Read all threads

This Thread may be Removed Anytime!

PDF

Twitter may remove this content at anytime! Save it as PDF for later use!

Try unrolling a thread yourself!

how to unroll video
  1. Follow @ThreadReaderApp to mention us!

  2. From a Twitter thread mention us with a keyword "unroll"
@threadreaderapp unroll

Practice here first or read more on our help page!

More from @NewsLambert

Mar 26
Housing fundamentals matter 🏡

Housing markets with higher price-to-rent ratios had larger corrections in the second half of 2022.

chart via @AEI Image
AEI doesn't seasonally adjust its home price data. So these downward swings are larger than the ones I usually share.
When looking at "overvaluation" studies, you'll often see Western/Southern boomtowns with similar figures... but when looking at "price-to-rent ratios" you'll see the West was further detached from housing fundamentals
Read 4 tweets
Mar 25
Luxury will be the first segment of the national housing market to go negative on a year-over-year basis. In terms of price.

chart via @AEI
House prices don’t need further declines to go negative on a YoY basis… it just requires, at this point, hot spring ‘22 months dropping out of the 12-month window.
Read 4 tweets
Mar 25
A sidelined move-up buyer is often a sidelined seller 🏡
The decline in new listings was/is a hit to both supply and demand.
And that’s why active listings (inventory) is such a great metric: it helps to decipher where the balance between supply and demand is shifting
Read 8 tweets
Mar 24
Time in the housing market > timing the housing market 🏡
There’s a lot of truth to my top statement… but in some ways my comment is also tone deaf. Below is one example
Read 4 tweets
Mar 23
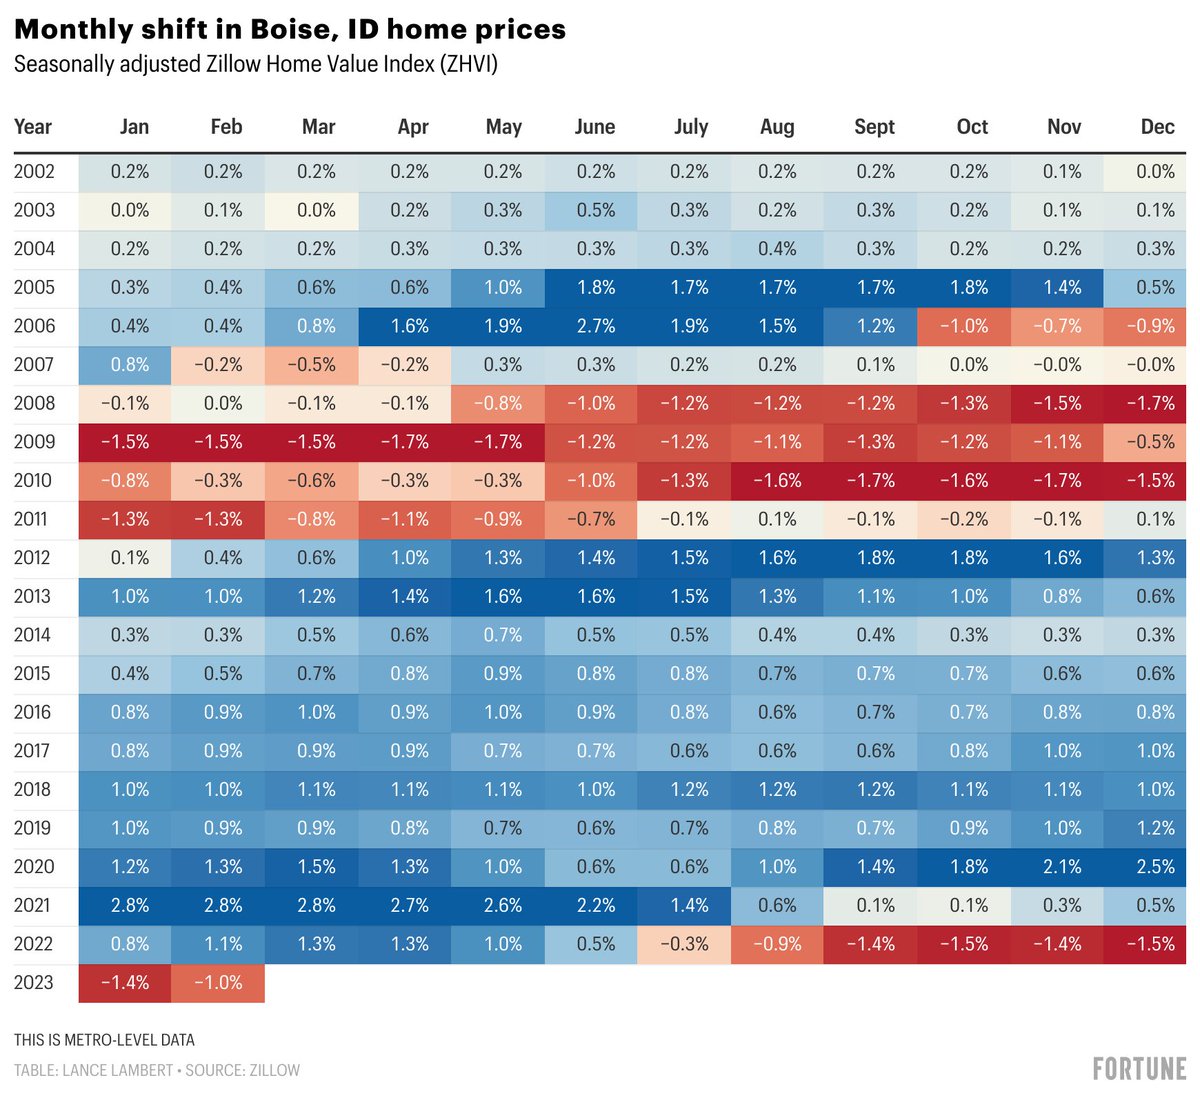
On a seasonally adjusted basis, Boise home values rose every single month between November 2011 (i.e. its bottom of the crash) through June 2022 (i.e. its Pandemic Housing Boom peak).

Since, Boise has posted 8 consecutive month-over-month declines. Image
On the earnings call yesterday, a KB Home's executive said Boise was still "adjusting"
Source for the data above: Seasonally adjusted Zillow Home Value Index (ZHVI)
Read 4 tweets
Mar 1
Looks like the Federal Reserve accidentally hit "Ctrl + Alt + Delete" on the U.S. housing market
this one comes via ChatGPT
Read 6 tweets

Did Thread Reader help you today?

Support us! We are indie developers!


This site is made by just two indie developers on a laptop doing marketing, support and development! Read more about the story.

Become a Premium Member ($3/month or $30/year) and get exclusive features!

Become Premium

Don't want to be a Premium member but still want to support us?

Make a small donation by buying us coffee ($5) or help with server cost ($10)

Donate via Paypal

Or Donate anonymously using crypto!

Ethereum

0xfe58350B80634f60Fa6Dc149a72b4DFbc17D341E copy

Bitcoin

3ATGMxNzCUFzxpMCHL5sWSt4DVtS8UqXpi copy

Thank you for your support!

Follow Us on Twitter!

:(