

For comparison - here (quoted tweet) is last year's thread,There are lots of similarities with observable weather patterns & model forecasts as the two threads pertain to a similar state of the global energy balance.

https://twitter.com/althecat/status/1506279118190567428?s=20


The most notable differemce with the 2023 Equinox is that ENSO (the La Nina/El Nino oscillation) is moving into neutral which could result in a reduction of tropical convection and therefore less precipitation. However that is not yet cpc.ncep.noaa.gov/products/analy…… twitter.com/i/web/status/1…


The rest of this THREAD will be devided into sections looking at large scale regions - but we will begin at a global scale perspective.
All the forecasts and satellite imagery in this thread was collected yesterday.
All the forecasts and satellite imagery in this thread was collected yesterday.
This model forecast shows the tropical belt globally which travels east to West and this thread will also take that approach. The data shown here is PWAT (atmospheric water which is a proxy for energy).
You can see atmospheric rivers radiating awat from the tropical belt moving… twitter.com/i/web/status/1…
You can see atmospheric rivers radiating awat from the tropical belt moving… twitter.com/i/web/status/1…
In theory a move into El Nino (caused by lower SSTs in the Eastern Pacific will suppress convection and therefore the overall quantity of water flow.
However because the atmosphere is warmer it can (and is) now holding a lot more water vapour so El Nino conditions may not in… twitter.com/i/web/status/1…
However because the atmosphere is warmer it can (and is) now holding a lot more water vapour so El Nino conditions may not in… twitter.com/i/web/status/1…
This chart shows the current global temperature anomaly as observerd for a zero hour model observation - i.e. current. The poles and northern parts of the (populated) northern hemisphere remain significantly warmer than reference climate data predicts.

This animation is from the EPS (ECMWF) global 46 day model forecast and it is the origin of the theme for this THREAD.
Water Water everywhere. As there is a lot of water in the atmosphere - and the overall quantity appears to be continuing to increase.
Water Water everywhere. As there is a lot of water in the atmosphere - and the overall quantity appears to be continuing to increase.
This chart shows the total forecast precipitation anomaly from the same model over 46 days. There are negative precipitation anomalies shown here in the Pacific - particularly in the area East of Papua New Guinea where SSTs are lower as seen in the ENSO oscillation data.

I.E. in this chart here.

With this top of mind we will move to our survey of regional and continental observations - beginning in the Eastern Pacific.
Here are the long range 46 day model precipitation anomaly chart - and the 16 day GFS rainfall model forecasts - the most signifcant element of which is the convection/rainfall suppression which you can see in red. However you can also see that there is still a lot of convection… twitter.com/i/web/status/1…


And here is the GFS PWAT 16 day model forecast which shows a continuation of the trend of atmospheric rivers which have been bringing flooding to the Western US - and driving extreme weather up through the central plains.
An important feature of the water saturated atmosphere over the past few years is what I call a traffic jam feature when it comes to jetstream water transport which is a key feature of #extremeweather outcomes. This chart shows a snapshot of jet stream winds over the North… twitter.com/i/web/status/1…

And this animation of IVWT (Integrated water vapour transport) GFS model 16 days shows how volatile this is. IVWT measured in kg/m/s is a measure of energy.
The transportation water speed is very high in the jetstream and travels very long distances - affecting the atmospheric… twitter.com/i/web/status/1…
The transportation water speed is very high in the jetstream and travels very long distances - affecting the atmospheric… twitter.com/i/web/status/1…
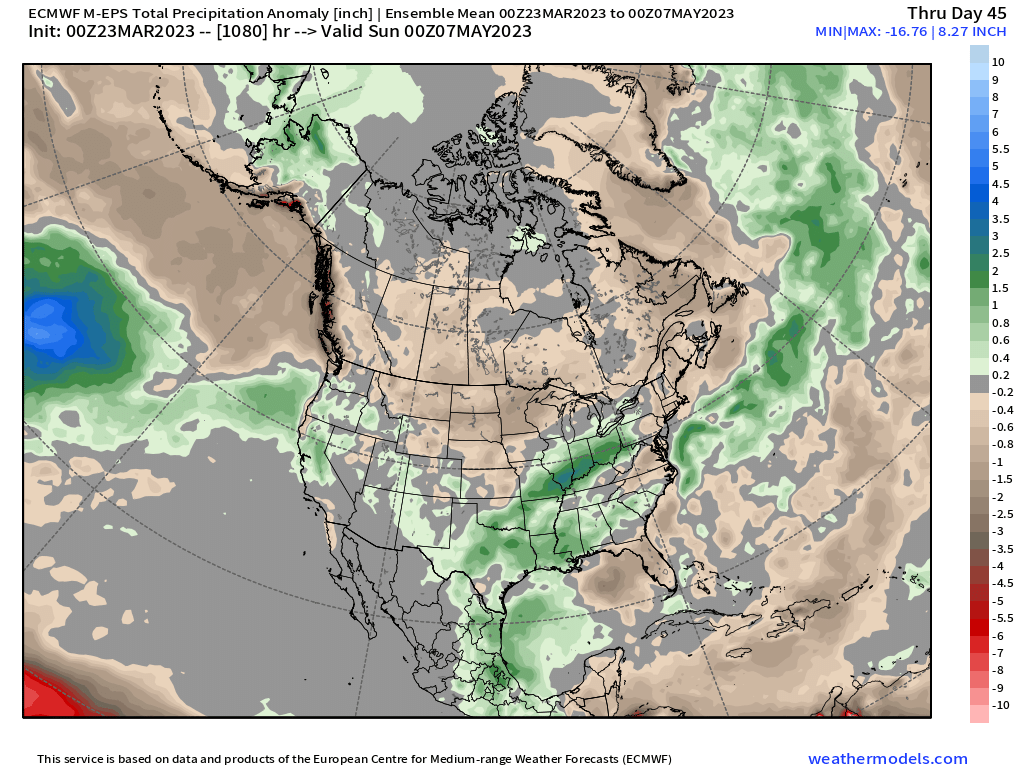
Moving to the North American continent we can see the impact of a persistent feature of water flow north east from the Pacific and the Caribean over the US.
The bit in yellow is part of the #extremeweather event that produced the recent Tornado in Missisipi that killed 23… twitter.com/i/web/status/1…
The bit in yellow is part of the #extremeweather event that produced the recent Tornado in Missisipi that killed 23… twitter.com/i/web/status/1…
In that first satellite animation you can see the source of the water flows very clearly - they come from the Eastern Pacific - but are likely also fed from the Gulf of Mexico & Carribean.
The 46 day model forecast EPS total rainfall anomaly map here shows that this atmospheric water super highway is expected to continue doing its thing.
And this is the predicted 16 day rainfall outcome from the pattern. More #extrremeweather and tornadoes are indicated.

In terms of forecasting extreme weather there are two charts which are most useful. The total PWAR anomaly forecast here provides a clear view of the predictions around Atmospheric Rivers which drive #extremeweather phenomena. Areas in blue can expect extreme precipitation.
The IWVT plot provides a more useful view of this. High energy atmospheric conditions are unstable. The bright reds and purples are the areas to watch out for.
The overlay of MLSP data allows you to also see what is driving the intensity and direction of the storms.
The overlay of MLSP data allows you to also see what is driving the intensity and direction of the storms.
Moving south to Central America here again are the long range 46 day precipitation anomaly and 16 day actual precipitation plots for the region. Notably the areas which show a negative precipitation anomaly here (Colombia and adjacent areas) are forecast to get very high… twitter.com/i/web/status/1…


Here we see the South American satellite imagery from yesterday - which provides an view of of the convection activity over the Amazon - one of the two lungs of the planet - which is the dominant feature in this region. You can also see the atmospheric rivers which exit the… twitter.com/i/web/status/1…
In this closeup of the Central American Isthmus you can see the flows of water up into the Gulf of Mexico which combine with the Pacfific water flows to deliver the #extremeweather events in the US.
Another voew of these water flows.
LHS: Pacific tropical water slows over Mexico and Texas
RHS: The curling flow of water up over Texas and the Missisipi delta which intensifies the overall water/energy balance.
LHS: Pacific tropical water slows over Mexico and Texas
RHS: The curling flow of water up over Texas and the Missisipi delta which intensifies the overall water/energy balance.
Heading south now to South America. This animation shows the massive importance of the two remaining great continental rainforests (noting there are also great forests in SEA) the interaction between the two is critical.
The Great African Rainforest produces massive flows in the east up over the horn of Africa and the Sahara into the Middle East (which we will return to at the end of this thread - and where some of the most dramatic #ClimateChangeNow is being experienced).
We begin again in looking at South America with the EPS precipitation anomaly (46 days EPS Model) and the modelled 16 day (GFS precipitation forecast) plots.


Again the ENSO movement into Neutral appears to show up in the tropical convection pattern we see here. But that said - the 46-day forecast is a bit experimental, and the overall atmospheric dynamics related to clouds and rainfall are not easy to model.
What is obvious however is that the massive loss of rainforest coverage over Brazil is resulting in less precipitation over South Eastern Brazil as per the climate reference data.
Here's the PWAT 16 day model run which contines to show massive westerly flows of atmospheric water being amplified over the Amazon.
In terms of its wider impact the flows of water north eastwards from South America are also massively impactful in Europe, the Middle East and… twitter.com/i/web/status/1…
In terms of its wider impact the flows of water north eastwards from South America are also massively impactful in Europe, the Middle East and… twitter.com/i/web/status/1…
Here the PWAT anomaly data shows a snapshot of the currently forecast atmospheric river activity.
And the IWVT model provides a clearer view of possible #ExtremeWeather events over the coming 16 days.
With Equinox having only just taken place, the overall energy balance remains in the Southern Hemisphere and the only current cyclone candidates on the planet are both situated in the south. The most threatening ones currently modelled are in the Eastern Indian Ocean threatening… twitter.com/i/web/status/1…
As we can see here the South Pacific remains volatile. Models are currently, (mercifully given the devastation wrought recently by cyclone Gabriel) forecasting a couple of near misses for Aotearoa New Zealand from intense atmospheric water flows.
Here are the EPS 46 day precipitation anomaly forecasts for Australia and NZ and the 16 day GFS precipitation forecasts. As previously noted in the short term Western Australia is currently in the firing line for an extreme weather event.


Here is the current satellite animation for Australia and NZ.
Australia has been on the front line in climate change of late, experiencing massive and persistent flooding for the past three years - especially in the Eastern populated areas - and here in the PWAT forecast you can see the buildup of unstable atmospheric conditions in the West… twitter.com/i/web/status/1…
This GEFS precipitation anomaly orecast shows the potentially affected areas. But it seems possible that areas in the Northern Territories and Gulf of Carpentaria could also be affected.
In the longer run an El Nino if it eventuates could bring this wet phase to a close however.
In the longer run an El Nino if it eventuates could bring this wet phase to a close however.

We will now move north to the Western Pacific & SEA which along with the two great forests is a primary driver of tropical water flows in Equatorial regions - and therefore of #extremeweather globally.
The main tropical flows travel very consistently throiugh Indonesia as you… twitter.com/i/web/status/1…
The main tropical flows travel very consistently throiugh Indonesia as you… twitter.com/i/web/status/1…
Here we see the broader West Pacific, which is not yet very active in #extremeweather terms in the tropics. That said there is a massive amount of water flowing Eastwards over the Himalayas which is causing some extreme weather now.
The modest convection we see over areas East of the Phillipines is ENSO related, but whether this will be maintained is not yet clear.
Here are the 46-day EPS and 16 day rainfall plots for the Western Pacific which show some significant rainfall in Southern China and Japan.
Here are the 46-day EPS and 16 day rainfall plots for the Western Pacific which show some significant rainfall in Southern China and Japan.


And there is nothing much to be be worried about here but for a current AR over Japan and burst of atmospheric water transiting Northern China and Korea.
But its important to understand that for now the atmospheric energy balance remains in the south - the cycloinie season is still a long way off. That said two of the PWAT complexes we see here look to me as if they could develop into disturbances.
As usual the IWVT plot gives us a clearer view of this and shows a low pressure circulation developing east of the Philippines towards the end of the forecast period.
This satellite animation shows the broader context of the easterly flows of water over the Himalayas - and a current storm over Afghanistan and Pakistan which is delivering some late winter snow.
On the RHS of this animation (posted earlier) you can see that storm in close up. It is possibly also responsible for the recent #extremeweather tornadoes in Punjab.
Here we have the EPS 46 day precipitation anomaly and GFS 16-day total precipitation plots for China which also include the Indian Subcontinent. These also show the impact - perhaps a little ominously - of the ENSO transition on spring rainfall over the Indian Subcontinent -… twitter.com/i/web/status/1…


But it is clear from these that the risk of the anticipated flip side of #extremeweather i.e. droughts is now on the table.
This animation shows the entire Indian Ocean.
This animation shows the entire Indian Ocean.
Over the next few months the ICTZ (Intertropical Convergence Zone - en.wikipedia.org/wiki/Intertrop…) will continue to move north eventually bringing the monsoons to SEA, India and East Africa.
The South Indian Ocean cyclone season is far from over however and the potential for more extreme weather here remains. In the short term two low pressure systems expected to develop over the Eastern Indian Ocean however have the effect of dampening the Westward tropical flows… twitter.com/i/web/status/1…
The two potential cyclonic systems - threatening Australia are more obvious in this IWVT graphic. At this point however they remain long range prognostications.


Moving North to India we can look a little bit deeper at the modelled rainfall preciputation anomalys over the Northern Indian Ocean - which are in both the EPS and GEFS models.


Here is the Nth Indian Ocean PWAT perspective.
& the quoted thread below shows the position at around the same time last year in terms of PWAT. On March 22nd last year there were significant flows of intense PWAT entering the Bay of Bengal.
& the quoted thread below shows the position at around the same time last year in terms of PWAT. On March 22nd last year there were significant flows of intense PWAT entering the Bay of Bengal.
https://twitter.com/althecat/status/1506293757758554115?s=20
Here is the current Indian PWAT Anomaly 16 day forecast which shows roughly neutral levels of PWAT. However what happens here over coming weeks may well be an indicator of what the impacts of the ENSO change could be.
Notwithstanding the recent tornadoes there is not a lot to be concerned about for now in the IWVT model forecast for the Indian Subcontinent.
Its too early to tell what the impact of ENSO neutral will be.
Its too early to tell what the impact of ENSO neutral will be.
Moving north now we will take a look at Eurasia - including Central Asia and Russia, the largest and least populated northern land mass.
Here are the current EPS 46 day precipitation anomaly and total precipitation plots for Asia.
As you can see continental Asia does not get a lot of rainfall - but it is getting more and more of late thanks to the strength of the Atmospheric Rivers being experienced in the… twitter.com/i/web/status/1…
As you can see continental Asia does not get a lot of rainfall - but it is getting more and more of late thanks to the strength of the Atmospheric Rivers being experienced in the… twitter.com/i/web/status/1…


Here is the GFS PWAT anomaly animation over 16 days.
The atmospheric rivers affecting central Asia originate for the most part in the Atlantic and the Amazon. Here is the raw PWAT animation also from the GFS model.
And the IWVT version. Notably in this data we can see that the largest of the Atmospheric Rivers in the forecast period is signiifcantly supplemented by waterflows coming north over the Arabian Peninsula from the Great African Forest.
This can be seen particularly clearly in this IWVT transport plot. The African water flows are also a major contributor to the eastward flows over india which are producing the heavy rain in China.

A brief meta observation about my personal #ClimateChangeNow #DesertRain weather observation Odyssey which began whilst closely observing rainfall patterns first in Ethiopia (in relation to the GERD Dam) and quickly moved to the Middle East. 1/2
Over the course of two years of observation 2021 and 2022 it became apparent that so called "Sahara Pump Theory" which relates to human migration out of Africa appears to be being confirmed by weather observable pheomena. 2/2
https://twitter.com/althecat/status/1477711382304989188?s=20
And the weather evidence of this is strengthening over time.
The theory points to the Levant and large parts of the Arabian Peninsula having been significantly wetter during periods of recent higher global temperatures and higher sea levels.
It has resulted over the past two… twitter.com/i/web/status/1…
The theory points to the Levant and large parts of the Arabian Peninsula having been significantly wetter during periods of recent higher global temperatures and higher sea levels.
It has resulted over the past two… twitter.com/i/web/status/1…
Here are the EPS 46 day Precipitation Anomaly - the current GFS precipitation forecast and the GFS 16 day Precipitation anomaly plots.
In the final of these images the blue denotes that any rainfall at all on the Arabian Peninsula - particularly in the South - is from a climate… twitter.com/i/web/status/1…
In the final of these images the blue denotes that any rainfall at all on the Arabian Peninsula - particularly in the South - is from a climate… twitter.com/i/web/status/1…


Here are the EPS 46 day Precipitation Anomaly - the current GFS precipitation forecast and the GFS 16 day Precipitation anomaly plots.
In the final of these images the blue denotes that any rainfall at all on the Arabian Peninsula - particularly in the South - is from a… twitter.com/i/web/status/1…
In the final of these images the blue denotes that any rainfall at all on the Arabian Peninsula - particularly in the South - is from a… twitter.com/i/web/status/1…

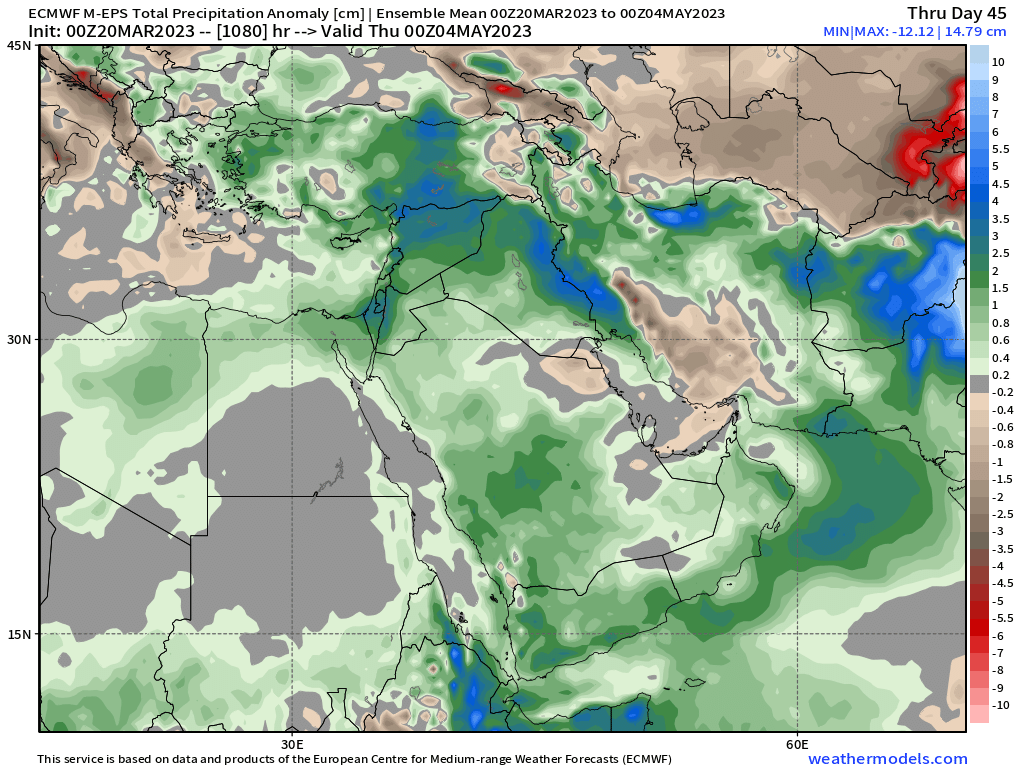

You can see this even more clearly in an animated version of this over 16 days.
Here is a 16 day PWAT model forecast for the Middle East.
And a PWAT anomaly model forecast.
And the IWVT version - in these last two images you can see that a lot of water is passing over the region and not resulting in rain.
Based on my observations over the past two years the climate change drivers of this phenomena appear to be strengthening.
Based on my observations over the past two years the climate change drivers of this phenomena appear to be strengthening.
CAPE or Convective Available Potential Energy is the amount of fuel available to a developing thunderstorm. This is the corresponding CAPE model forecast for the period in question. Given the intensity of this in Spring, the potential for even more and larger thunderstorms over… twitter.com/i/web/status/1…
And in #ExtremeWeather terms the impact of these storms is huge. Cars and trucks are routinely swept away. Roads and cities flooded and on at least one occasion (in 2021) cars were swept away in the streets of Makkah by flash flooding. All Middle Eastern countries have been… twitter.com/i/web/status/1…
The penultimate region addressed in this THREAD before the North/Tropical Atlantic and Europe. is Africa.
Here we have the 46 day precipitation anomaly model forecasts from EPS as well as two current 16-day GFS rainfall forecasts for Africa.


This animation shows convective activity in West Africa yesterday.
And East Africa including the Horn of Africa.
The #extremeweather rainfall in Somalia and parts of Ethiopia at present has been destructive - but in the south and east is also relieving a long running drought.
Here are the current ECMWF GFS and KMA rainfall forecasts for Ethiopia. This rain will be helping kick off what… twitter.com/i/web/status/1…
Here are the current ECMWF GFS and KMA rainfall forecasts for Ethiopia. This rain will be helping kick off what… twitter.com/i/web/status/1…

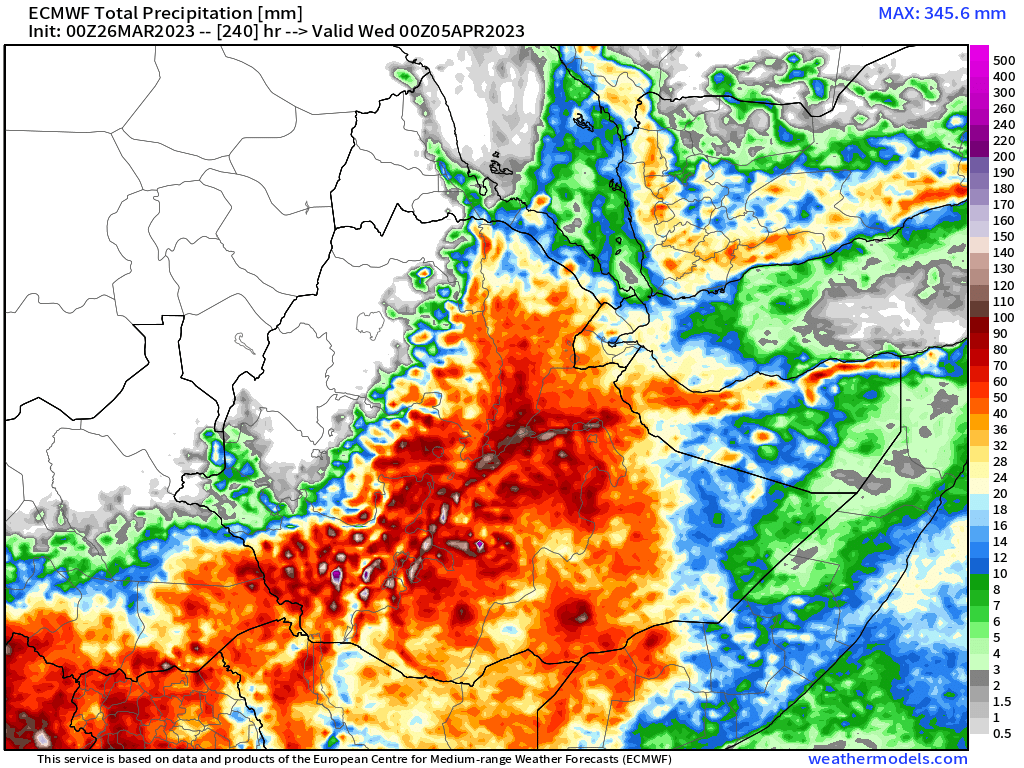


The Africa Rainflall anomaly shown here appears to be particularly impactful in the horn of Africa including over Sudan. But it looks as if it should also bring early rains in the sahel.
Here's the PWAT forecast for Africa which shows signiifcant levels of moisture over the southern Sahel. The peaking spouts you see on the northern boundary of the PWAT indicate the northwards moving monsoon is producing atmospheric rivers heading towards Europe and the Middle… twitter.com/i/web/status/1…
And finally for Africa here's the IWVT picture which for now at least contains no hazardous features.
The final part of this mammoth thread addresses my neighbourhood. The Atlantic Ocean and Europe where I live. This winter has been unusually mild for Winter - due to warm atmospheric rivers originating in the tropics. Most spectacularly over New Years itself I recall standing… twitter.com/i/web/status/1…
In this animation you can see the broader situation. Most of Europe's weather comes in from the North Atlantic - including from large ARs orginating in South America and the Tropical Atlantic - so this is where we shall begin.
An increasingl important feature is ARs coming in over the Sahara including this one which originates in West Africa.
Here's a current view of Western Europe where I am where the prevailing direction of weather is strongly from the South West and dominated by ARs (atmospheric rivers) originating in the Tropical Atlantic.
That said the North Atlantic is competing with the tropical flows bringing down cold air which over the winter often found itself surrounded by warm wet air leading to rain and snow.
At the moment we have a warm wet air mass over Europe which is forecast to produce a large amount of rain over the coming 16 and 46 days. Which will be welcome as it means last year's extreme drought conditions do not appear to be returning. (touch wood).


Here we see the GFS forecast PWAT anomaly animation in which you can see how incoming warm water flows are also bringing warmth.
Here is the raw PWAT data which as you can see is not particularly intense, yet. Over the course of the warming of the Northern Hemisphere this will however most likely get significantly wetter - creating lots of cloud cover and rain.
This animation shows the dominant influence over all this - an endless series of ARs generated in the Amazon and Carribean.
As spring turns to summer these will likely intensify, but as with other tropics based phenomena, if the ENSO transition into El Nino occurs this will moderate it.
This animation provides the best explanation for weather forecast reliability issues many Europeans are now familiar with.
Even though the atmosphere is not yet particularly wet, it is wet enough that it is already producing the meandering jetstream water transport patterns… twitter.com/i/web/status/1…
Even though the atmosphere is not yet particularly wet, it is wet enough that it is already producing the meandering jetstream water transport patterns… twitter.com/i/web/status/1…
The Jetstream winds are only a fraction of the water vapour transport mechanisms however. The IWVT model integrates multiple different layers of atmospheric water movement at varying altitudes.
This event beginning Wednesday and running till Friday will likely result in modest (by global standards) #extremeweather over the English Channel and France.
Unfortunately in coincides with a ferry journey for me to blighty.
Unfortunately in coincides with a ferry journey for me to blighty.
/ends
@Threadreaderapp unroll
@Threadreaderapp unroll
• • •
Missing some Tweet in this thread? You can try to
force a refresh


