At the request of @nas9860, @lrishConservNat and others, here's the estimated 2004 #Alaska U.S. Senate result by the 30 current county equivalents (boroughs & census areas). @lisamurkowski won 48-45 after a recount.
Again, this is an ESTIMATE using the traditional method to...
Again, this is an ESTIMATE using the traditional method to...

...allocate absentees to precincts. 2004 had a bunch of weird multi-HD early/?/ABS vote types, making this a bit more difficult than usual to decipher.
Here's the chart itself, if that's too small to decipher. Anchorage was more or less average for the state.
Here's the chart itself, if that's too small to decipher. Anchorage was more or less average for the state.

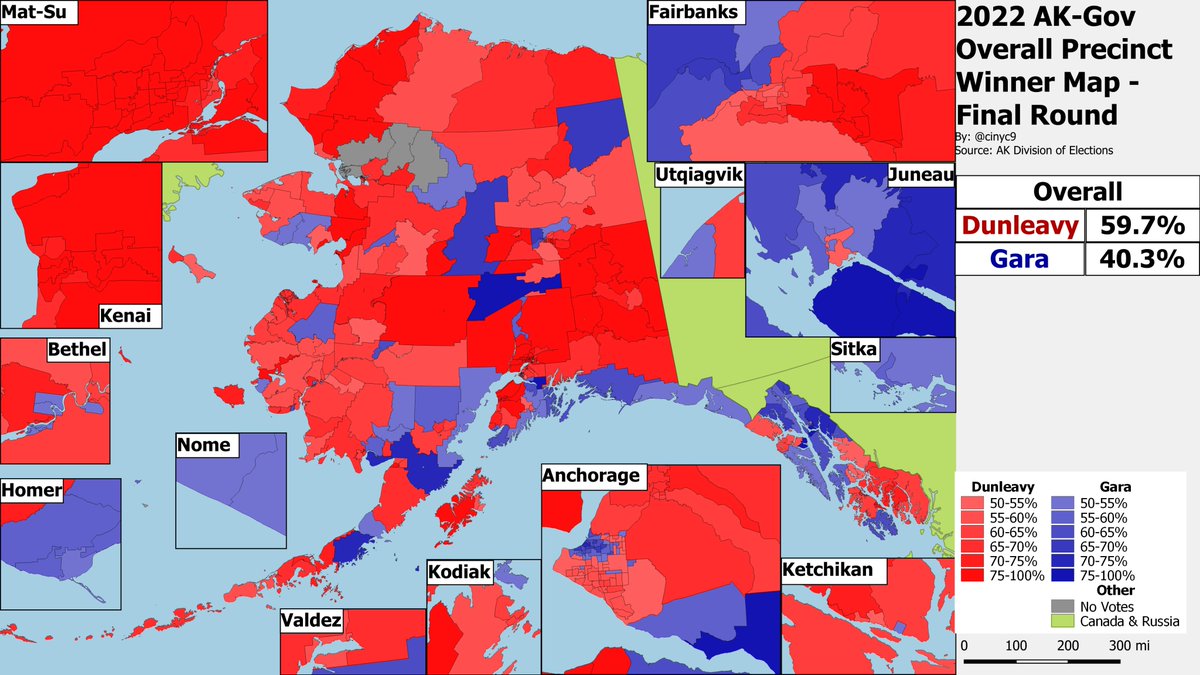
ESTIMATED precinct winner map, including the absentee/question/early votes.
This is from the VTD shp, so borders might not be 100% accurate. Prudhoe Bay had an actual voting precinct this cycle!
@alaskanrobby @WillMuldoon @AK_OK @Phrozen_ @leahwrenn @thc1972 @tomhewittnews
This is from the VTD shp, so borders might not be 100% accurate. Prudhoe Bay had an actual voting precinct this cycle!
@alaskanrobby @WillMuldoon @AK_OK @Phrozen_ @leahwrenn @thc1972 @tomhewittnews

@alaskanrobby @WillMuldoon @AK_OK @Phrozen_ @leahwrenn @thc1972 @tomhewittnews As I've said 3 times, this is an ESTIMATE using the traditional method to allocate the early/absentee/question votes to precincts. AK doesn't separately break these out. Thus, we can only guess. The MoEs in smaller census areas are higher. They prob didn't early vote there, but..
...I allocated some votes to them anyway, as the traditional method requires.
ESTIMATE. ESTIMATE. ESTIMATE.
FYI - @JMilesColeman @Thorongil16 @XNeonXO @DrewSav @Shane_maps @orcasaccount @RRHElections - and whomever else has asked for this in the past or wants to see it.
ESTIMATE. ESTIMATE. ESTIMATE.
FYI - @JMilesColeman @Thorongil16 @XNeonXO @DrewSav @Shane_maps @orcasaccount @RRHElections - and whomever else has asked for this in the past or wants to see it.
• • •
Missing some Tweet in this thread? You can try to
force a refresh

 Read on Twitter


