My guide to calculating study-level statistical power for meta-analyses using the 'metameta' #Rstats package and web app is out now in AMPPS 🔓 doi.org/10.1177/251524…
Here's how this tool can be used for your next meta-analysis OR for re-analysing published meta-analyses 🧵
Here's how this tool can be used for your next meta-analysis OR for re-analysing published meta-analyses 🧵


There's been a lot of talk recently about the quality of studies that are included in meta-analyses—how useful is a meta-analysis if it's just made up of studies with low evidential value?
https://twitter.com/GidMK/status/1641291679096512514?s=20
But determining the evidential value of studies can be hard. Common approaches for looking at study quality or risk of bias tend to be quite subjective. You're not likely to get the same conclusions from different authors. These tasks can also be quite time consuming.
One objective approach for determining evidential value is to calculate the statistical power of a study, or to put it more precisely, the statistical power of a study design and statistical test combination
The larger the sample size, the wider the range of effect sizes that you can reliably detect. Studies with a design/test combination that cannot reliably detect a wide range of effect sizes are more susceptible to questionable research practices and exaggerated effect sizes

This means that a meta-analysis that contain a body of studies that cannot reliably detect effect sizes of interest may not be very informative
SIDE NOTE 1: One oft-mentioned strength of meta-analysis is that you can achieve sufficient statistical power if you include enough studies. But you need A LOT of studies for this to work, especially if you have high heterogeneity, which is typically the case >

SIDE NOTE 1 (continued): For this approach to work, you also need to assume that all small studies were pre-planned and there's a commitment to publish ALL OF THEM regardless of statistical significance (e.g., Registered Reports), but this is rare in practice
SIDE NOTE 2: One feature of meta-analysis is that it penalises studies with higher variance (i.e., lower power) when calculating summary effect sizes. But this only attenuates the influence of studies that have larger variances *relative* to other studies in the meta-analysis >
SIDE NOTE 2 (continued): So this may help if you have one underpowered study among many appropriately-powered study, but this doesn't do much if most studies are underpowered
Ok, back to the main thread...
So you *could* calculate statistical power for each study included in a meta-analysis, but this adds more time to an already long process
So you *could* calculate statistical power for each study included in a meta-analysis, but this adds more time to an already long process
https://twitter.com/dsquintana/status/1313521406563553281?s=20
Another related issue is deciding the hypothetical effect size of interest used in power calcs. It’s impossible to determine the "true" effect size. Many people use Cohen’s thresholds, but he only suggested these as a fallback when you're aware of the distribution of effects
A better approach is to figure out the effect size distribution for a given research field for more accurately determining what constitutes a small, medium, or large effect size. I've done this, but it can take time onlinelibrary.wiley.com/doi/abs/10.111… (Preprint: doi.org/10.1101/072660)


By the way, we’re working on a tool to make the generation of effect size distributions really easy 🤫
A common sense solution for determining the effect size for power calculations is to use the summary effect size from a meta-analysis. But these effects tend to be inflated due to publication bias
Rather than choosing a single hypothetical effect size of interest, a better approach is to calculate statistical power for a range of effect sizes. At a glance, you determine the effect sizes that can be reliably detected for a given study design/test combo
So for example, this design (paired samples study with 40 participants) and statistical test (paired t-test with alpha at .05) combination can reliably detect effects of 0.45 or larger (assuming 80% power is "reliable")

So in summary we have two problems:
1) Calculating statistical power for each study in a meta-analysis is time consuming
2) Conventional power analysis approaches require you to choose a single effect size of interest
1) Calculating statistical power for each study in a meta-analysis is time consuming
2) Conventional power analysis approaches require you to choose a single effect size of interest
I tried solving this by creating a custom function and visualisation in a paper I wrote in 2020 doi.org/10.1016/j.cpne… But I noticed that a few people had started using this code for other research fields, which was great to see! Another reason to share your code, by the way...

Based on this interest, I decide to create a package, so the 'metameta' idea was born.
SIDE NOTE 3: The name derives from the fact that the original motive for developing the package was pooling data from several meta-analyses, but it's just as useful for individual ones
SIDE NOTE 3: The name derives from the fact that the original motive for developing the package was pooling data from several meta-analyses, but it's just as useful for individual ones
With the metameta package, you can calculate study level statistical power by inputing data that is commonly reported in meta-analysis: effect sizes and variance (either standard error or 95% CIs)


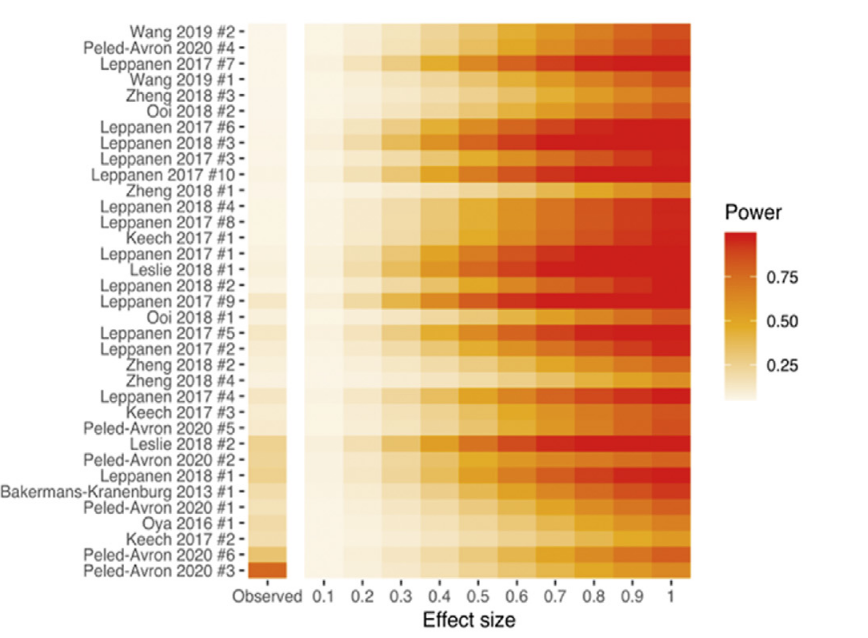
With this info, the metameta package calculates power for a range of effect sizes and visualises this in a Firepower plot. The default is 0.1 to 1, but this can be changed. It also included the "observed" (i.e., the meta-analysis summary effect size) for reference

The function for calculating study-level statistical power is pretty straightforward. As well as providing generating a Firepower plot, the package also outputs raw data (i.e., power for range of effect sizes)

If you're not confident with R, I've made a companion web app dsquintana.shinyapps.io/metameta_app/

I also made a screencast video that walks you through how to use the package
https://twitter.com/dsquintana/status/1546479544382767106?s=20
It's also easy to integrate this when reporting novel meta-analyses. if you're using the 'metafor' package, for instance, you just need to convert variances into standard errors by calculating the square root of the variances
dat$sei <- sqrt(dat$vi)
dat$sei <- sqrt(dat$vi)
While extracting meta-analysis data (rather than data from individual studies) can save you time, this assumes that the original meta-analysis didn't make any errors, which is one potential drawback of this approach. Double-check especially large effect sizes!
Future plans for the package include the development of a Forestfire plot, which would combine a Fireplot plot with a forest plot
Here's a ten-minute talk on the 'metameta' package for the 2023 Evidence Synthesis and Meta-analysis in R conference #ESMARConf2023
• • •
Missing some Tweet in this thread? You can try to
force a refresh