Dan Quintana Profile picture
Associate Professor of Psychology @UniOslo | Behavioral neuroendocrinology, psychophysiology & meta-science | @hertzpodcast producer/co-host
5 subscribers
Feb 14 4 tweets 2 min read
“Underpowered to detect what?” should be the first question to anyone who says a “study” is underpowered journals.sagepub.com/doi/10.1177/10…
Image And here's your annual reminder that a "study" cannot be underpowered, but rather, a *design and test combination* can be underpowered for detecting hypothetical effect sizes of interest towardsdatascience.com/why-you-should…
Mar 30, 2023 29 tweets 9 min read
My guide to calculating study-level statistical power for meta-analyses using the 'metameta' #Rstats package and web app is out now in AMPPS 🔓 doi.org/10.1177/251524…

Here's how this tool can be used for your next meta-analysis OR for re-analysing published meta-analyses 🧵 There's been a lot of talk recently about the quality of studies that are included in meta-analyses—how useful is a meta-analysis if it's just made up of studies with low evidential value?
Jun 28, 2022 7 tweets 2 min read
Lots of replies and quote retweets to this paper along the lines of, “LoL PSyChoLoGy”, so here are two thoughts on this…

1. I’m glad the field is generally mature enough to actually recognize there’s a problem. Not all fields (or psychology subfields) can say this When I was an undergraduate psychology student there was no discussion of this—all the studies we were taught just worked 🪄
Jun 24, 2022 5 tweets 3 min read
“Nearly 100% of published studies… confirm the initial hypothesis. This is an amazing accomplishment given the complexity of the human mind and human behaviour. Somehow, as psychological scientists, we always find the expected result; we always win!” royalsocietypublishing.org/doi/10.1098/rs… Image One thing I want to add: the psychological sciences need to broadly adopt practices that help us determine when we're wrong. The standard NHST p-value approach cannot be used to provide support for absence of an effect. This paper provides two solutions academic.oup.com/psychsocgeront…
Oct 24, 2021 20 tweets 8 min read
Here are the answers for yesterday’s mini-quiz and a little info on each of these psych studies 🧵 1. The bottomless soup bowl study 🍜🍜🍜🍜

Participants who ate soup from bowls that were refillable, unbeknownst to them, ate 73% more soup than those eating from normal bowls pubmed.ncbi.nlm.nih.gov/15761167/

Here is Brian Wansink with the refillable bowl ⬇️ Image
Apr 23, 2021 30 tweets 11 min read
New preprint 🎉

Oxytocin receptor (OXTR) expression patterns in the brain across development osf.io/j3b5d/

Here we identify OXTR gene expression patterns across the lifespan along with gene-gene co-expression patterns and potential health implications

[THREAD] So, let's begin with some background.

As well as being an oxytocin researcher I'm also a meta-scientist, which means that a lot of my work on improving research methods is focused on improving oxytocin research (that's what got me into meta-science in the first place)
Mar 6, 2021 4 tweets 1 min read
I wonder if non-fungible tokens (NFTs) could be used as a kind of prediction market for research studies that will be considered ‘classics’ in the future?

This could maybe motive more robust work? And you’re wondering what the heck an NFT is, here’s an explainer

vox.com/the-goods/2231…
Oct 9, 2020 5 tweets 4 min read
This paper has been cited 1163 times, except it DOES NOT EXIST.

This 'paper' was used in a style guide as a citation example, was included in some papers by accident, and then propagated from there, illustrating how some authors don't read *titles* let alone abstracts or papers I learnt this from reading this super interesting book from @GarethLeng and @RhodriLeng mitpress.mit.edu/books/matter-f…
Sep 28, 2020 33 tweets 11 min read
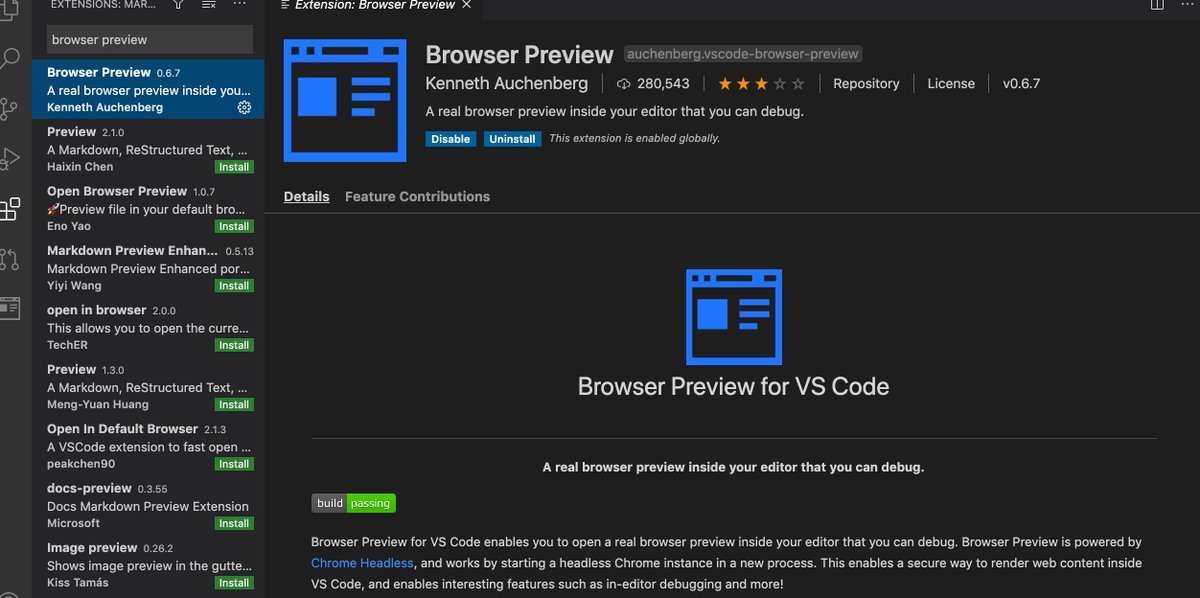
If you’re an academic you need a website so that people can easily find info about your research and publications. Here’s how to make your own website for free in around an hour [UPDATED 2020 THREAD] This is the third annual edition of my thread tutorial. The big change for this year is that now I use Visual Studio Code (@code) instead of Rstudio. When I first starting making this updated tutorial with Rstudio I kept running into problems, so that's why I changed.
Aug 26, 2020 5 tweets 1 min read
I'm taking a break from my own grant application by assessing other grant applications, because I'm a nerd like that. Doing this is providing a good reminder of the benefit of leaving some white space and including plenty of figures in my own application Personally, I aim to have at least ONE object per page. This object could be either be a figure, text box, or table.
Aug 17, 2020 4 tweets 3 min read
Our new paper describing recent advances in the field of intranasal oxytocin research has just been published in
@MolPsychiatry 🎉 rdcu.be/b6jO2

We outline why we think intranasally administered oxytocin reaches the brain & highlight the work that needs to be done ⬇️ ImageImage Was a pleasure working with Alex, @sallyagrace, @DirkScheele85, Yina, and @bn_becker on this paper, which we first proposed over a few beers at conference last year 🍻

The final paper was version 72 of the manuscript Image
Aug 12, 2020 4 tweets 1 min read
When you find a few typos in your manuscript proof 😬 ALSO: Get yourself co-authors that carefully go through proofs and find typos you totally missed
Aug 9, 2020 5 tweets 1 min read
Double-blind peer review is rare in my field but even if it wasn’t I don’t think it would be effective as it’s pretty easy in small fields to figure out the authors based on the research questions and methods alone I recently got a peer review request with just an abstract and I was able to guess the authors, which was confirmed when I agreed and got full access to the paper
Aug 7, 2020 8 tweets 3 min read
Including a power contour plot in methods sections of papers would drastically improve the interpretation of results.

Here's why... Image Let's say you designed your study and paired-samples t-test to reliably detect an effect size δ = 0.3.

Maybe that's the minimally interesting effect size? Maybe that's all you can afford? That's beyond the point for now, but check out @lakens on this daniellakens.blogspot.com/2020/08/feasib…
Aug 5, 2020 4 tweets 1 min read
We need an evidence pyramid for evidence pyramids This thread has some absolutely BONKERS evidence pyramids, so have a scroll through if you're in need of a laugh
Jul 19, 2020 4 tweets 2 min read
Testing for baseline differences in randomized controlled trials: an unhealthy research behavior that is hard to eradicate ijbnpa.biomedcentral.com/articles/10.11… Here's the motivation behind this paper. The next time reviewers twist their arm they can cite this paper. Sometimes I think reviewers respond better to an argument that is "peer reviewed" (especially if it's a field-specific paper) rather than one that's outlined in a response Image
Jul 14, 2020 16 tweets 6 min read
I just released my first #Rstats package 📦

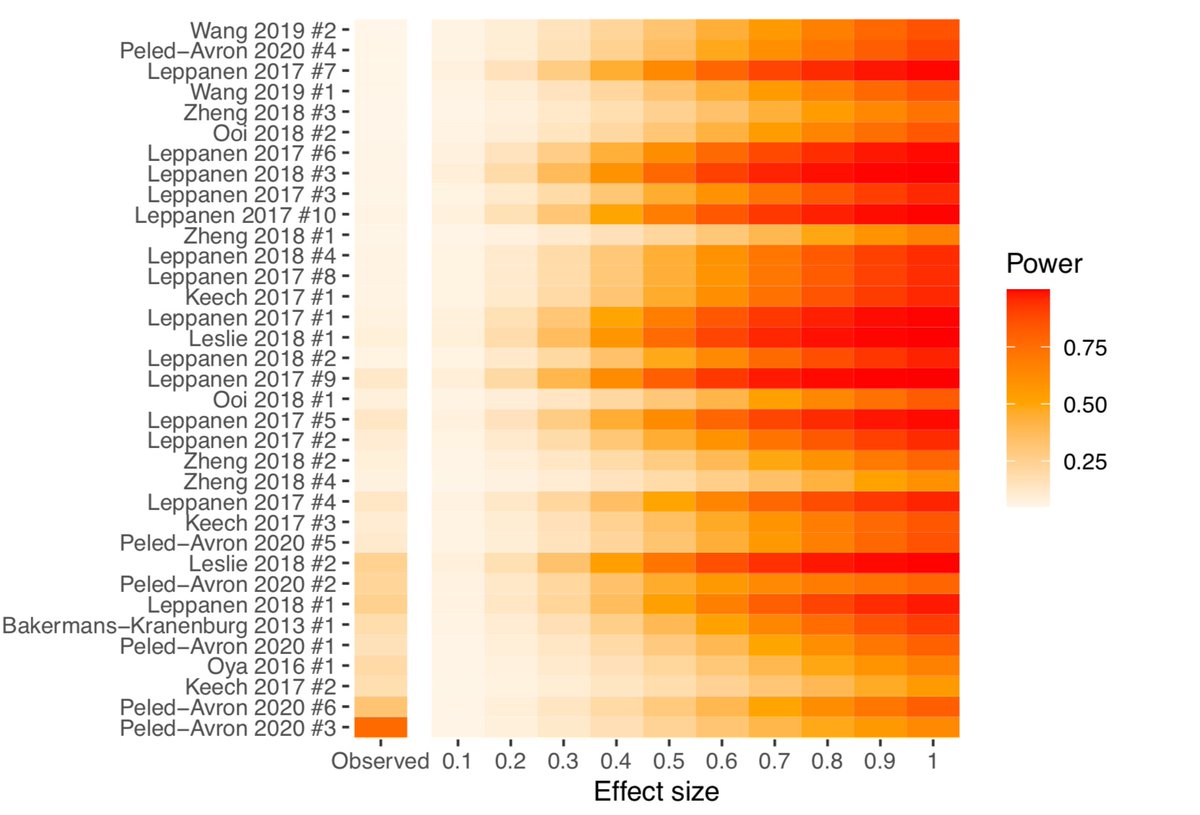
Here's a quick rundown on how you can use the {metameta} package to effortlessly calculate the statistical power of published meta-analyses to better understand the evidential value of included studies

github.com/dsquintana/met… Image First we'll install the package via Github and then load it.
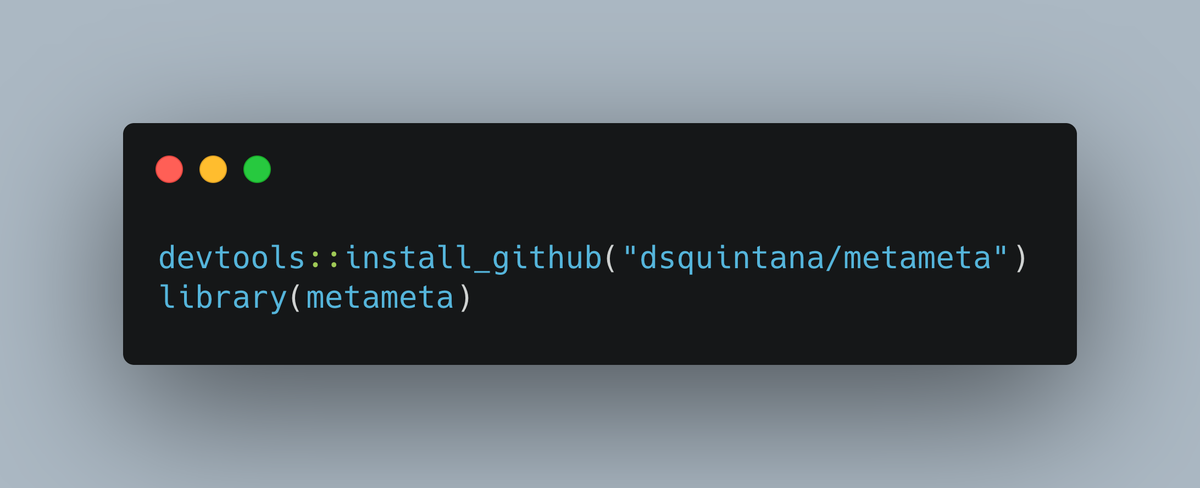
The package contains two main features:
1. Functions to calculate the statistical power of studies in a meta-analysis

2. A function to create a Firepower plot, which visualises statistical power across meta-analyses Image
Jul 9, 2020 10 tweets 5 min read
New preprint: Most oxytocin administration studies are statistically underpowered to reliably detect (or reject) a wide range of effect sizes psyarxiv.com/kzp4n/

Here's what I found and how I did this analysis... ImageImageImageImage Most folks are aware that oxytocin administration studies are underpowered, but the paper that's usually cited for this was published in 2015, which analysed studies from 3 meta-analyses published in 2012 & 2013 ncbi.nlm.nih.gov/pmc/articles/P…

I wanted to see if things have improved
Jul 3, 2020 5 tweets 2 min read
I'm trying to visualise the number of expected (green dots) vs. observed sig results (red dots) in sets of studies. Here, I've marked the three sets of studies with significantly *more* sig effects than you'd expect

How can I improve this plot?

BONUS POINTS: Show me an example Image I'm hesitant about this plot because it makes the top set of studies look "worse" just because it happens to have more studies. A ratio would be more accurate, but I think it's important to also show the raw numbers.
Jul 3, 2020 4 tweets 1 min read
The monkey was animal that the FEWEST people selected in yesterday's poll, replicating the result from the same poll I ran about a year ago. Image This is poll is an example of a reverse Keynesian beauty contest en.wikipedia.org/wiki/Keynesian…
Jun 24, 2020 29 tweets 9 min read
In my new blogpost, I walk through a way to determine the evidential value of studies in a meta-analysis—by calculating and visualising the power of each study via the {metaviz} #Rstats package.

dsquintana.blog/meta-analysis-…

Scroll down for this blogpost in thread-form ⬇️ Before we go on, let me first clarify that it's not a "study" that has statistical power, but rather a specific design and a test from a study. I only refer to this as a "study" as this is how we tend to think of meta-analyses—a synthesis of different studies

Let's continue...