Using #Census2021 data, we’ve analysed housing characteristics at a dwelling level in England and Wales and compared how this has changed over the last ten years.

There were 26.4 million dwellings in 2021 - compared with 24.4 million in 2011.

➡️ ons.gov.uk/peoplepopulati… Graphic with text:  26.4    million dwellings in England and
Of all dwellings:

▪️ 24.9 million were in England (up 8.5% since 2011)
▪️ 1.5 million were in Wales (up 6%)

There were also more unoccupied dwellings in England & Wales in 2021. Use our interactive map to explore unoccupied dwellings in your local area.
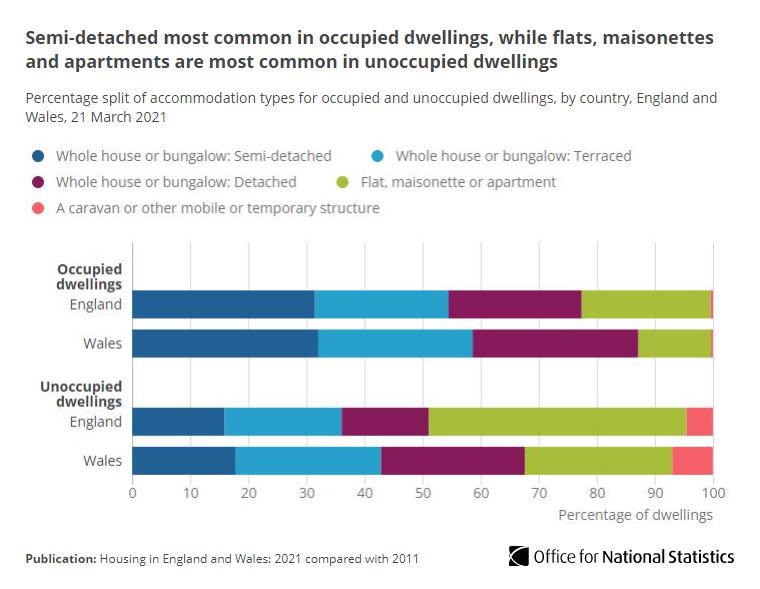
Semi-detached housing was the most common occupied dwelling in 2021.

Flats, maisonettes and apartments were most common in unoccupied dwellings. Semi-detached most common in occupied dwellings, while flats
By 2021, “owned outright” overtook “owned with a mortgage or loan” as the most common tenure type of dwellings in England (32.6%).

Outright ownership was the most common tenure in Wales (38%), consistent with 2011. There was a higher proportion of occupied dwellings that wer
Privately rented dwellings saw the biggest increase in both England & Wales in 2021.

Privately rented dwellings increased by:

▪️ 3.7 percentage points to 20.4% in England
▪️ 2.9 percentage points to 17.0% in Wales Privately rented dwellings had the biggest increase since 20
At a local level, the largest change for outright ownership was Tamworth in West Midlands, (33.3% in 2021, 27.8% in 2011).

City of London saw the largest increase in the percentage of private rented dwellings (48.4% in 2021, 35.9% in 2011). No local authorities had a decrease.

• • •

Missing some Tweet in this thread? You can try to force a refresh
 

Keep Current with Office for National Statistics (ONS)

Office for National Statistics (ONS) Profile picture

Stay in touch and get notified when new unrolls are available from this author!

Read all threads

This Thread may be Removed Anytime!

PDF

Twitter may remove this content at anytime! Save it as PDF for later use!

Try unrolling a thread yourself!

how to unroll video
  1. Follow @ThreadReaderApp to mention us!

  2. From a Twitter thread mention us with a keyword "unroll"
@threadreaderapp unroll

Practice here first or read more on our help page!

More from @ONS

Mar 31
We've brought together recent data and insights relating to the rising #CostOfLiving 🧵⬇️

The annual inflation rate (including owner occupiers’ housing costs) rose from 8.8% to 9.2% between January and February 2023 📈

➡️ ons.gov.uk/economy/inflat… Follow our thread for the l...
The prices of food and non-alcoholic drinks rose at the fastest rate in more than 45 years in the 12 months to February 2023🛒

The annual inflation rate in this category was 18.2%, up from 16.8% in the year to January 2023.

➡️ ons.gov.uk/economy/inflat… Line charts showing annual ...
Between 1997 and 2022, housing has become less affordable in every local authority, and the share of local authorities with an affordability ratio below 5 times workers’ earnings has fallen from 89% to 7% 🏠

➡️ ons.gov.uk/peoplepopulati…
Read 7 tweets
Mar 31
GDP is estimated to have grown by a revised 0.1% in Quarter 4 (Oct to Dec) 2022.

Up from an initial estimate of 0.0% growth.

➡️ ons.gov.uk/economy/grossd… Bar chart showing revised e...
Commenting on today’s revised GDP figures, ONS Director of Economic Statistics Darren Morgan said: (1/3) ⬇️ The economy performed a lit...
Darren Morgan continued: (2/3) ⬇️ Households saved more in th...
Read 5 tweets
Mar 30
Latest economic activity and social change data shows the estimated demand for fuel per transaction was 5 percentage points above the level in the previous week ⛽

12 percentage points above the level seen in the equivalent week of 2022.

➡️ ons.gov.uk/economy/econom… Economic activity and social change in the UK, real-time ind
According to @Springboard_ weekly retail footfall in the week to 26 March 2023 was:

🛍️ 97% of the previous week
🛍️ 80% of the equivalent week of 2019 Multiple small line charts showing overall retail footfall w
The System Average Price of gas fell by 12% in the week to 26 March 2023, according to National Gas Transmission 🔥

This is:
▪️ 55% below the equivalent week of 2022
▪️ 79% below the peak level recorded on 28 August 2022
▪️ the tenth consecutive week-on-week decrease Line chart showing  the System Average Price (SAP) of gas de
Read 4 tweets
Mar 30
There were 824,983 conceptions for women of all ages in England and Wales in 2021.

At the time of the #COVID19 pandemic when lockdowns and restrictions may have affected behaviours, this is the first increase seen in the last six years.

➡️ ons.gov.uk/peoplepopulati… The number of conceptions rose for the first time in six yea
Women aged 30 to 34 years had the highest number and conception rate for the fifth year in a row.

This age group also had the lowest percentage of conceptions leading to abortion.
The latest data suggests that for the first time since records began, women outside of marriage or civil partnership have a higher conception rate than those within marriage or civil partnership.

This may be an effect of the differences in population estimates used. Women over the age of 25 saw an increase in conception rates
Read 4 tweets
Mar 30
Latest analysis on how the rise in the #CostOfLiving and difficulty accessing NHS services have impacted people’s lives in Great Britain (15 to 26 February 2023)

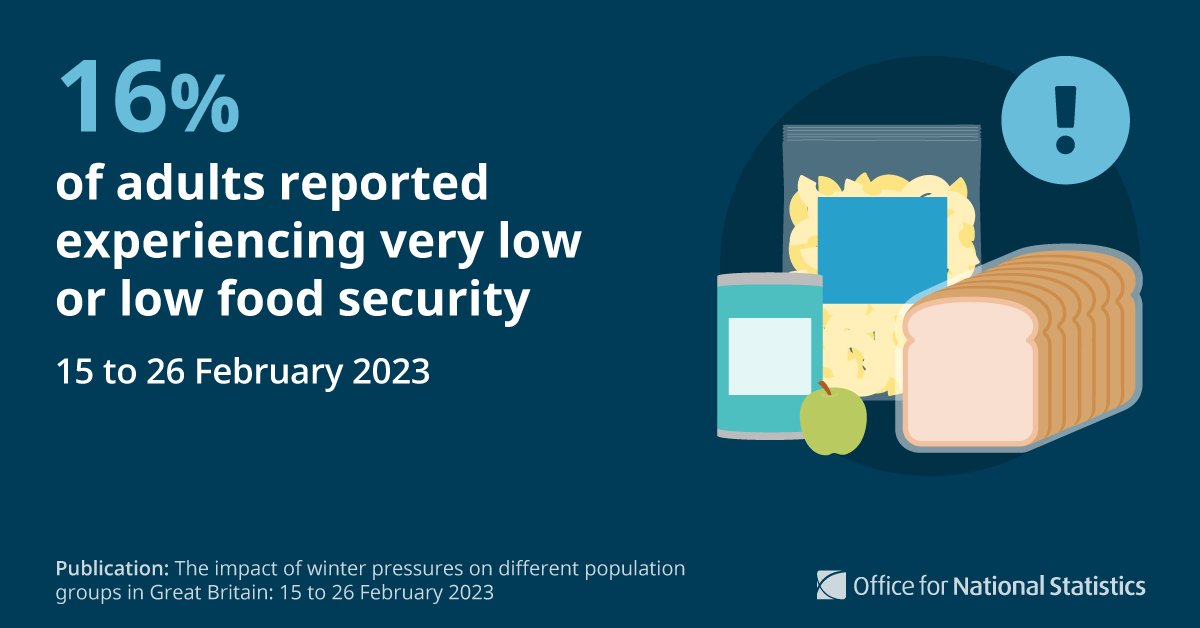
16% of adults reported experiencing very low or low food security🍽️

➡️ ons.gov.uk/peoplepopulati… 16% of adults reported experiencing very low or low food sec
Those more likely to report food insecurity included adults:

▪️ with moderate-to-severe depressive symptoms (42%)
▪️ who were economically inactive, not retired (35%),
▪️ who were unemployed (30%)
▪️ with at least one dependent child (26%)
In this period, 21% of adults were eating food past its use-by date to save money on food because of increases in the #CostOfLiving 🍞

Compared with 18% in the November to December 2022 period.
Read 7 tweets
Mar 29
We've published new qualitative analysis of Prevention of Future Death reports submitted by coroners in England and Wales from January 2021 to October 2022.

➡️ ons.gov.uk/peoplepopulati…
Coroners have a duty to issue a Prevention of Future Death (PFD) report to any person or organisation where, in the their opinion, action should be taken to prevent future deaths.
164 Prevention of Future Death reports were available for analysis:

▪️ 96 (59%) from 2021
▪️ 68 (41%) from 2022

A total of 485 concerns were raised, with an average of three concerns per report.
Read 9 tweets

Did Thread Reader help you today?

Support us! We are indie developers!


This site is made by just two indie developers on a laptop doing marketing, support and development! Read more about the story.

Become a Premium Member ($3/month or $30/year) and get exclusive features!

Become Premium

Don't want to be a Premium member but still want to support us?

Make a small donation by buying us coffee ($5) or help with server cost ($10)

Donate via Paypal

Or Donate anonymously using crypto!

Ethereum

0xfe58350B80634f60Fa6Dc149a72b4DFbc17D341E copy

Bitcoin

3ATGMxNzCUFzxpMCHL5sWSt4DVtS8UqXpi copy

Thank you for your support!

Follow Us on Twitter!

:(