We held a reading group on Transformers (watched videos / read blog posts / studied papers by @giffmana @karpathy @ch402 @amaarora @JayAlammar @srush_nlp et al.), and now I _finally_ roughly understand what attention does.
Here is my take on it. A summary thread. 1/n
Here is my take on it. A summary thread. 1/n

Consider BERT/GPT setting.
We have a text string, split into tokens (<=512). Each token gets a 768-dim vector. So we have a 2D matrix X of arbitrary width. We want to set up a feed-forward layer that would somehow transform X, keeping its shape.
How can this be set up? 2/n
We have a text string, split into tokens (<=512). Each token gets a 768-dim vector. So we have a 2D matrix X of arbitrary width. We want to set up a feed-forward layer that would somehow transform X, keeping its shape.
How can this be set up? 2/n

Fully-connected layer does not work: it cannot take input of variable length (and would have too many params anyway).
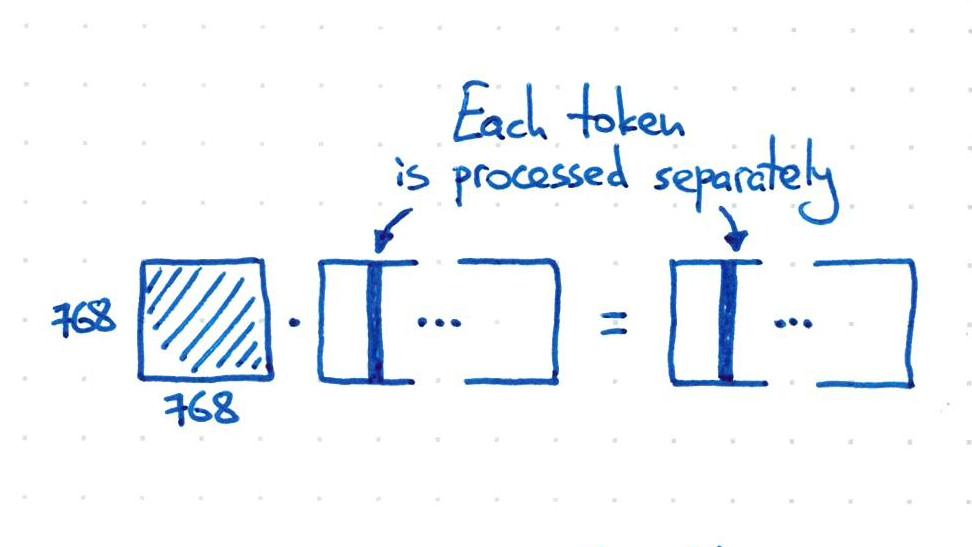
Only acting on the embedding dimension would process each token separately, which is clearly not sufficient.
How can we make the tokens interact? 3/n
Only acting on the embedding dimension would process each token separately, which is clearly not sufficient.
How can we make the tokens interact? 3/n
Here is the CORE TRICK:
X @ X.T @ X has the same shape as X, and all tokens get to interact with all other tokens (via scalar products in X.T @ X). Neat!
f(x) = X @ X.T @ X is _almost_ a self-attention layer, but this f(x) has no trainable parameters.
Can we add some? 4/n
X @ X.T @ X has the same shape as X, and all tokens get to interact with all other tokens (via scalar products in X.T @ X). Neat!
f(x) = X @ X.T @ X is _almost_ a self-attention layer, but this f(x) has no trainable parameters.
Can we add some? 4/n

Easy: we multiply each X in X @ X.T @ X with 768x768 weight matrices. They are called values, keys, and queries.
But conceptually, values can be folded into MLP later on, and keys are redundant given queries. We basically need only 1 matrix (KQ) that defines inner product. 5/n
But conceptually, values can be folded into MLP later on, and keys are redundant given queries. We basically need only 1 matrix (KQ) that defines inner product. 5/n
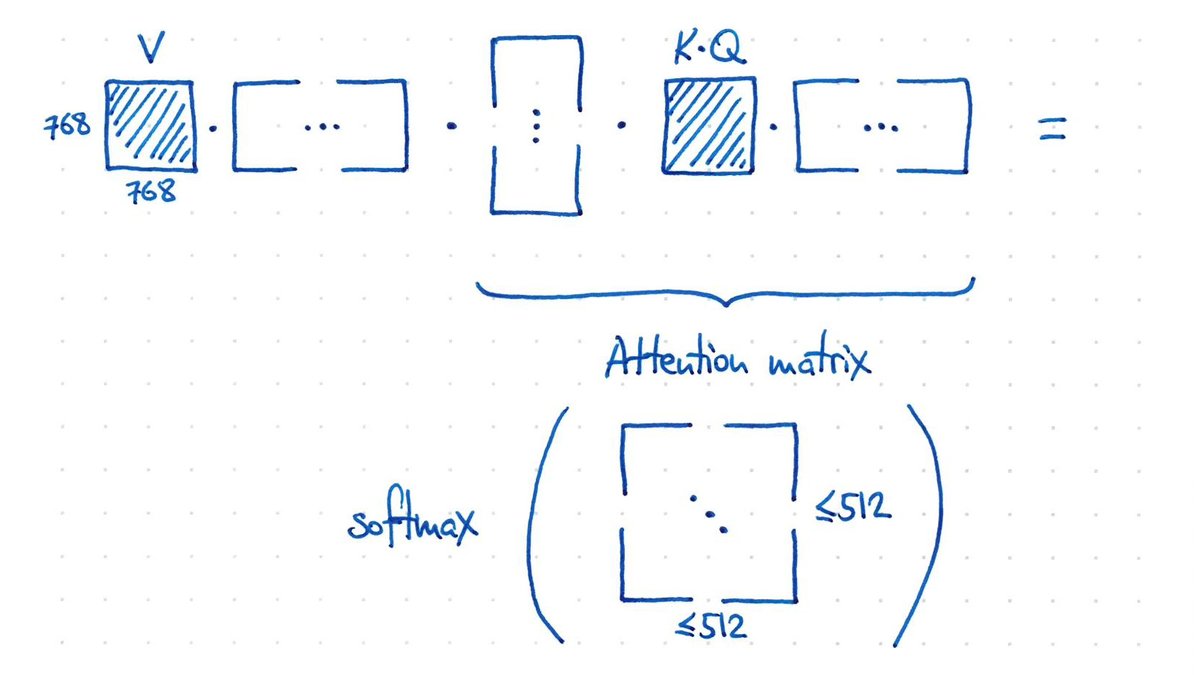
This forms "affinities" between all pairs of tokens which are normalized using softmax. We got the attention matrix!!
Then tokens are added up with attention weights.
The interpretation is that this allows each token affect each other token based on the affinity they feel. 6/n
Then tokens are added up with attention weights.
The interpretation is that this allows each token affect each other token based on the affinity they feel. 6/n
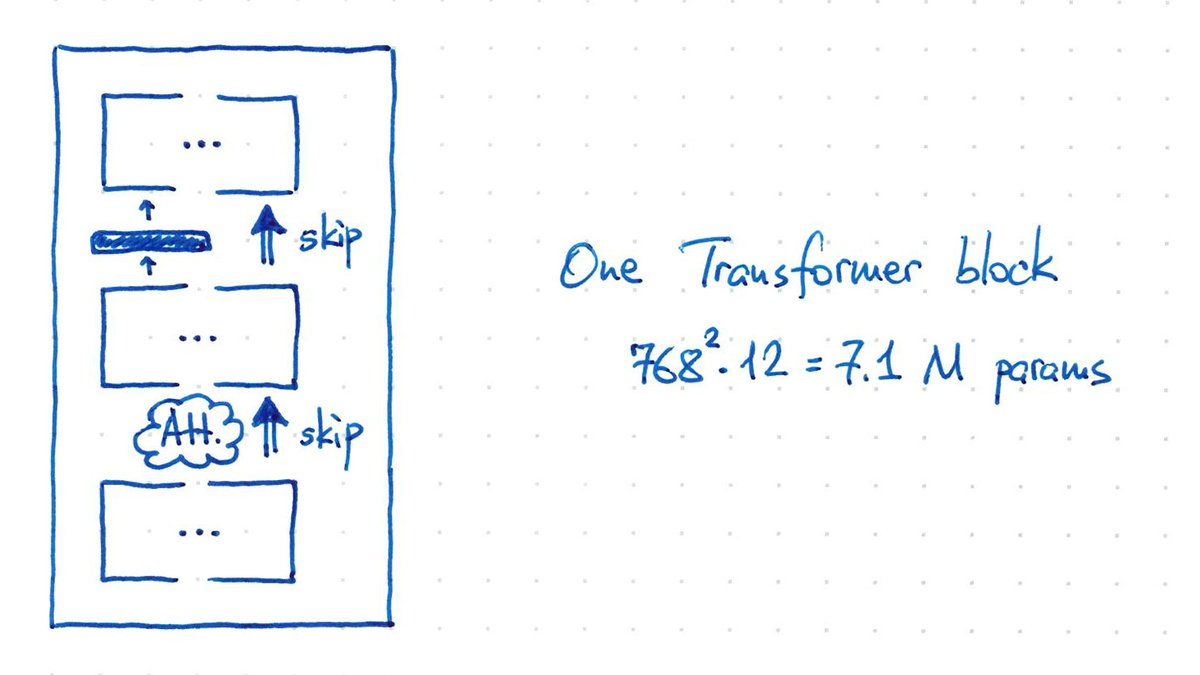
Transformer architecture interleaves attention layers with MLP layers.
An MLP layer (with 1 hidden layer) processes each token separately. Each token is processed using the same identical weights, so it's like a 1-convolution. 7/n
An MLP layer (with 1 hidden layer) processes each token separately. Each token is processed using the same identical weights, so it's like a 1-convolution. 7/n

Putting it together, our X goes through self-attention (3 * 768^2 params) and then through MLP (8 * 768^2 params), all wrapped by skip connections.
One such block has ~7M params.
BERT-base stacks 12 blocks, giving ~85M params. (Plus another 25M for initial token encoding.) 8/n
One such block has ~7M params.
BERT-base stacks 12 blocks, giving ~85M params. (Plus another 25M for initial token encoding.) 8/n
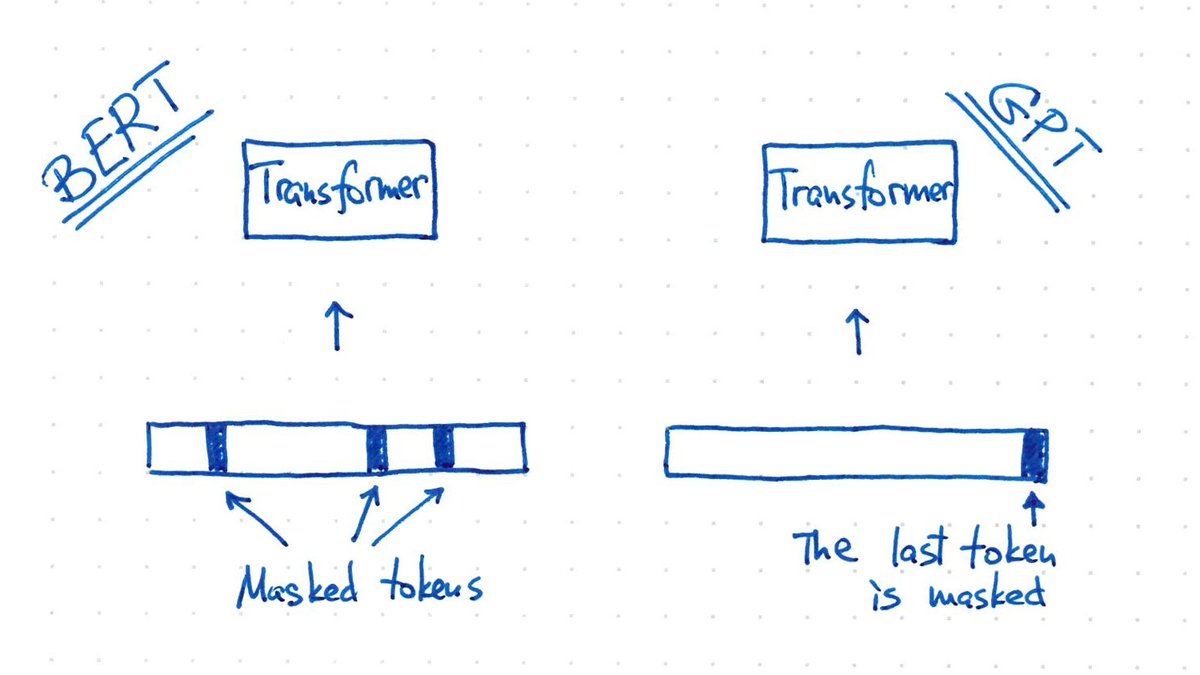
BERT and GPT use identical architecture and identical loss: they mask some input tokens and let the model predict them.
BERT masks random tokens.
GPT always masks *the last* token only.
This is what makes GPT good at generating texts: it's trained to always append a token. 9/n
BERT masks random tokens.
GPT always masks *the last* token only.
This is what makes GPT good at generating texts: it's trained to always append a token. 9/n
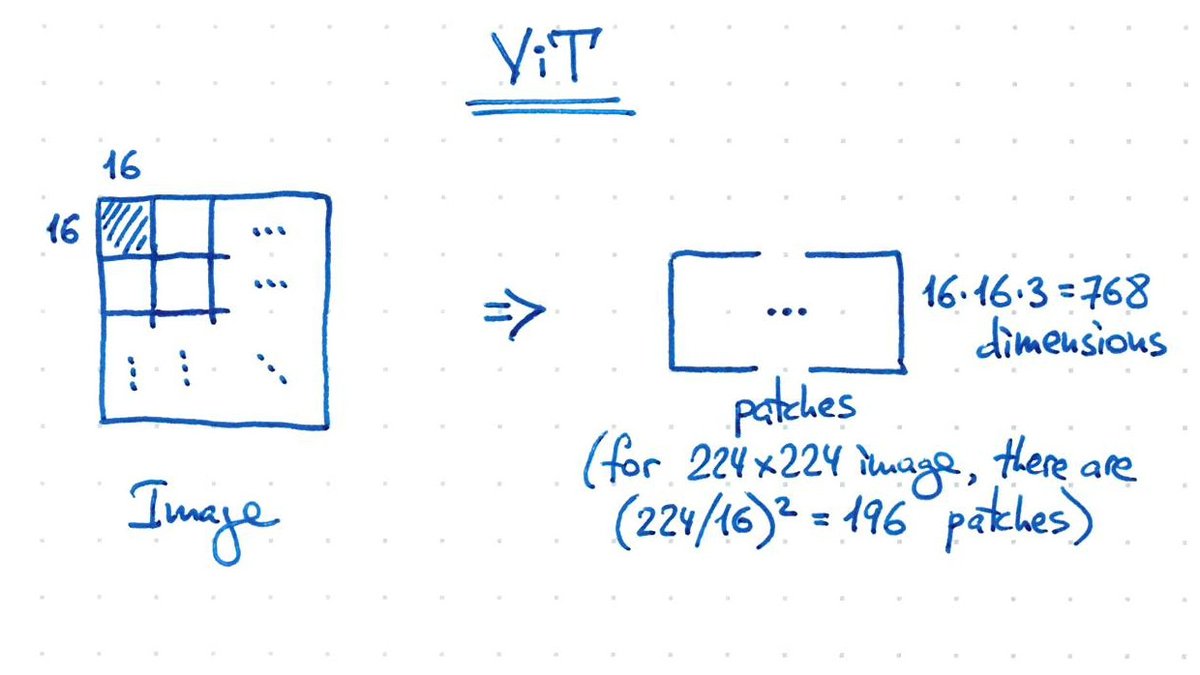
What about Vision Transformers (ViTs)?
It's the same thing!
Images are split into 16x16 patches. Patches play the role of tokens. 224x224 image gives 196 patches of 768 dimensions. This can directly go into a BERT-like architecture + classifier softmax on top. 10/n
It's the same thing!
Images are split into 16x16 patches. Patches play the role of tokens. 224x224 image gives 196 patches of 768 dimensions. This can directly go into a BERT-like architecture + classifier softmax on top. 10/n
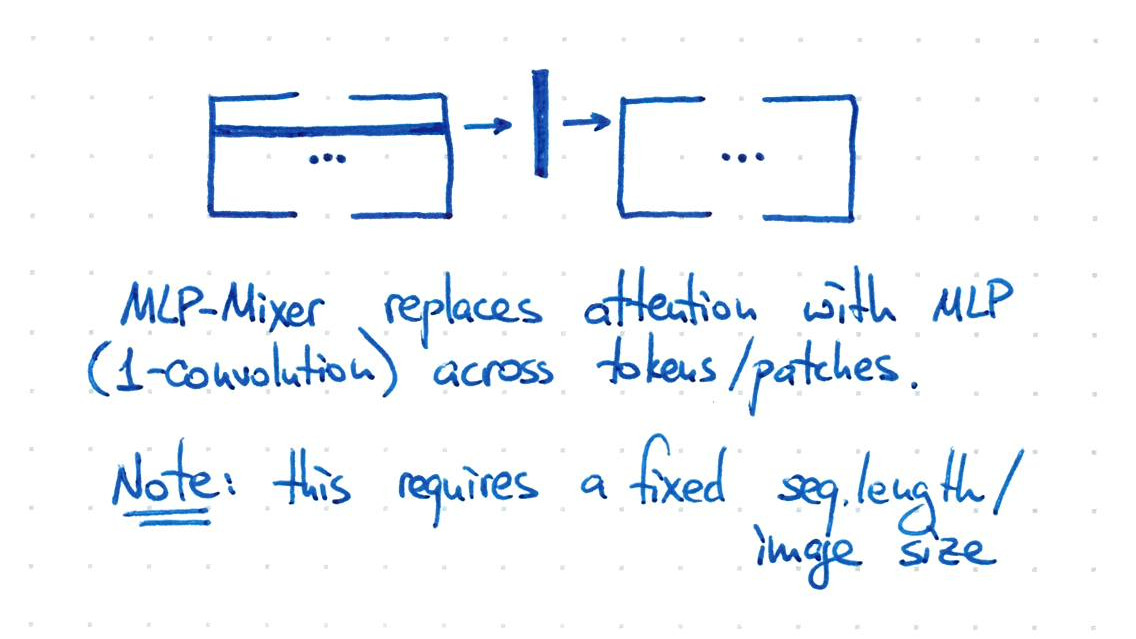
The Google team behind ViTs (@giffmana) later showed that one can replace all attention layers with "1-convolution" *horizontal* MLPs (each dimension processed separately). That's "MLP-Mixer".
Amazing that it works!
But with a big caveat: it requires a fixed input size :( 11/n
Amazing that it works!
But with a big caveat: it requires a fixed input size :( 11/n
RESOURCES:
1. Intro lecture on Transformers by @giffmana:
2. Building nanoGPT from scratch by @karpathy:
3. Analyzing attention-only circuits by @ch402 and team: transformer-circuits.pub/2021/framework…
I highly recommend all three! 12/12
1. Intro lecture on Transformers by @giffmana:
2. Building nanoGPT from scratch by @karpathy:
3. Analyzing attention-only circuits by @ch402 and team: transformer-circuits.pub/2021/framework…
I highly recommend all three! 12/12
Update:
4. Transformers from scratch by @pbloemesquire: peterbloem.nl/blog/transform….
I haven't seen this blog post before, but it's brilliant! The best blog post about transformers that I've seen. Highly recommended. 13/12
4. Transformers from scratch by @pbloemesquire: peterbloem.nl/blog/transform….
I haven't seen this blog post before, but it's brilliant! The best blog post about transformers that I've seen. Highly recommended. 13/12
• • •
Missing some Tweet in this thread? You can try to
force a refresh