
Researcher at Ghent University and VIB-AI. Manifold learning, contrastive learning, scRNAseq data. Excess mortality. Born but to die and reas'ning but to err.
 Many have noticed that ChatGPT likes the word "delve". Or "crucial". Or "intricate".
 We took all (21M) English abstracts from PubMed, used a BERT model (PubMedBERT) to transform them into 768D vectors, and then used t-SNE to visualize them in 2D.
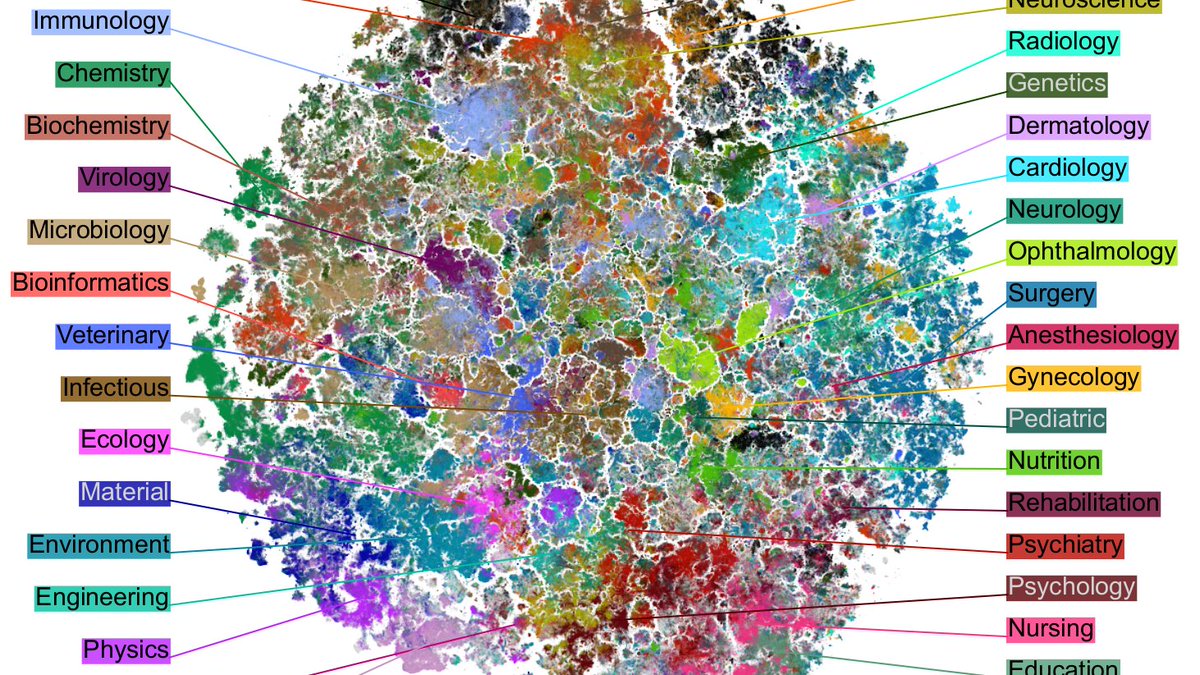
 Consider BERT/GPT setting.
 In prior work, we (@jnboehm @CellTypist) showed that UMAP works like t-SNE with extra attraction. We argued that it is because UMAP relies on negative sampling, whereas t-SNE does not.
 What is "underdispersion"? Here is an example. Russia reported the following number of Covid deaths during the first week of September 2021: 792, 795, 790, 798, 799, 796, 793.
 These peaks are formed by polling stations that report integer turnout percentage or United Russia percentage. E.g. 1492 ballots cast at a station with 1755 registered voters. 1492/1755 = 85.0%. Important: 1492 is not a suspicious number! It's 85.0% which is suspicious. [2/n]
 The paper has several parts and I have too many comments for a twitter thread, so here I will only focus on the core of the authors' argument against t-SNE/UMAP, namely Figures 2 and 3. We can discuss the rest some other time. [2/n]
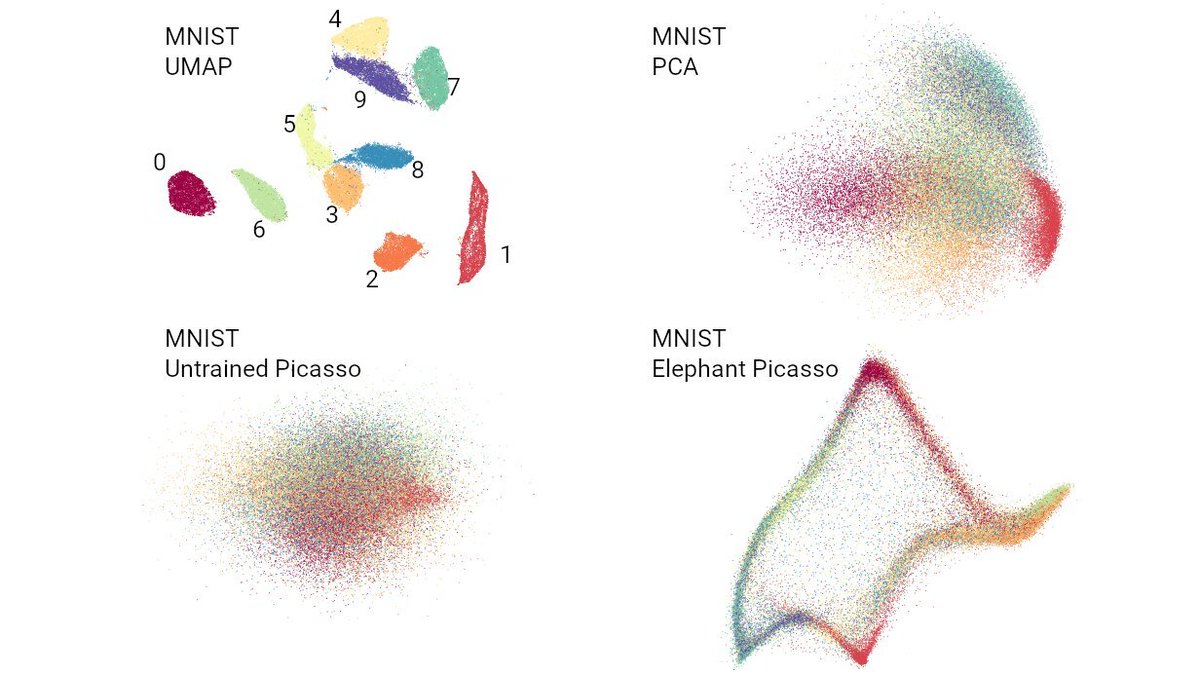
 Here is MNIST.
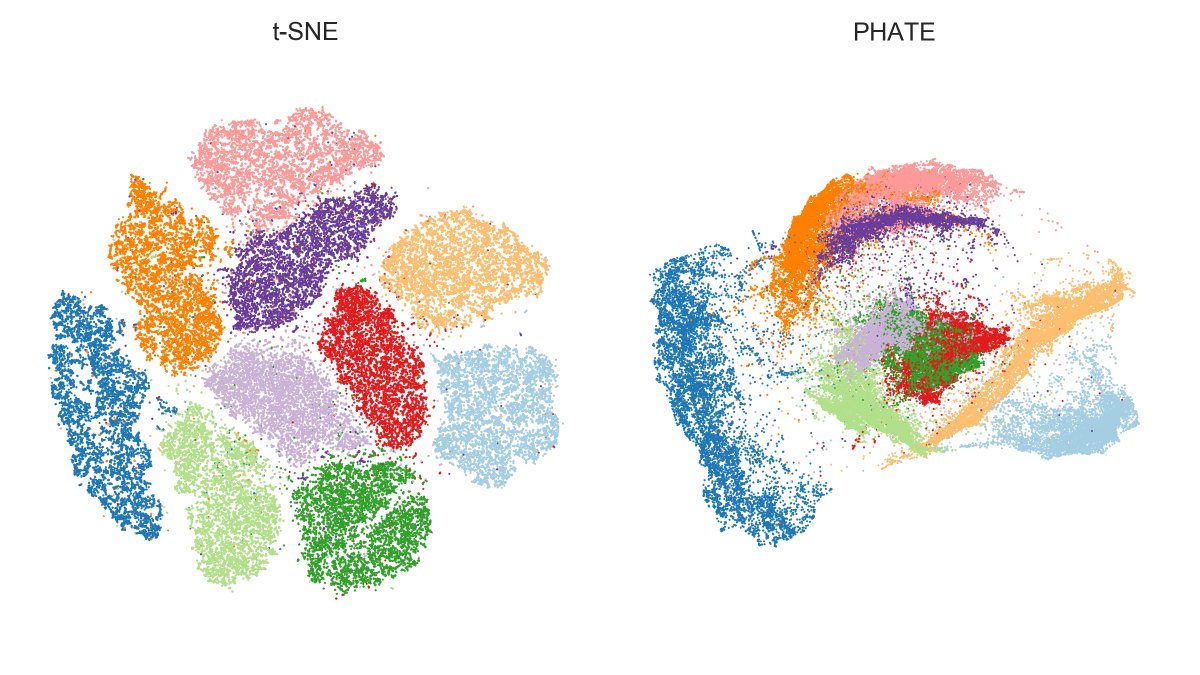
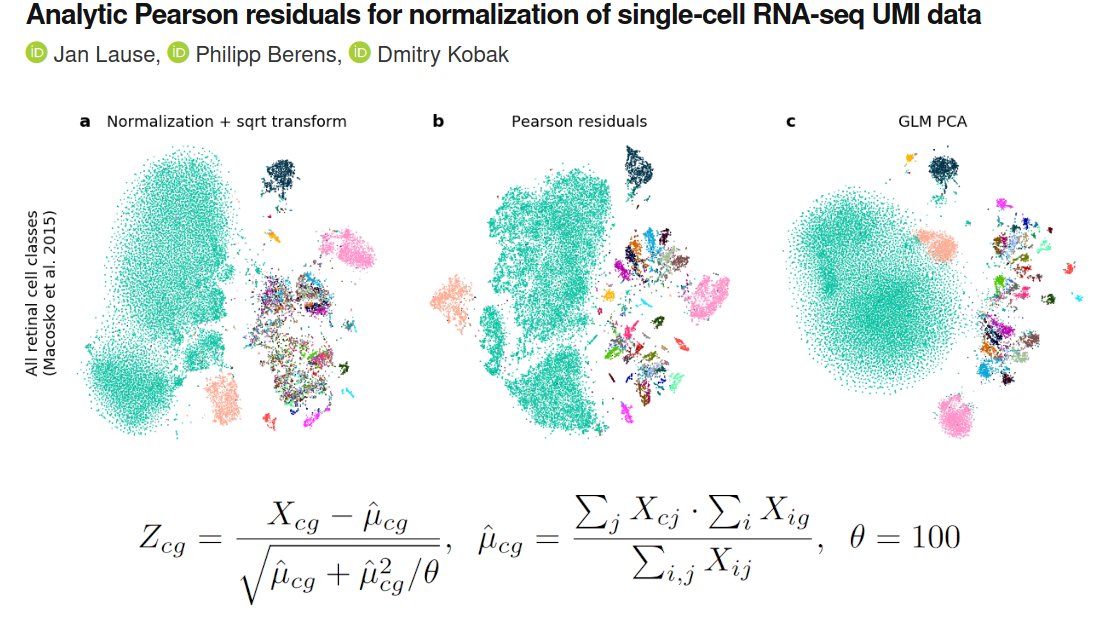 Our project began when we looked at Fig 2 in Hafemeister & Satija 2019 (genomebiology.biomedcentral.com/articles/10.11…) who suggested to use NB regression (w/ smoothed params), and wondered:
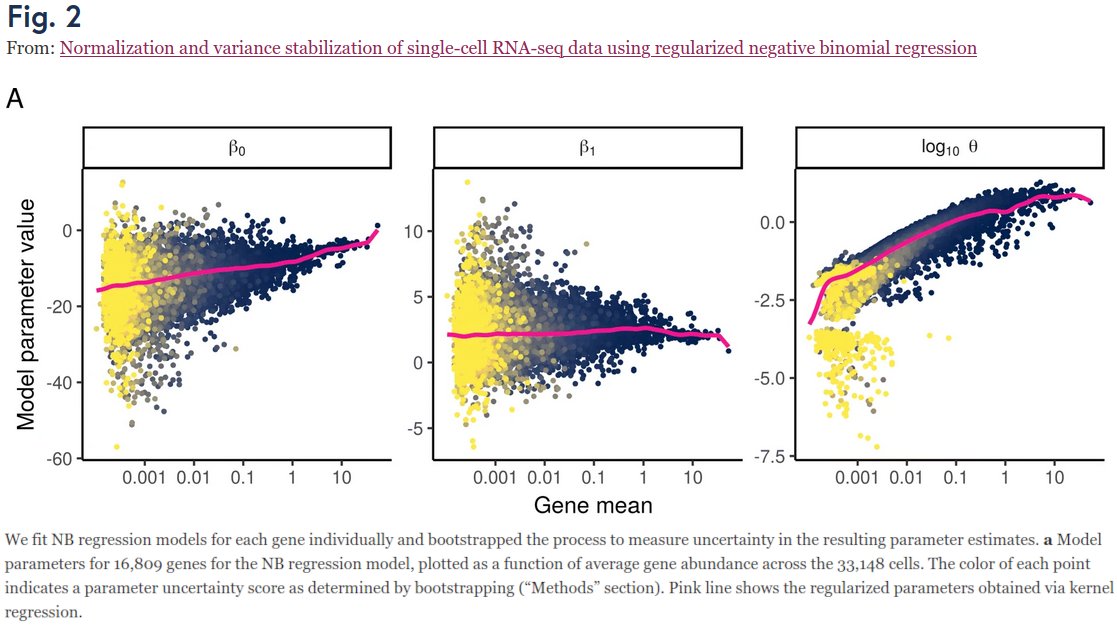
 Here is the original tweet by @jhnhw. His write-up: johnhw.github.io/umap_primes/in…. UMAP preprint v2 by @leland_mcinnes et al. has a figure with 30,000,000 (!) integers.
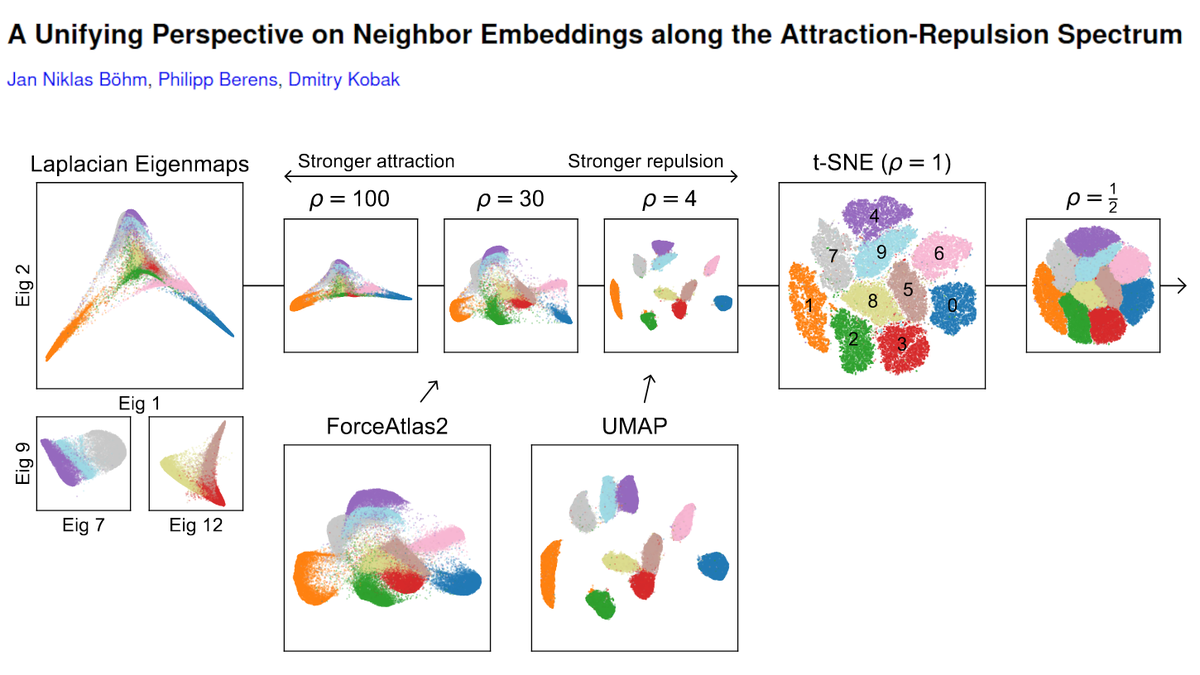 We get the spectrum by changing the "exaggeration" in t-SNE, i.e. multiplying all attractive forces by a constant factor ρ. Prior work by @GCLinderman et al. showed that ρ->inf corresponds to Laplacian eigenmaps. We argue that the entire spectrum is interesting. [2/n]
 The term "double descent" was coined by Belkin et al 2019 pnas.org/content/116/32… but the same phenomenon was also described in two earlier preprints: Spigler et al 2019 iopscience.iop.org/article/10.108… and Advani & Saxe 2017 arxiv.org/abs/1710.03667 (still unpublished?) (2/n)
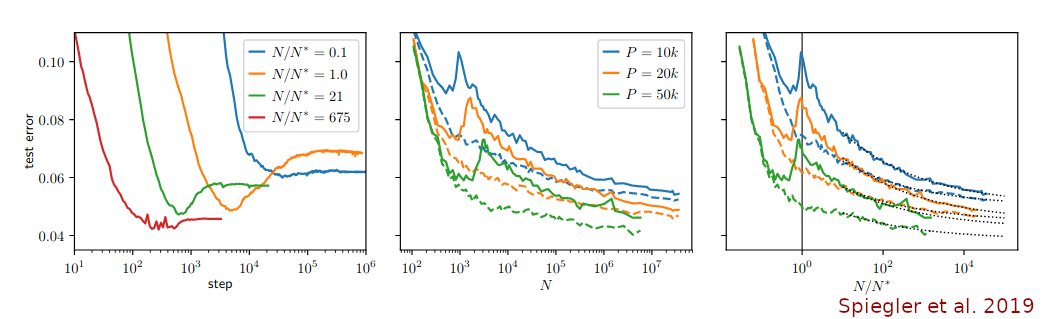


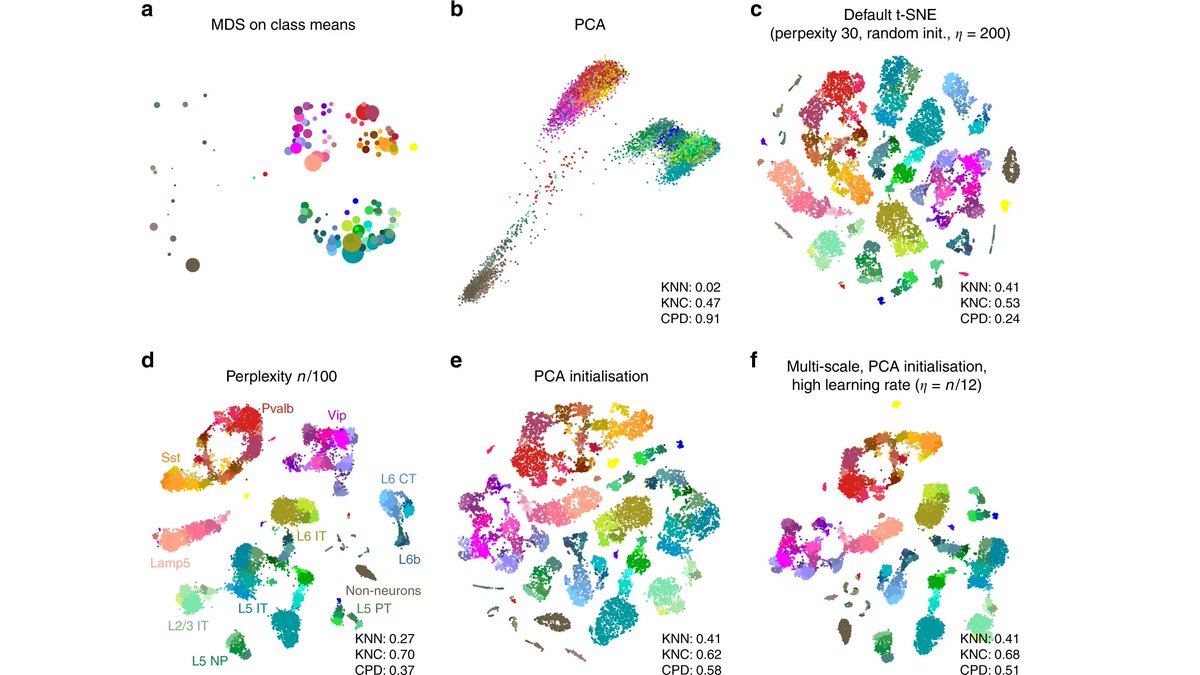 FIRST, the initialisation. Most implementations of t-SNE use random initialisation: points are initially placed randomly and gradient descent then makes similar points attract each other and collect into clusters. We argue that random initialisation is often a bad idea (2/16).