We finally got its name: ICT Silver Bullet Model
Video timestamps: [49:24 - 1:08:00]
ICT introduced this everyday trading model that always takes place between 10am & 11am EST last week on the "Until the Brakes Fall Off..."
In todays ICT Livestream we got a lot more info!
Video timestamps: [49:24 - 1:08:00]
ICT introduced this everyday trading model that always takes place between 10am & 11am EST last week on the "Until the Brakes Fall Off..."
In todays ICT Livestream we got a lot more info!


March 30, 2023 Live Tape Reading - AM Session
Video timestamps: [49:24 - 1:08:00]
Video timestamps: [49:24 - 1:08:00]
- Everyday between 10am & 11am EST
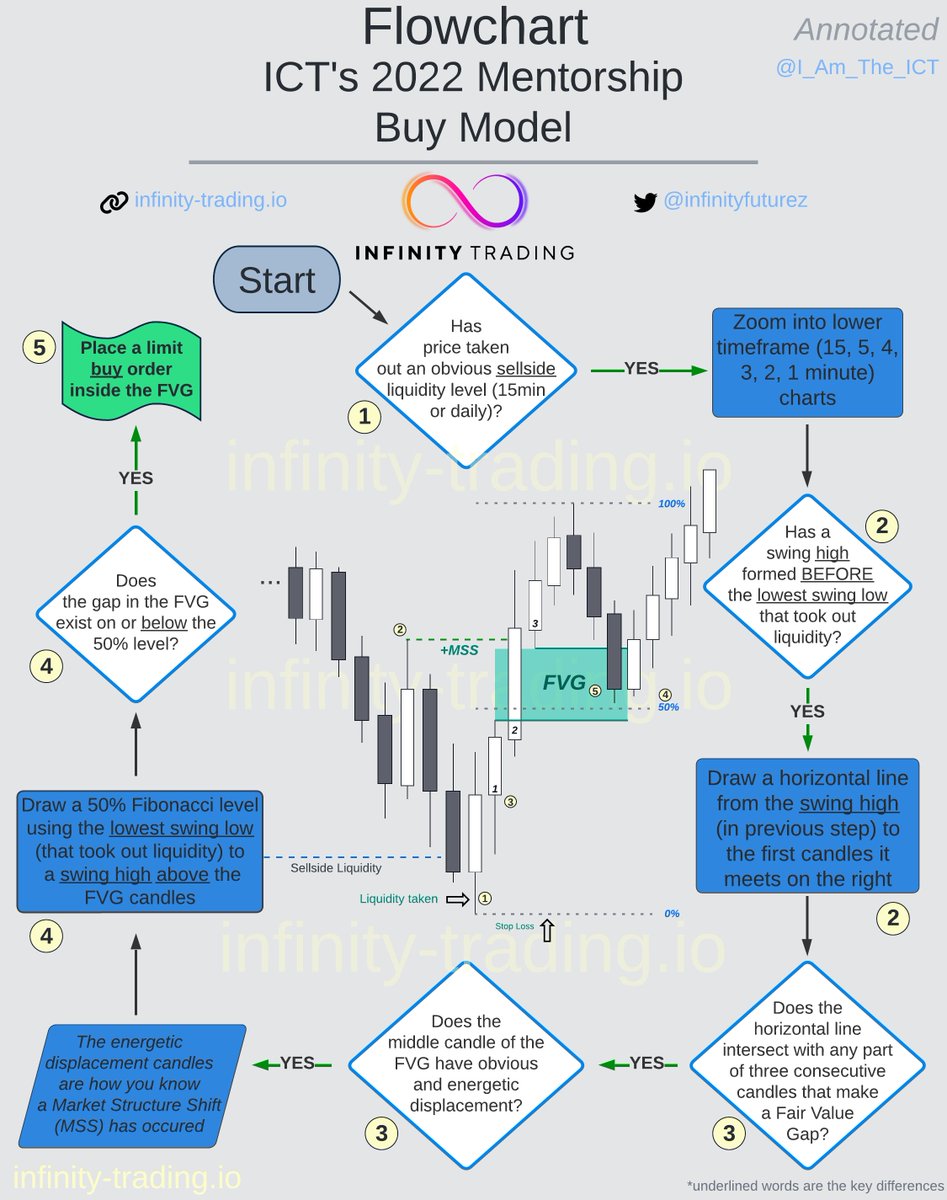
- Identify an obvious pool of liquidity that has not been tapped into or engaged
- Wait for displacement towards liquidity pool between 10am & 11am
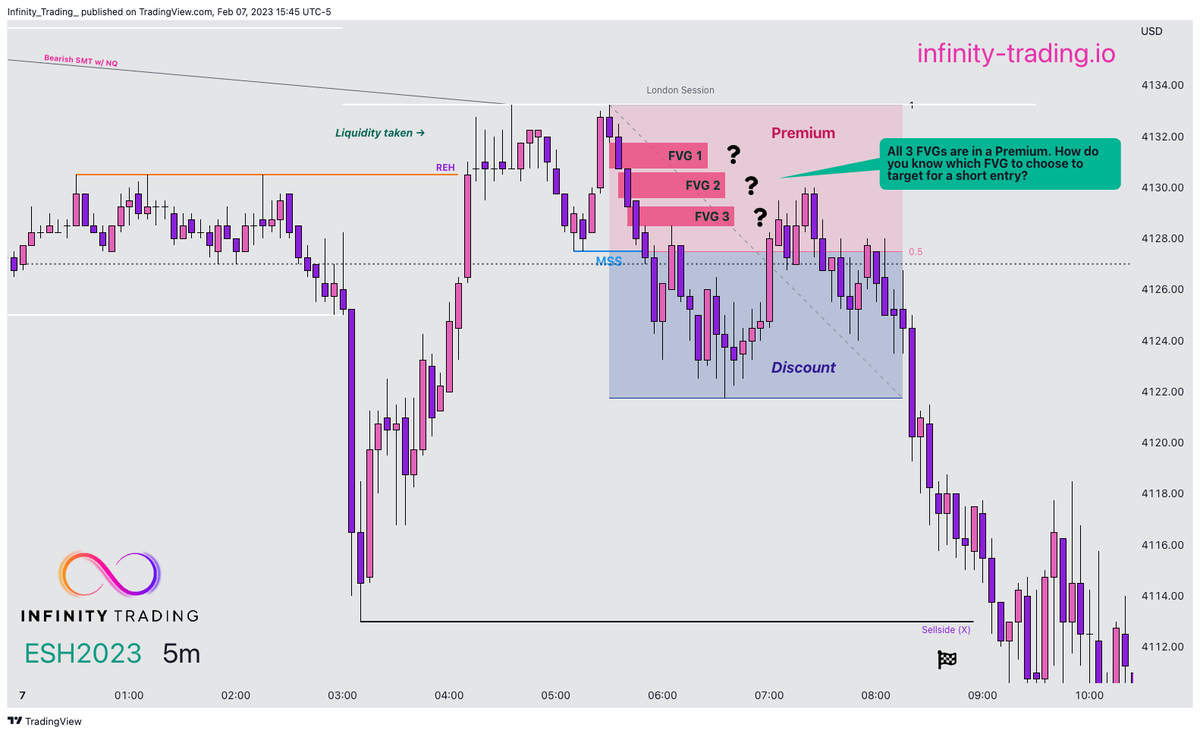
- Find a FVG (FVG has to be opposite the targeted liquidity pool)
- Identify an obvious pool of liquidity that has not been tapped into or engaged
- Wait for displacement towards liquidity pool between 10am & 11am
- Find a FVG (FVG has to be opposite the targeted liquidity pool)
- Wait for price to trade back into FVG and then reprice out of the FVG towards the targeted pool of liquidity
- Then drop down to the 1-min, 30-sec, 15-sec chart and start looking for a second FVG
- Then drop down to the 1-min, 30-sec, 15-sec chart and start looking for a second FVG
- The next FVG you see on the 1-min, 30-sec, 15-sec chart (after price has traded back into the higher timeframe FVG) instantly enter the trade in the direction of the targeted liquidity pool
- Trader needs to validate whether the range from their potential FVG entry and Liquidity Pool is greater than 5 handles
- Take profit after 5 handles of profit (or liquidity pool reached)
- Take profit after 5 handles of profit (or liquidity pool reached)
Here is the link to the original Twitter Space where ICT introduced the ICT Silver Bullet
https://twitter.com/infinitytradeIO/status/1639828427162234881?s=20
• • •
Missing some Tweet in this thread? You can try to
force a refresh