Canadians, when are we going to do something about COVID?
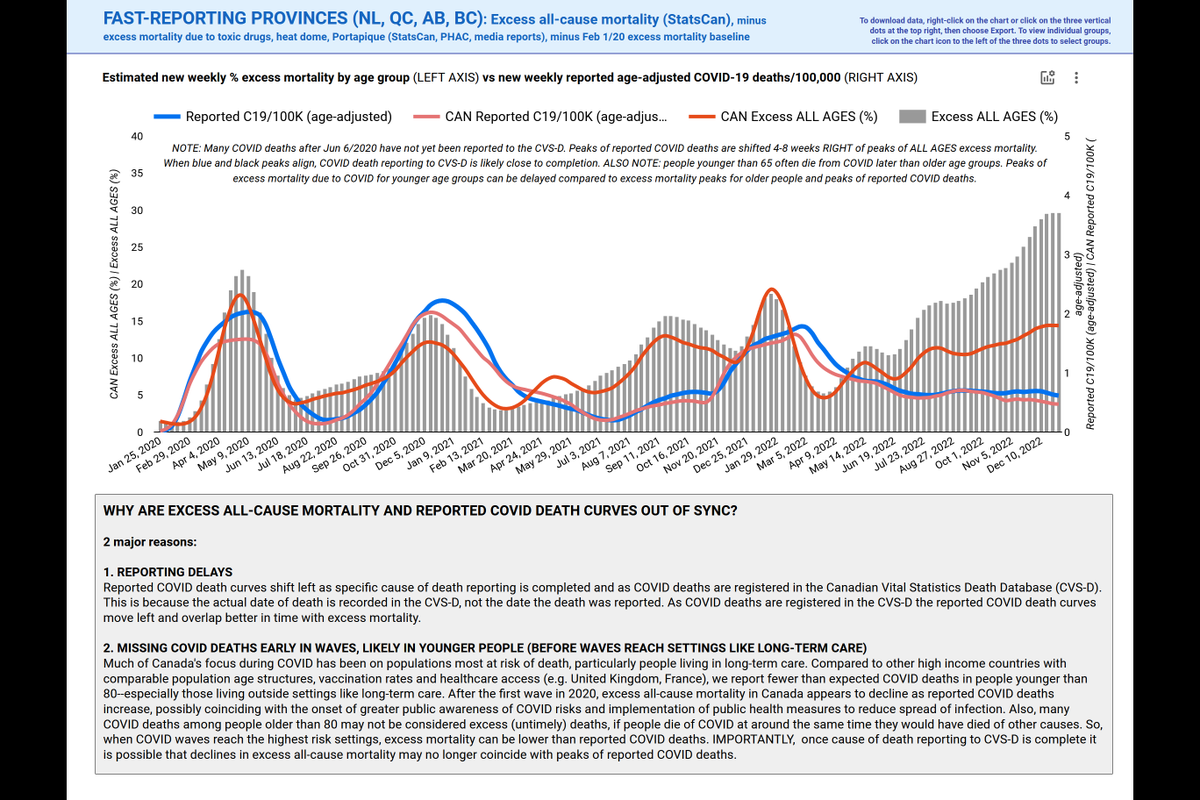
The gray bars in this chart are % excess mortality from Jan 25/20-Dec 31/22 in Canada's fastest reporting provinces: NL, QC, AB, BC.
Dec 31/22 excess mortality is at the peak of the 1st wave of 2020.
This is grotesque.
The gray bars in this chart are % excess mortality from Jan 25/20-Dec 31/22 in Canada's fastest reporting provinces: NL, QC, AB, BC.
Dec 31/22 excess mortality is at the peak of the 1st wave of 2020.
This is grotesque.

For those not familiar with our work, this is excess mortality AFTER subtracting excess deaths attributable to toxic drugs and heat waves.
Further down this thread I'll show you how many of these deaths are likely EXCESS deaths directly attributable to COVID.
Further down this thread I'll show you how many of these deaths are likely EXCESS deaths directly attributable to COVID.
I am so angry at what we've let happen that I don't know what to do.
Are we really THIS?
Yes, frankly we are, as anyone whose lives are systemically valued less due to all the isms we publicly decry knows well.
This is grotesque.
Are we really THIS?
Yes, frankly we are, as anyone whose lives are systemically valued less due to all the isms we publicly decry knows well.
This is grotesque.
Sorry. The picture above was NOT Canada's fast-reporting provinces. It was Quebec, Canada's fastest-reporting provinces and the only province that still tries to track and report COVID in a transparent, complete fashion.
More than 35% excess mortality on Dec 31/22.
More than 35% excess mortality on Dec 31/22.

I'm not sure if anyone even remembers Quebec's mortality rate from the first wave of 2020. It was among the highest in the world.
On Dec 31/22 it was as high as the peak of the first wave.
And QC still hasn't reported much of its all-cause mortality among people 0-44 years.
On Dec 31/22 it was as high as the peak of the first wave.
And QC still hasn't reported much of its all-cause mortality among people 0-44 years.

I'm so angry I'm shaking. I have to calm down so I can write this thread and attach the right images to the right tweets.
Here is % excess mortality for Canada's fastest reporting provinces (NL, QC, AB, BC).
This is the graph I should have attached earlier in the thread.
30% excess mortality on Dec 31/22, with outstanding reporting still.
Far higher than any previous COVID wave in Canada to date
This is the graph I should have attached earlier in the thread.
30% excess mortality on Dec 31/22, with outstanding reporting still.
Far higher than any previous COVID wave in Canada to date

Total drug/heat wave-adjusted excess mortality in Canada for the COVID epidemic to Dec 31/22.
76,679 EXCESS deaths
Huge amounts of death reporting outstanding, especially in Ontario, the largest province with presumably the greatest reporting capacity (financial, personnel).
76,679 EXCESS deaths
Huge amounts of death reporting outstanding, especially in Ontario, the largest province with presumably the greatest reporting capacity (financial, personnel).

Here are average weekly REPORTED COVID hospitalizations, ICU admissions, deaths and excess mortality, by year.
Even with large amounts of outstanding all-cause mortality reporting, look at excess deaths for 2022.
Compare to hospitalizations.
Even with large amounts of outstanding all-cause mortality reporting, look at excess deaths for 2022.
Compare to hospitalizations.

These are just the reported hospital and ICU admissions. If I start going off about how few of these are actually reported in Ontario and Atlantic Canada especially I may blow up. Or give up.
How much all-cause mortality reporting is still outstanding in Canada?
This is an estimate, but so far we've been right over and over.
An estimated 51,000 deaths not yet reported to the CVS-D. 42,000 of these in 2022.
Outstanding cause of death reporting: 137,000
This is an estimate, but so far we've been right over and over.
An estimated 51,000 deaths not yet reported to the CVS-D. 42,000 of these in 2022.
Outstanding cause of death reporting: 137,000

Here are expected EXCESS Omicron deaths ("from" not "with" COVID deaths) for Quebec (top right panel)
Pink is reported deaths. Black is expected excess COVID deaths. Blue is reported all-cause excess deaths.
This summer, for the first time ever, QC began missing COVID deaths.
Pink is reported deaths. Black is expected excess COVID deaths. Blue is reported all-cause excess deaths.
This summer, for the first time ever, QC began missing COVID deaths.

The other provinces you see in above still have outstanding all-cause mortality reporting.
But here's Newfoundland and Labrador, a fast-reporting province (top right).
Compare black (expected excess COVID), blue (excess all-cause deaths), pink (reported C19 death) curves.
But here's Newfoundland and Labrador, a fast-reporting province (top right).
Compare black (expected excess COVID), blue (excess all-cause deaths), pink (reported C19 death) curves.

And here are Alberta (top right) and BC (bottom left).
We have to finish running more iterations of the model for SK BTW, so it's still a bit funny-shaped.
We have to finish running more iterations of the model for SK BTW, so it's still a bit funny-shaped.

How do we estimate how many EXCESS COVID deaths we should be seeing?
Using a model you can find at our weekly report that takes into account province-specific population age structures, vaccination rates, normal life expectancy, seroprevalence, seroprevalence-adjusted province-specific hospital and ICU admissions reported by @CIHI_ICIS.
@CIHI_ICIS The model takes into account deaths from reinfections, and is based on age-specific IFRs estimated from IFRs calculated using seroprevalence-adjusted excess mortality rates.
We correct for incidental COVID deaths (and hospitalizations) using prevalence estimates.
We correct for incidental COVID deaths (and hospitalizations) using prevalence estimates.
@CIHI_ICIS Because published seroprevalence-based IFRs are calculated for extended periods, our estimates become more accurate as deaths accumulate. This is because big peaks of excess mortality are often followed by troughs (mortality displacement). Over time, this effect averages.
@CIHI_ICIS Anyway, I'm done explaining methods here, and will prioritize writing papers since sharing data publicly has achieved little when it comes to alerting policy makers to problems we need to address.
Whatever the reasons are, from sea to sea to sea we see no evil hear no evil.
Whatever the reasons are, from sea to sea to sea we see no evil hear no evil.
@CIHI_ICIS We'll be posting the Canadian COVID Forecast tomorrow.
It's been a hell of a month, and we did post last week but I didn't have time to do a thread.
But I finished the analysis this morning and the graphics folks are working away now.
It's been a hell of a month, and we did post last week but I didn't have time to do a thread.
But I finished the analysis this morning and the graphics folks are working away now.
@CIHI_ICIS And if you're reading this and are thinking I should be more civil publicly, remember, I never have and I never do name names or call people out. I understand all the pressures, including the ones directed toward employment or access to research resources and funding.
@CIHI_ICIS I will call out public leaders who have direct responsibility for communicating accurately and honestly with the public AND whose job description is doing this.
And I am well aware that much of this can be laid at the feet of our political leaders in this country of secrecy.
And I am well aware that much of this can be laid at the feet of our political leaders in this country of secrecy.
@CIHI_ICIS Bad news always comes out. At least we have institutions like CIHI and StatsCan mandated to share health data in a way not subject to the whims or data massage of provinces (unlike our beleaguered national public health agency, which was formed to avoid what is happening now).
@CIHI_ICIS As data have become worse and worse it has become harder and harder to decipher what is really happening. But it is possible, as long as we have national institutions like CIHI and StatsCan and PHAC.
@CIHI_ICIS We haven't quite finished updating the COVID Forecast Dashboard of our weekly Canadian COVID data report with this week's forecast data, but the other graphs are all updated.
And some graphs are broken, so we're working on that (notes show which ones are screwing up).
And some graphs are broken, so we're working on that (notes show which ones are screwing up).
@CIHI_ICIS Here's the link to the weekly report.
We'll release this week's COVID Forecast tomorrow morning (and finish updating/fixing the weekly report by then).
covid19resources.ca/datadiscussion…
We'll release this week's COVID Forecast tomorrow morning (and finish updating/fixing the weekly report by then).
covid19resources.ca/datadiscussion…
One more thing. For first 6 months of Omi, infections were disproportionately among people younger than 40. In a massive wave of first- time infections starting in summer the over 40s started catching up. This is the mortality we're seeing now. Plus reinfections in over 40s.
@threadreaderapp unroll please
And here is our Canadian COVID Forecast for the week of Apr 2-8
https://twitter.com/MoriartyLab/status/1642686286690410503?s=20
• • •
Missing some Tweet in this thread? You can try to
force a refresh

 Read on Twitter


